| Param | Original file | Final file |
|---|---|---|
| Filename | modeM0/AS1A05_037T01_9000003140_21242cztM0_level2.evt | modeM0/AS1A05_037T01_9000003140_21242cztM0_level2_quad_clean.evt |
| Size (bytes) | 1,001,859,840 | 151,346,880 |
| Size | 955.4 MB | 144.3 MB |
| Events in quadrant A | 6,475,038 | 934,310 |
| Events in quadrant B | 6,876,526 | 949,743 |
| Events in quadrant C | 6,291,825 | 928,668 |
| Events in quadrant D | 9,802,808 | 855,690 |
| Mode M9 | |||
|---|---|---|---|
| Quadrant | BADHDUFLAG | Total packets | Discarded packets |
| A | 0 | 16 | 0 |
| B | 0 | 16 | 0 |
| C | 0 | 16 | 0 |
| D | 0 | 16 | 0 |
| Mode M0 | |||
|---|---|---|---|
| Quadrant | BADHDUFLAG | Total packets | Discarded packets |
| A | 0 | 27635 | 4 |
| B | 0 | 28735 | 3 |
| C | 0 | 27182 | 3 |
| D | 0 | 38054 | 3 |
| Mode SS | |||
|---|---|---|---|
| Quadrant | BADHDUFLAG | Total packets | Discarded packets |
| A | 0 | 270 | 0 |
| B | 0 | 270 | 0 |
| C | 0 | 270 | 0 |
| D | 0 | 270 | 0 |
| Quadrant | Total seconds | Saturated seconds | Saturation percentage |
|---|---|---|---|
| A | 13243 | 153 | 1.155327% |
| B | 13244 | 212 | 1.600725% |
| C | 13244 | 197 | 1.487466% |
| D | 13244 | 849 | 6.410450% |
Noise dominated data is calculated using 1-second bins in cleaned event files. If a bin has >2000 counts, and if more than 50% of those come from <1% of pixels, then it is considered to be noise-dominated and hence unusable.
| Quadrant | # 1 sec bins | Bins with >0 counts | Bins with >2000 counts | High rate bins dominated by noise | Noise dominated (total time) | Noise dominated (detector-on time) | Marked lightcurve |
|---|---|---|---|---|---|---|---|
| A | 14863 | 13245 | 20 | 20 | 0.13% | 0.15% | 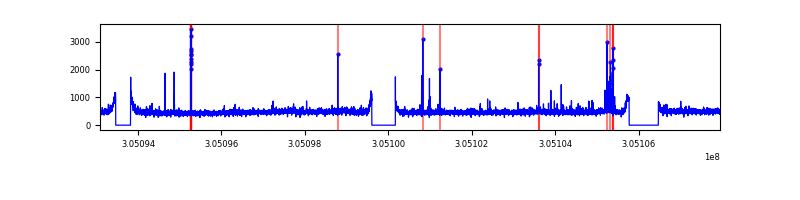 |
| B | 14864 | 13246 | 28 | 28 | 0.19% | 0.21% | 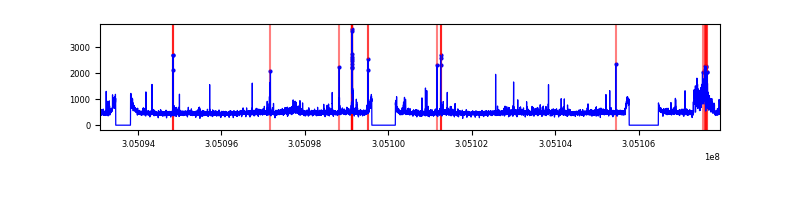 |
| C | 14864 | 13246 | 2 | 2 | 0.01% | 0.02% | 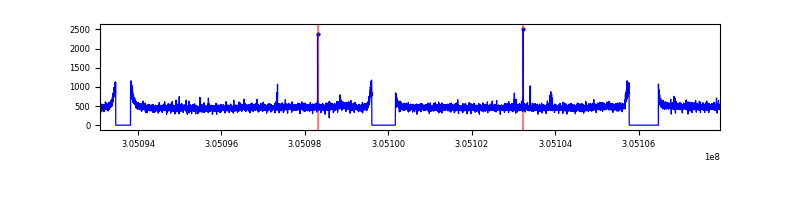 |
| D | 14864 | 13246 | 587 | 587 | 3.95% | 4.43% | 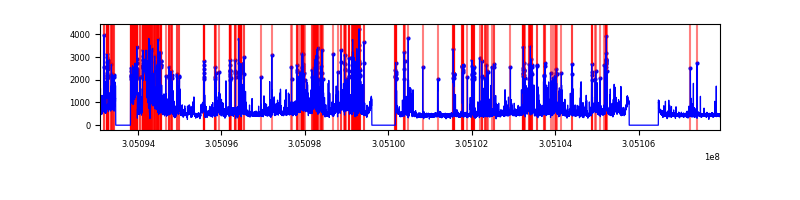 |
Top three noisy pixels from each quadrant. If the there are fewer than three noisy pixels in the level2.evt file, extra rows are filled as -1
| Pixel properties | Quadrant properties | ||||||
|---|---|---|---|---|---|---|---|
| Quadrant | DetID | PixID | Counts | Sigma | Mean | Median | Sigma |
| A | 5 | 16 | 130945 | 396.9 | 1606 | 1569 | 326.0 |
| A | 12 | 96 | 64911 | 194.32 | 1606 | 1569 | 326.0 |
| A | 15 | 236 | 46493 | 137.82 | 1606 | 1569 | 326.0 |
| B | 3 | 64 | 294915 | 955.58 | 1607 | 1568 | 307.0 |
| B | 0 | 189 | 67016 | 213.2 | 1607 | 1568 | 307.0 |
| B | 0 | 197 | 56248 | 178.12 | 1607 | 1568 | 307.0 |
| C | 14 | 238 | 238256 | 655.08 | 1544 | 1555 | 361.3 |
| C | 0 | 207 | 27002 | 70.43 | 1544 | 1555 | 361.3 |
| C | 13 | 61 | 10816 | 25.63 | 1544 | 1555 | 361.3 |
| D | 7 | 238 | 1967381 | 5379.68 | 1507 | 1465 | 365.4 |
| D | 1 | 239 | 1022184 | 2793.17 | 1507 | 1465 | 365.4 |
| D | 1 | 52 | 358329 | 976.55 | 1507 | 1465 | 365.4 |
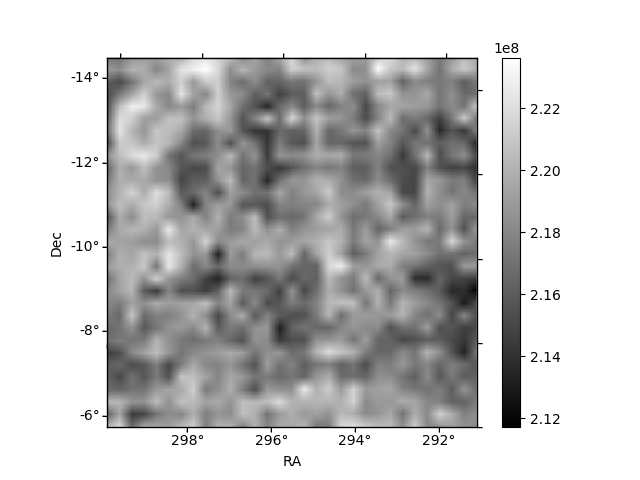
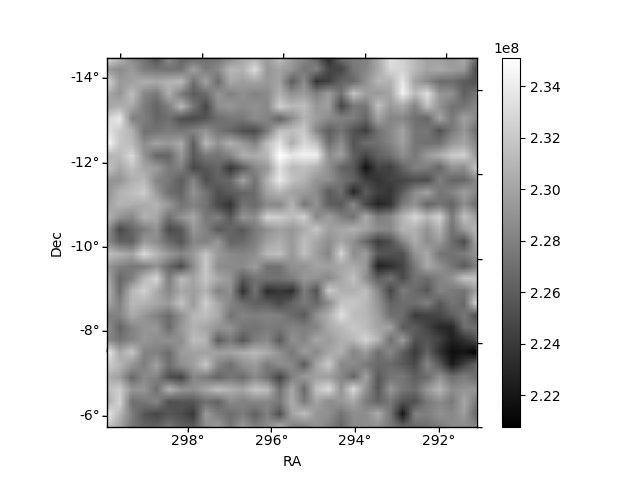
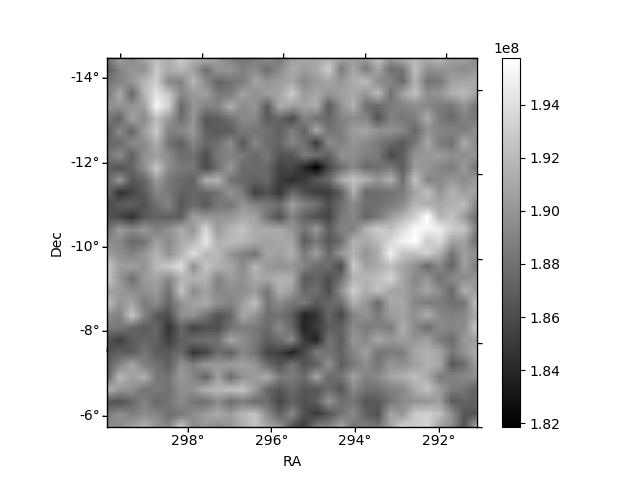
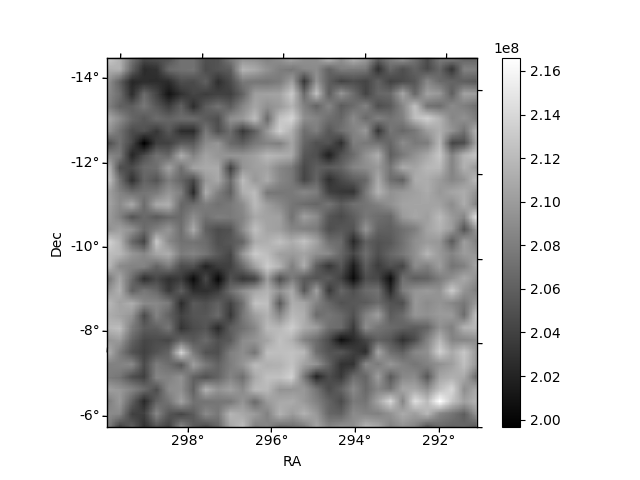
Histogram calculated using DETX and DETY for each event in the final _common_clean file
| Quadrant A | 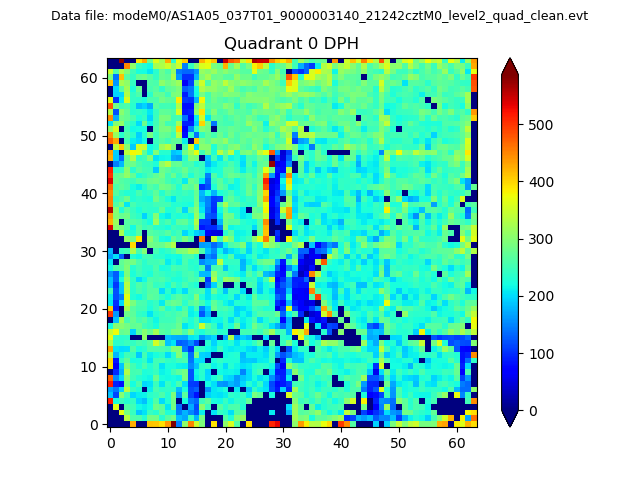 |
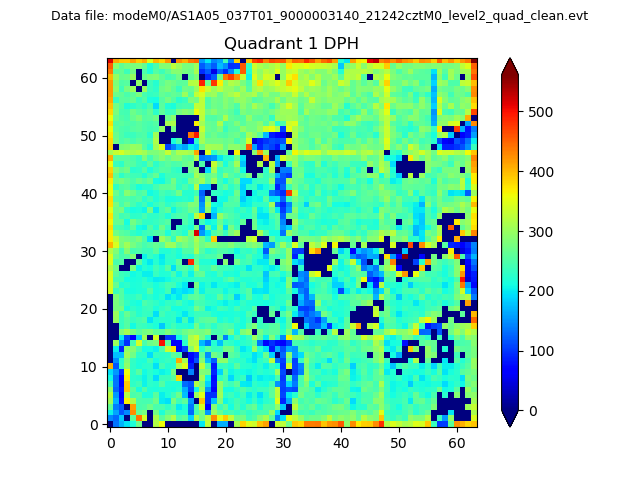 |
Quadrant B |
|---|---|---|---|
| Quadrant D | 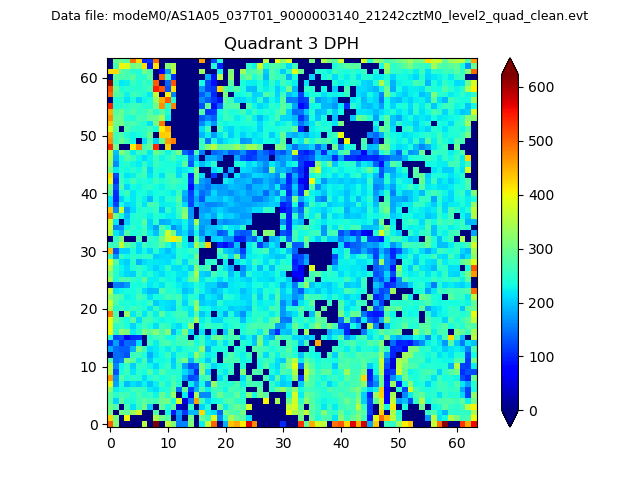 |
 |
Quadrant C |
| Plot type | Count rate plots | Images |
|---|---|---|
| Comparison with Poisson distribution Blue bars denote a histogram of data divided into 1 sec bins. Red curve is a Poisson curve with rate = median count rate of data. |
 |
 |
| Quadrant-wise count rates Data is divided into 100 sec bins |
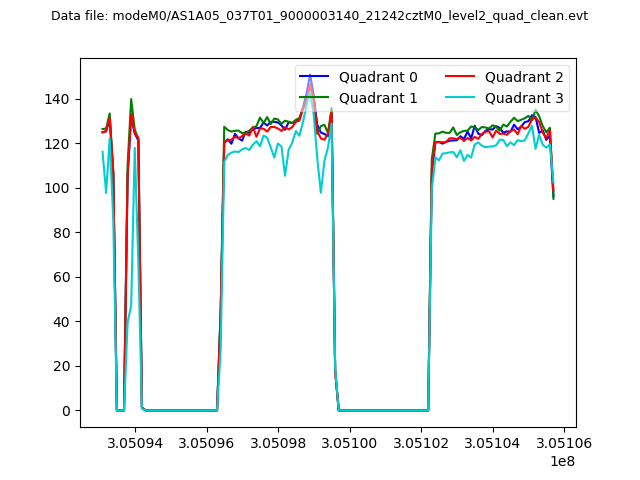 |
|
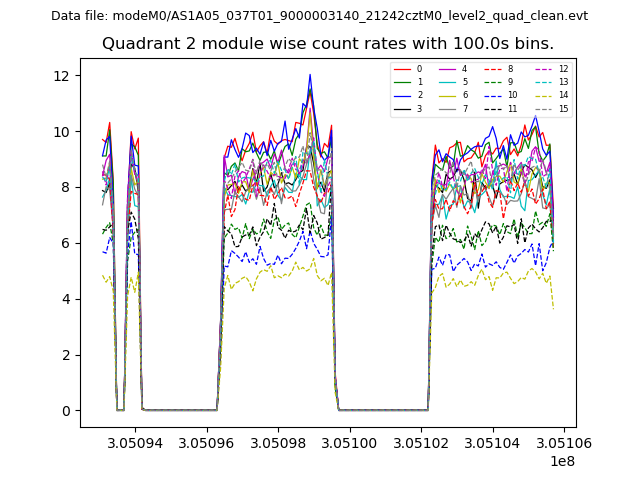
| Module-wise count rates for Quadrant A Data is divided into 100 sec bins |
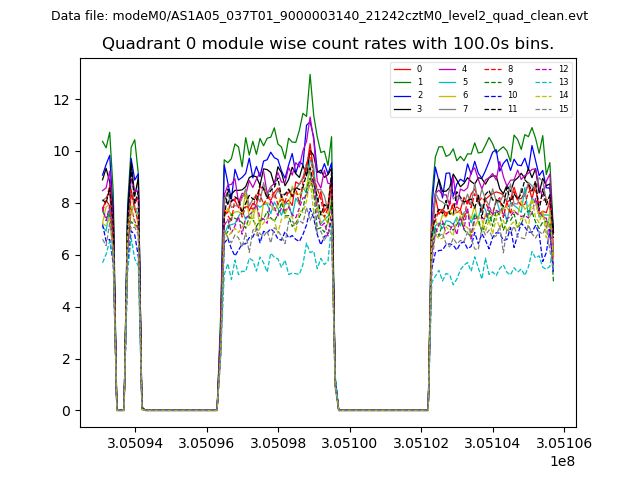 |
 |
| Module-wise count rates for Quadrant B Data is divided into 100 sec bins |
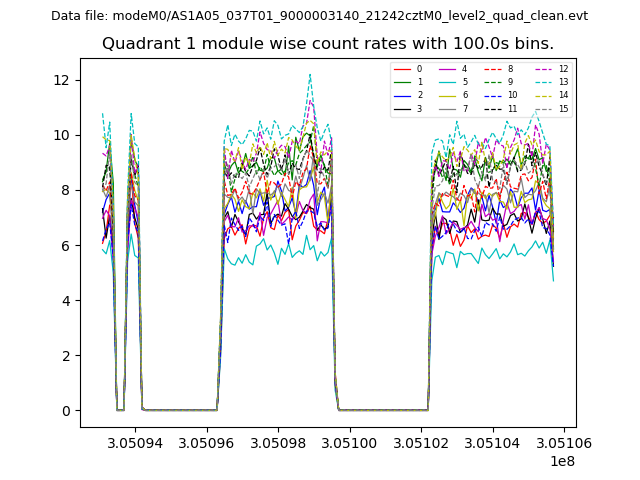 |
 |
| Module-wise count rates for Quadrant C Data is divided into 100 sec bins |
 |
 |
| Module-wise count rates for Quadrant D Data is divided into 100 sec bins |
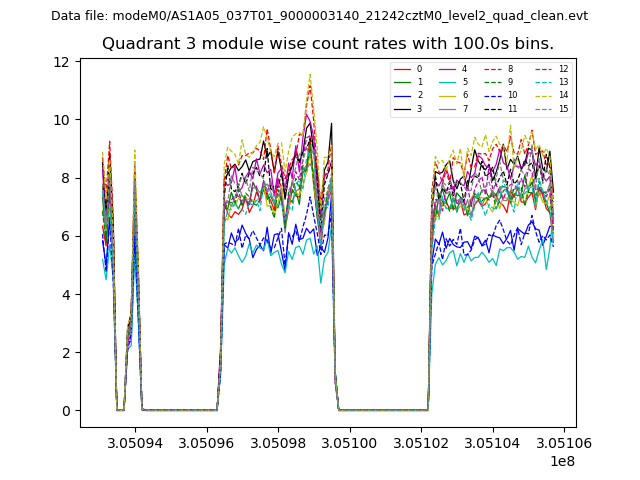 |
 |
| Parameter | Plot |
|---|---|
| CZT HV Monitor | 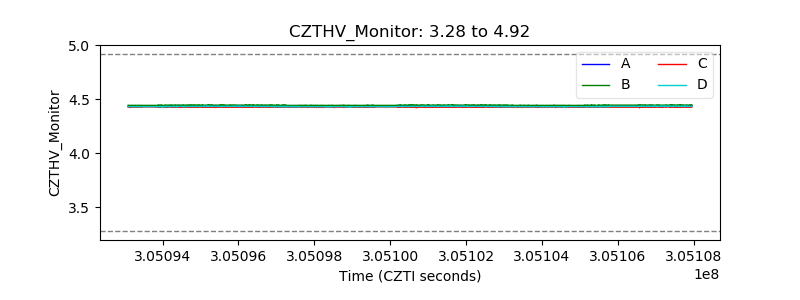 |
| D_VDD | 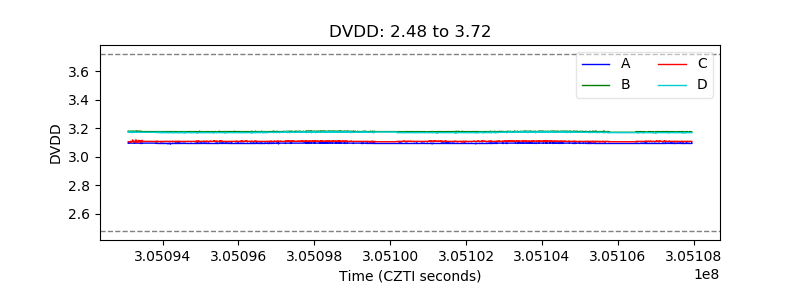 |
| Temperature 1 | 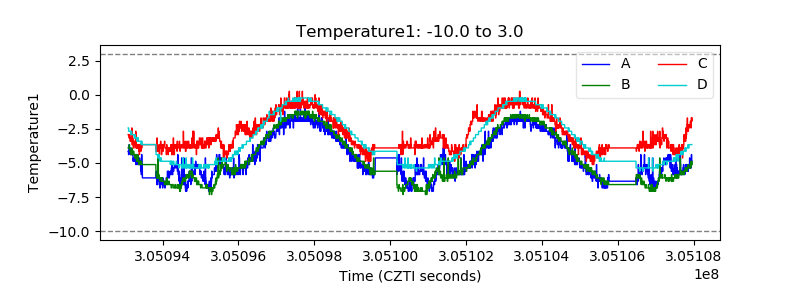 |
| Veto HV Monitor | 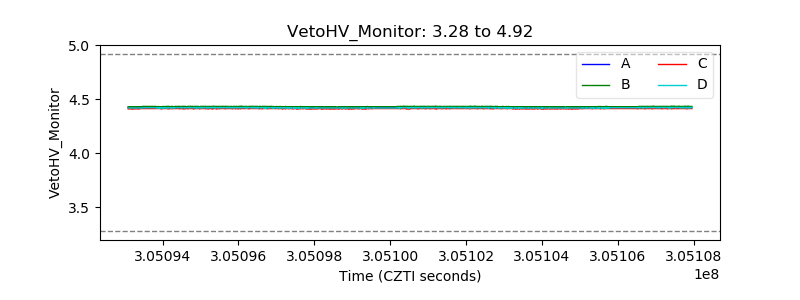 |
| Veto LLD | 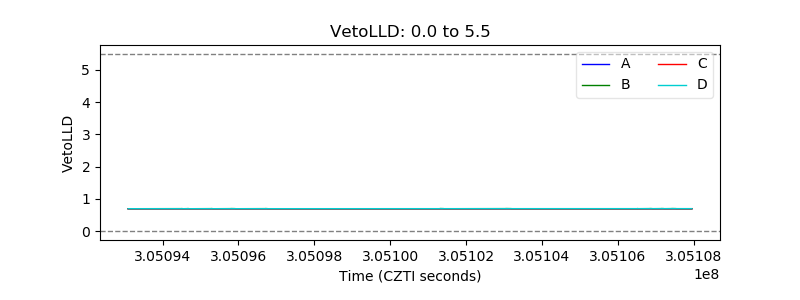 |
| Alpha Counter |  |
| _CPM_Rate | 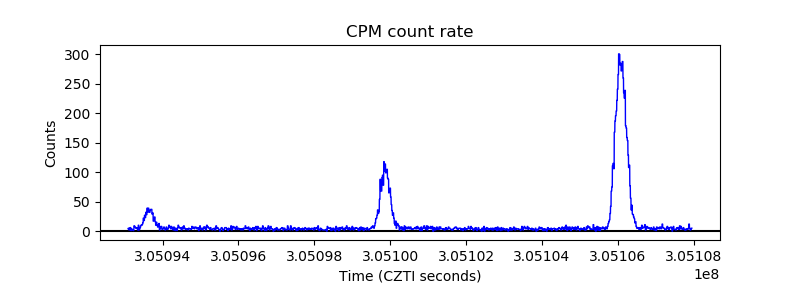 |
| CZT Counter | 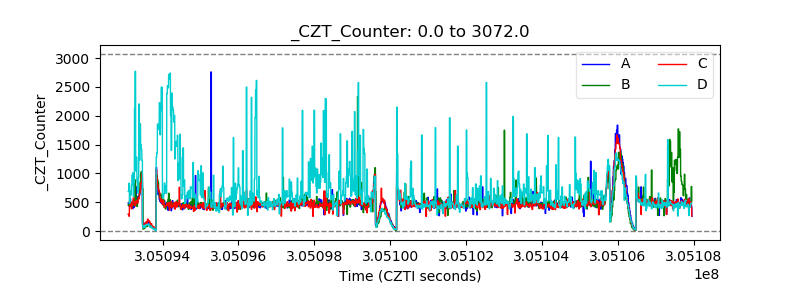 |
| +2.5 Volts monitor |  |
| +5 Volts monitor | 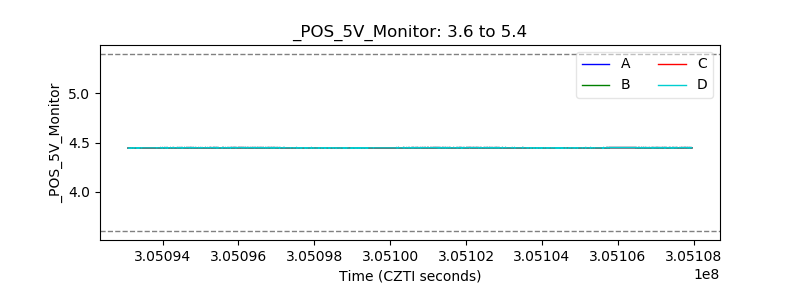 |
| _ROLL_ROT | 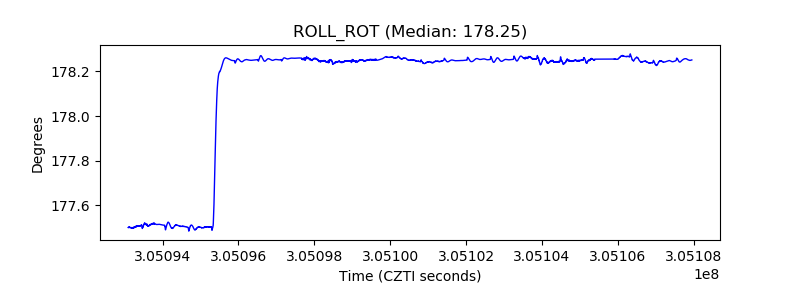 |
| _Roll_DEC | 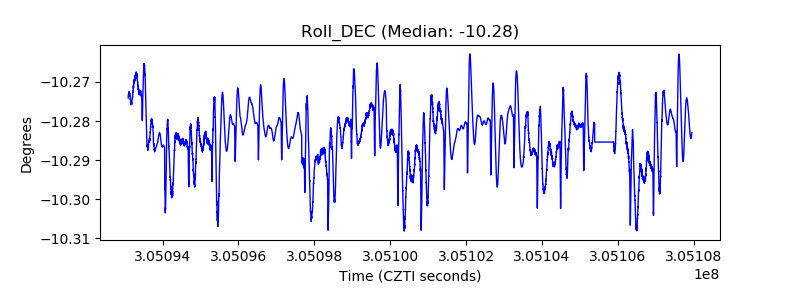 |
| _Roll_RA | 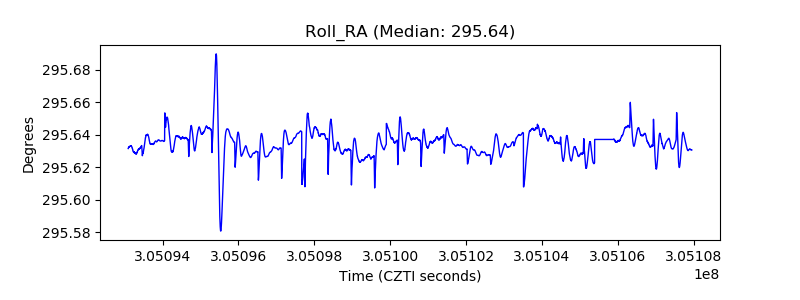 |
| Veto Counter | 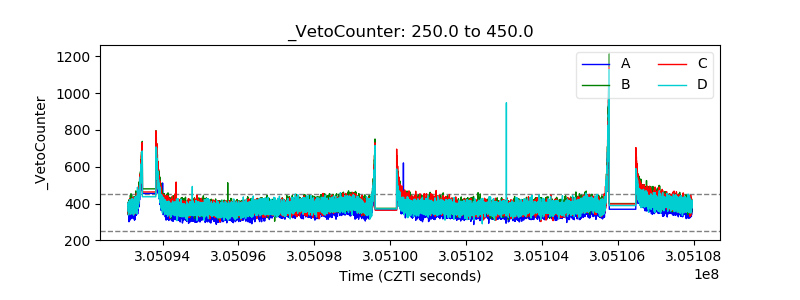 |