| Param | Original file | Final file |
|---|---|---|
| Filename | modeM0/AS1A05_037T01_9000003140_21243cztM0_level2.evt | modeM0/AS1A05_037T01_9000003140_21243cztM0_level2_quad_clean.evt |
| Size (bytes) | 682,476,480 | 86,889,600 |
| Size | 650.9 MB | 82.9 MB |
| Events in quadrant A | 3,853,218 | 556,516 |
| Events in quadrant B | 4,145,890 | 568,849 |
| Events in quadrant C | 3,678,952 | 554,478 |
| Events in quadrant D | 8,479,799 | 426,320 |
| Mode M9 | |||
|---|---|---|---|
| Quadrant | BADHDUFLAG | Total packets | Discarded packets |
| A | 0 | 15 | 0 |
| B | 0 | 15 | 0 |
| C | 0 | 15 | 0 |
| D | 0 | 15 | 0 |
| Mode M0 | |||
|---|---|---|---|
| Quadrant | BADHDUFLAG | Total packets | Discarded packets |
| A | 0 | 15936 | 2 |
| B | 0 | 16907 | 2 |
| C | 0 | 15554 | 2 |
| D | 0 | 30275 | 2 |
| Mode SS | |||
|---|---|---|---|
| Quadrant | BADHDUFLAG | Total packets | Discarded packets |
| A | 0 | 156 | 0 |
| B | 0 | 156 | 0 |
| C | 0 | 156 | 0 |
| D | 0 | 156 | 0 |
| Quadrant | Total seconds | Saturated seconds | Saturation percentage |
|---|---|---|---|
| A | 7534 | 133 | 1.765331% |
| B | 7535 | 170 | 2.256138% |
| C | 7535 | 175 | 2.322495% |
| D | 7535 | 2195 | 29.130723% |
Noise dominated data is calculated using 1-second bins in cleaned event files. If a bin has >2000 counts, and if more than 50% of those come from <1% of pixels, then it is considered to be noise-dominated and hence unusable.
| Quadrant | # 1 sec bins | Bins with >0 counts | Bins with >2000 counts | High rate bins dominated by noise | Noise dominated (total time) | Noise dominated (detector-on time) | Marked lightcurve |
|---|---|---|---|---|---|---|---|
| A | 9099 | 7534 | 6 | 6 | 0.07% | 0.08% | 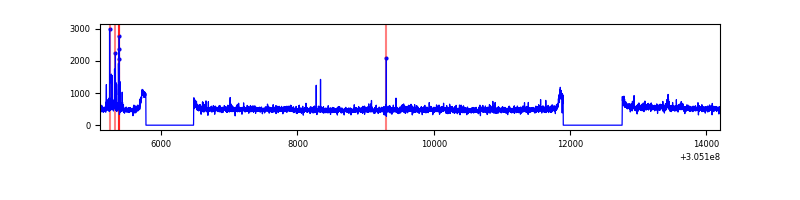 |
| B | 9100 | 7535 | 13 | 13 | 0.14% | 0.17% | 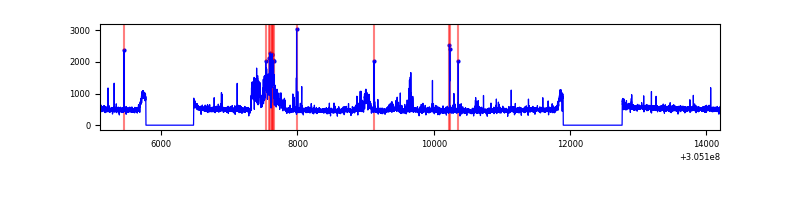 |
| C | 9100 | 7535 | 1 | 1 | 0.01% | 0.01% | 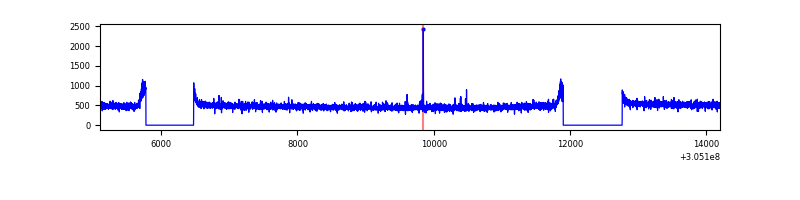 |
| D | 9099 | 7534 | 1949 | 1949 | 21.42% | 25.87% | 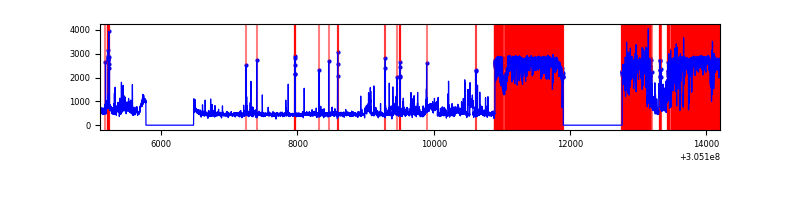 |
Top three noisy pixels from each quadrant. If the there are fewer than three noisy pixels in the level2.evt file, extra rows are filled as -1
| Pixel properties | Quadrant properties | ||||||
|---|---|---|---|---|---|---|---|
| Quadrant | DetID | PixID | Counts | Sigma | Mean | Median | Sigma |
| A | 15 | 236 | 112678 | 584.09 | 939 | 916 | 191.3 |
| A | 5 | 16 | 68135 | 351.3 | 939 | 916 | 191.3 |
| A | 12 | 96 | 28032 | 141.71 | 939 | 916 | 191.3 |
| B | 3 | 64 | 298696 | 1638.69 | 939 | 913 | 181.7 |
| B | 0 | 197 | 64228 | 348.42 | 939 | 913 | 181.7 |
| B | 4 | 216 | 24411 | 129.31 | 939 | 913 | 181.7 |
| C | 14 | 238 | 138505 | 646.81 | 902 | 907 | 212.7 |
| C | 0 | 207 | 12890 | 56.33 | 902 | 907 | 212.7 |
| C | 3 | 233 | 9131 | 38.66 | 902 | 907 | 212.7 |
| D | 1 | 239 | 5163420 | 28883.37 | 731 | 712 | 178.7 |
| D | 1 | 52 | 173322 | 965.69 | 731 | 712 | 178.7 |
| D | 10 | 199 | 107001 | 594.65 | 731 | 712 | 178.7 |
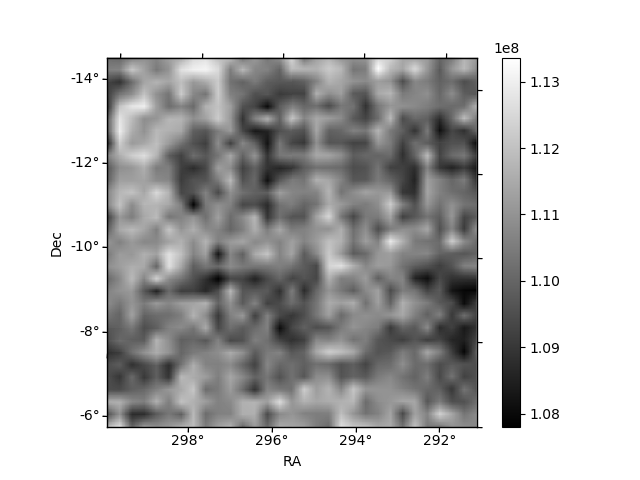
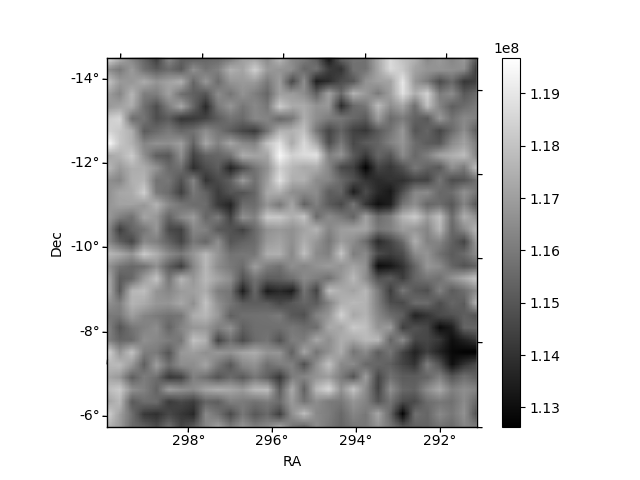
Histogram calculated using DETX and DETY for each event in the final _common_clean file
| Quadrant A |  |
 |
Quadrant B |
|---|---|---|---|
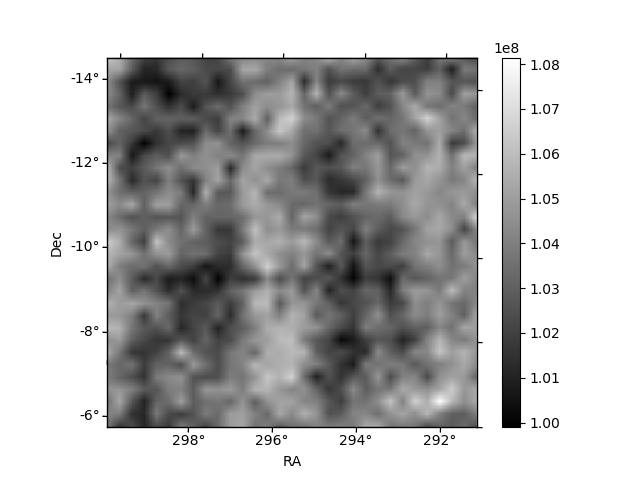
| Quadrant D |  |
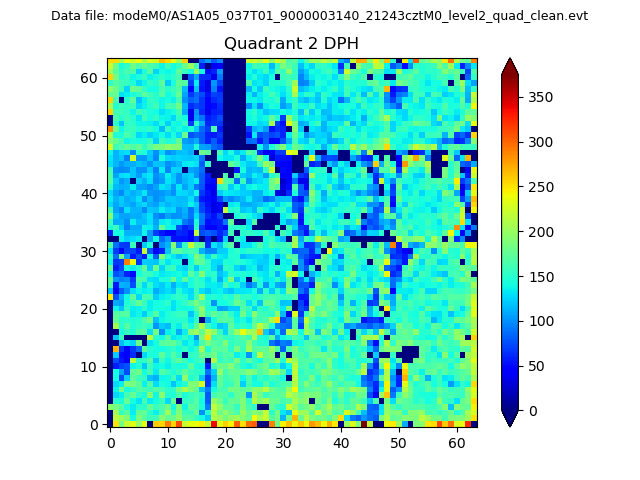 |
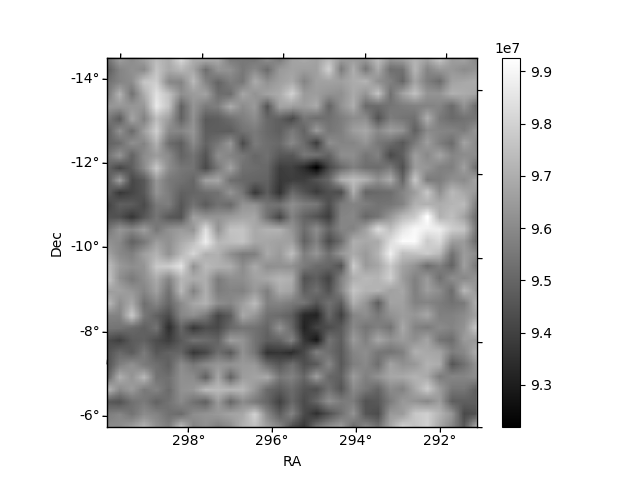
Quadrant C |
| Plot type | Count rate plots | Images |
|---|---|---|
| Comparison with Poisson distribution Blue bars denote a histogram of data divided into 1 sec bins. Red curve is a Poisson curve with rate = median count rate of data. |
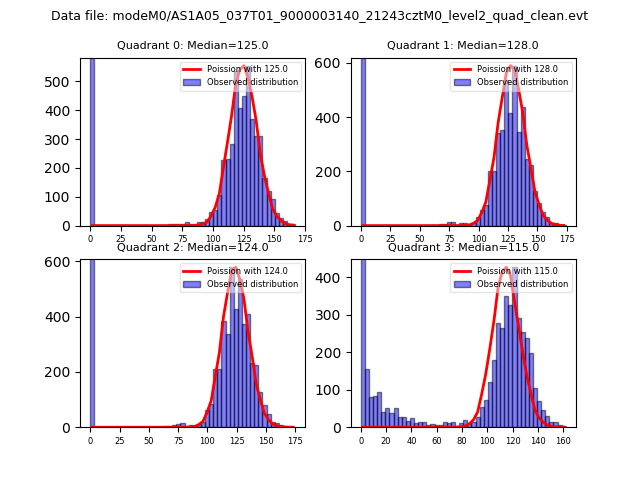 |
 |
| Quadrant-wise count rates Data is divided into 100 sec bins |
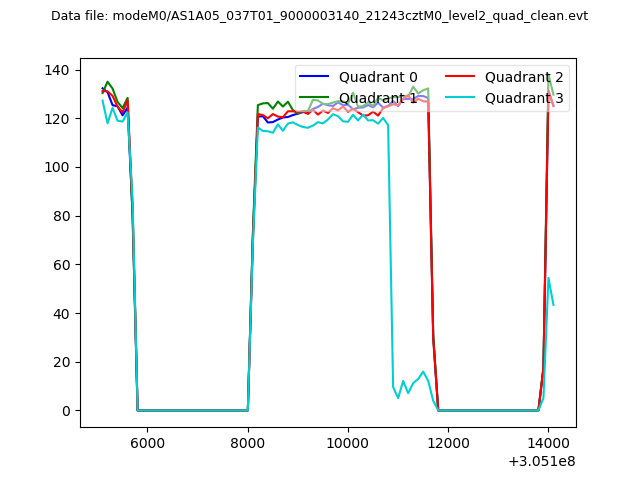 |
|
| Module-wise count rates for Quadrant A Data is divided into 100 sec bins |
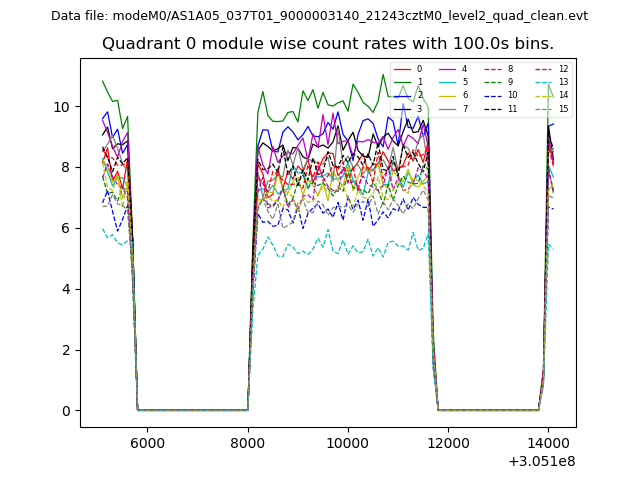 |
 |
| Module-wise count rates for Quadrant B Data is divided into 100 sec bins |
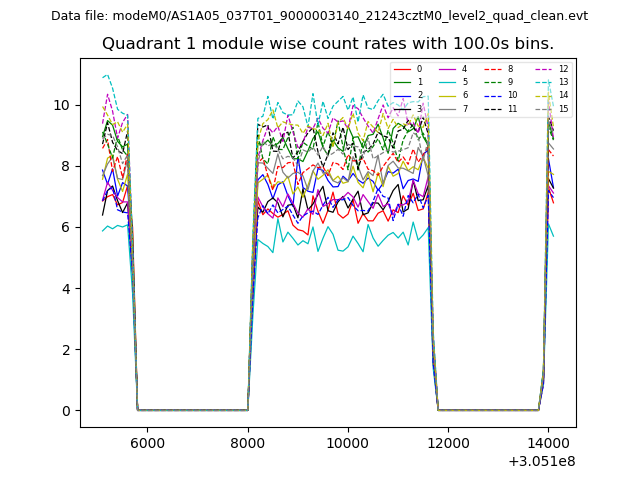 |
 |
| Module-wise count rates for Quadrant C Data is divided into 100 sec bins |
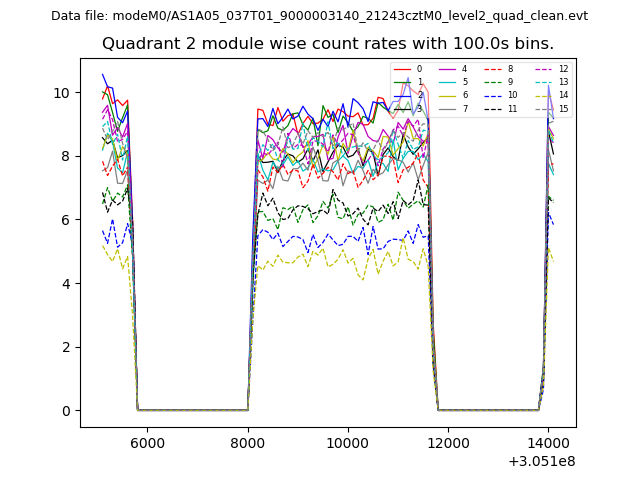 |
 |
| Module-wise count rates for Quadrant D Data is divided into 100 sec bins |
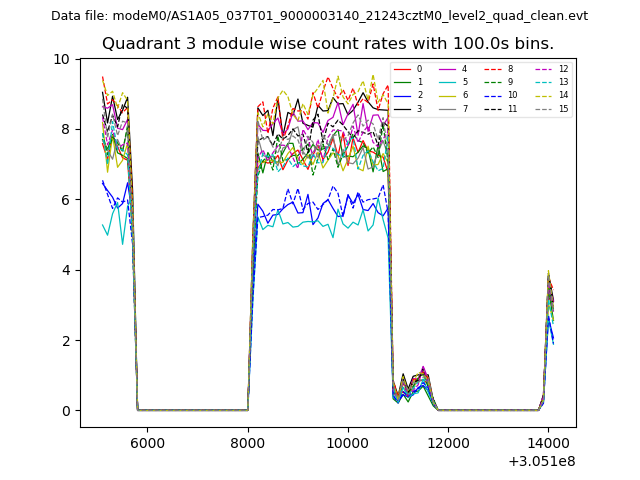 |
 |
| Parameter | Plot |
|---|---|
| CZT HV Monitor | 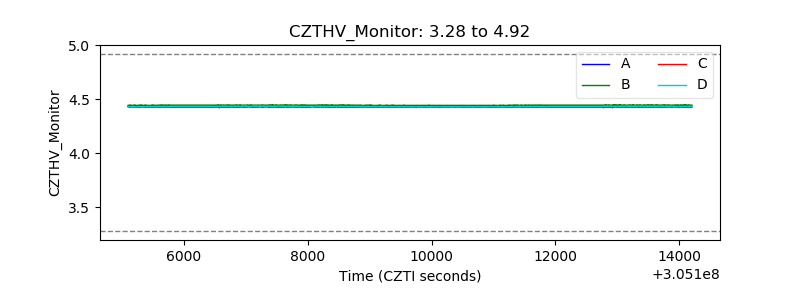 |
| D_VDD |  |
| Temperature 1 | 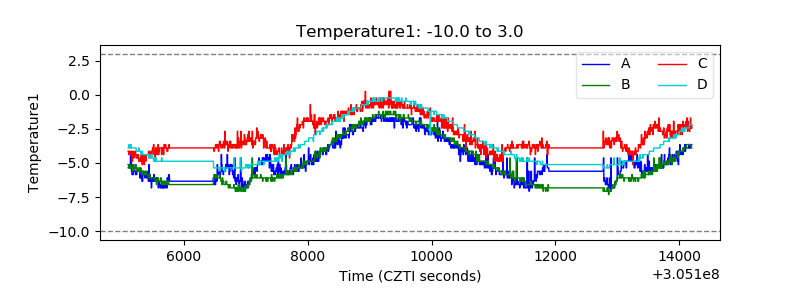 |
| Veto HV Monitor | 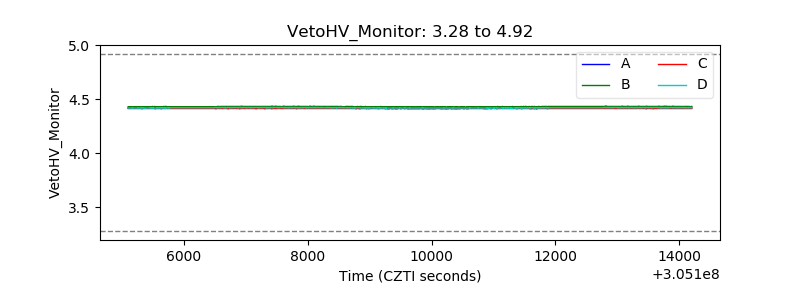 |
| Veto LLD | 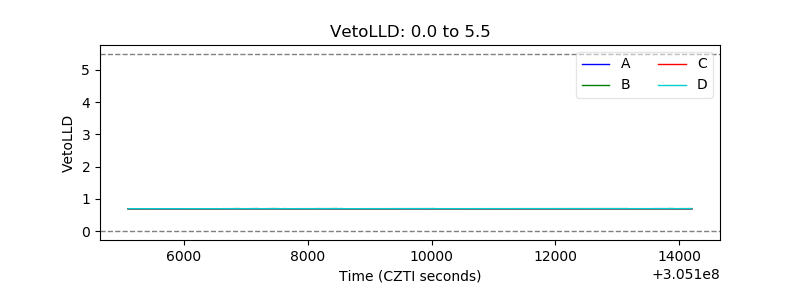 |
| Alpha Counter | 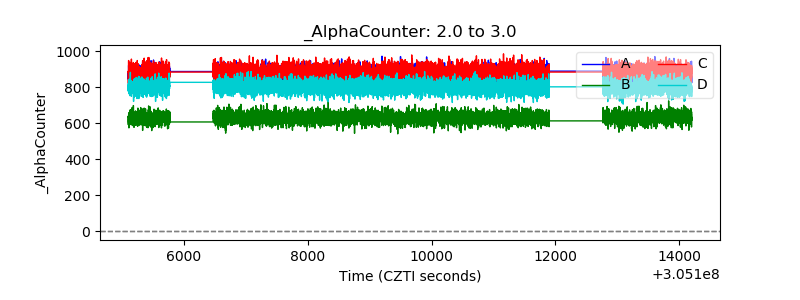 |
| _CPM_Rate | 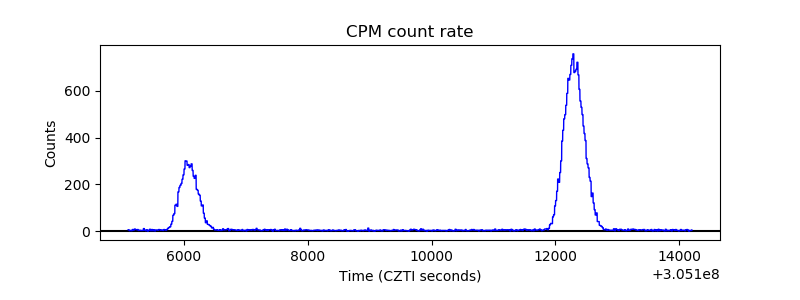 |
| CZT Counter | 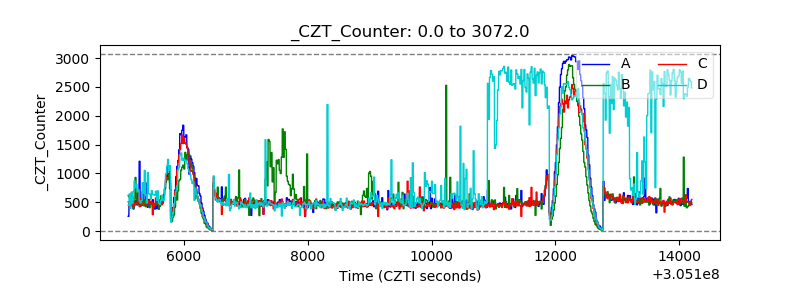 |
| +2.5 Volts monitor |  |
| +5 Volts monitor | 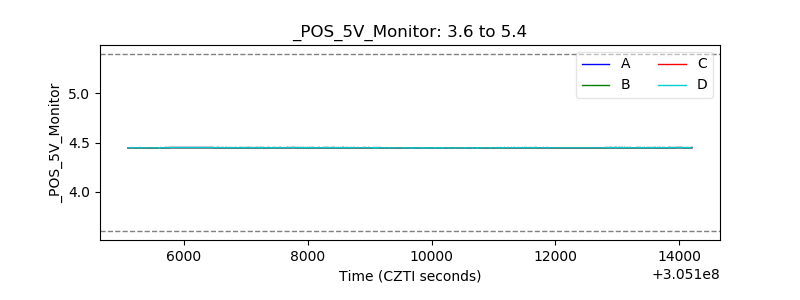 |
| _ROLL_ROT | 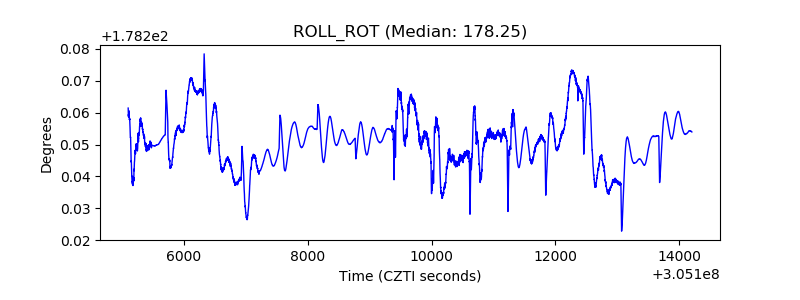 |
| _Roll_DEC | 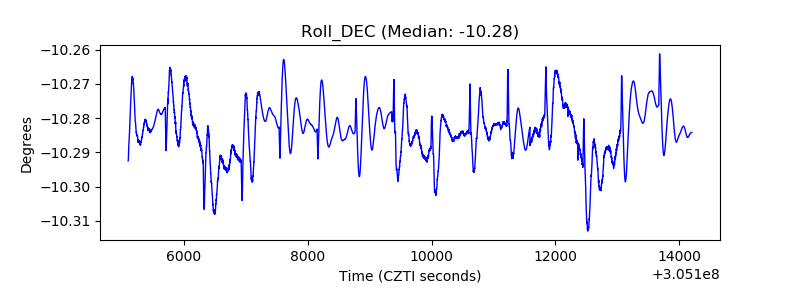 |
| _Roll_RA | 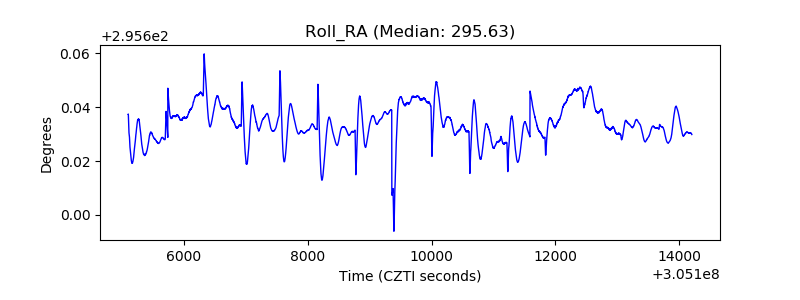 |
| Veto Counter | 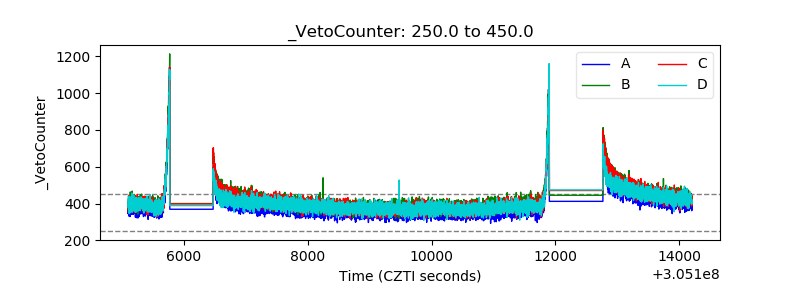 |