| Param | Original file | Final file |
|---|---|---|
| Filename | modeM0/AS1A05_037T01_9000003140_21244cztM0_level2.evt | modeM0/AS1A05_037T01_9000003140_21244cztM0_level2_quad_clean.evt |
| Size (bytes) | 1,232,763,840 | 148,636,800 |
| Size | 1.1 GB | 141.8 MB |
| Events in quadrant A | 6,053,074 | 1,007,073 |
| Events in quadrant B | 6,374,572 | 1,029,229 |
| Events in quadrant C | 5,798,969 | 999,121 |
| Events in quadrant D | 18,297,436 | 634,723 |
| Mode M9 | |||
|---|---|---|---|
| Quadrant | BADHDUFLAG | Total packets | Discarded packets |
| A | 0 | 18 | 0 |
| B | 0 | 18 | 0 |
| C | 0 | 18 | 0 |
| D | 0 | 18 | 0 |
| Mode M0 | |||
|---|---|---|---|
| Quadrant | BADHDUFLAG | Total packets | Discarded packets |
| A | 0 | 25376 | 2 |
| B | 0 | 26346 | 3 |
| C | 0 | 24791 | 2 |
| D | 0 | 62508 | 8 |
| Mode SS | |||
|---|---|---|---|
| Quadrant | BADHDUFLAG | Total packets | Discarded packets |
| A | 0 | 248 | 0 |
| B | 0 | 246 | 0 |
| C | 0 | 246 | 0 |
| D | 0 | 246 | 0 |
| Quadrant | Total seconds | Saturated seconds | Saturation percentage |
|---|---|---|---|
| A | 11992 | 137 | 1.142428% |
| B | 11991 | 170 | 1.417730% |
| C | 11992 | 186 | 1.551034% |
| D | 11991 | 5376 | 44.833625% |
Noise dominated data is calculated using 1-second bins in cleaned event files. If a bin has >2000 counts, and if more than 50% of those come from <1% of pixels, then it is considered to be noise-dominated and hence unusable.
| Quadrant | # 1 sec bins | Bins with >0 counts | Bins with >2000 counts | High rate bins dominated by noise | Noise dominated (total time) | Noise dominated (detector-on time) | Marked lightcurve |
|---|---|---|---|---|---|---|---|
| A | 13902 | 11992 | 1 | 1 | 0.01% | 0.01% | 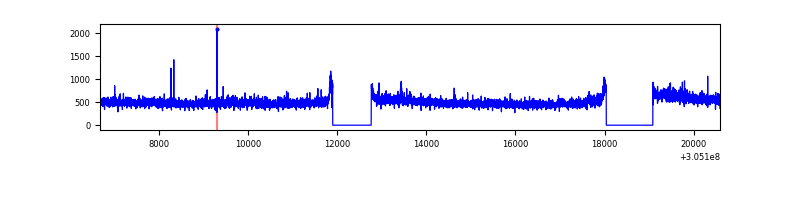 |
| B | 13901 | 11991 | 13 | 13 | 0.09% | 0.11% | 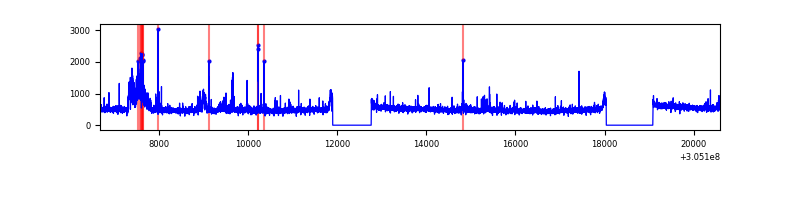 |
| C | 13902 | 11992 | 1 | 1 | 0.01% | 0.01% | 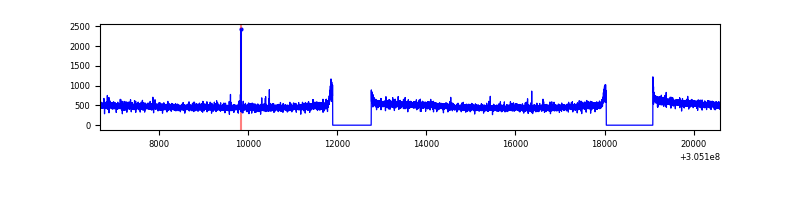 |
| D | 13902 | 11992 | 4955 | 4955 | 35.64% | 41.32% | 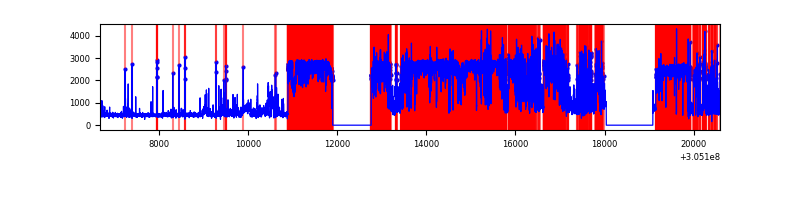 |
Top three noisy pixels from each quadrant. If the there are fewer than three noisy pixels in the level2.evt file, extra rows are filled as -1
| Pixel properties | Quadrant properties | ||||||
|---|---|---|---|---|---|---|---|
| Quadrant | DetID | PixID | Counts | Sigma | Mean | Median | Sigma |
| A | 15 | 236 | 221301 | 735.11 | 1492 | 1461 | 299.1 |
| A | 5 | 168 | 43895 | 141.89 | 1492 | 1461 | 299.1 |
| A | 12 | 96 | 28867 | 91.64 | 1492 | 1461 | 299.1 |
| B | 3 | 64 | 304802 | 1078.05 | 1483 | 1448 | 281.4 |
| B | 0 | 197 | 99587 | 348.76 | 1483 | 1448 | 281.4 |
| B | 0 | 190 | 40847 | 140.02 | 1483 | 1448 | 281.4 |
| C | 14 | 238 | 223140 | 670.85 | 1424 | 1435 | 330.5 |
| C | 0 | 207 | 14621 | 39.9 | 1424 | 1435 | 330.5 |
| C | 13 | 61 | 9876 | 25.54 | 1424 | 1435 | 330.5 |
| D | 1 | 239 | 11484829 | 47378.68 | 999 | 971 | 242.4 |
| D | 7 | 238 | 2076572 | 8563.26 | 999 | 971 | 242.4 |
| D | 14 | 34 | 387259 | 1593.7 | 999 | 971 | 242.4 |
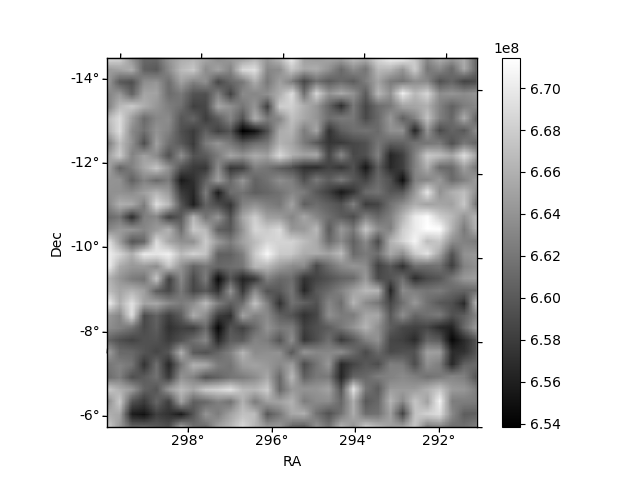
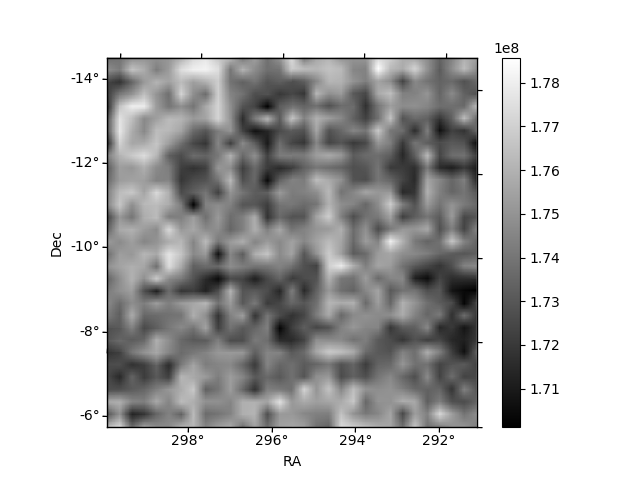
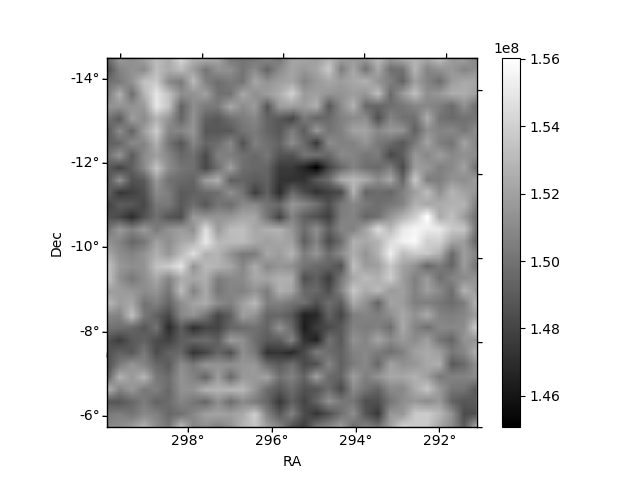
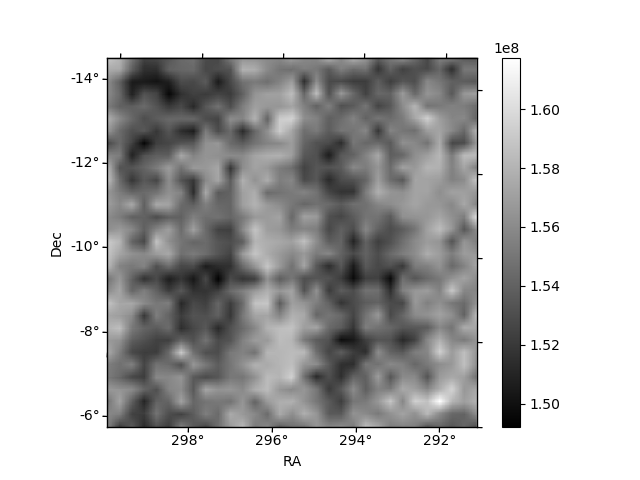
Histogram calculated using DETX and DETY for each event in the final _common_clean file
| Quadrant A |  |
 |
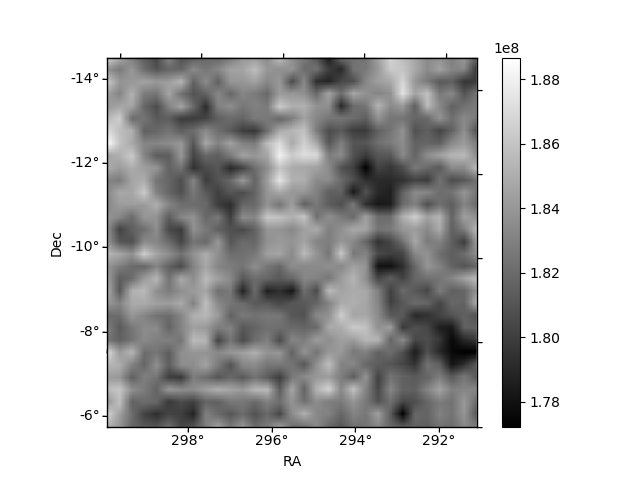
Quadrant B |
|---|---|---|---|
| Quadrant D |  |
 |
Quadrant C |
| Plot type | Count rate plots | Images |
|---|---|---|
| Comparison with Poisson distribution Blue bars denote a histogram of data divided into 1 sec bins. Red curve is a Poisson curve with rate = median count rate of data. |
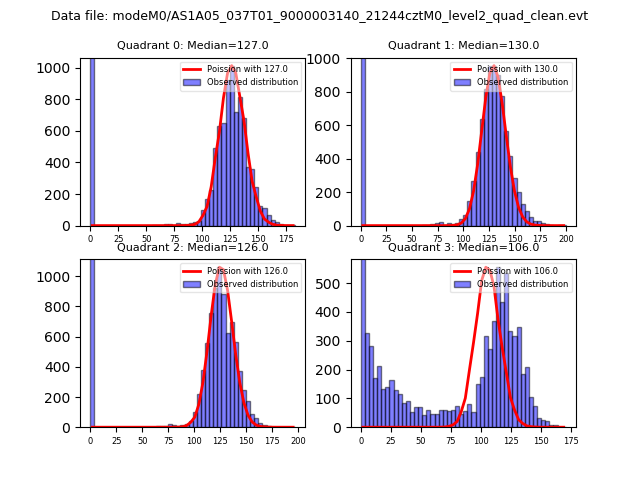 |
 |
| Quadrant-wise count rates Data is divided into 100 sec bins |
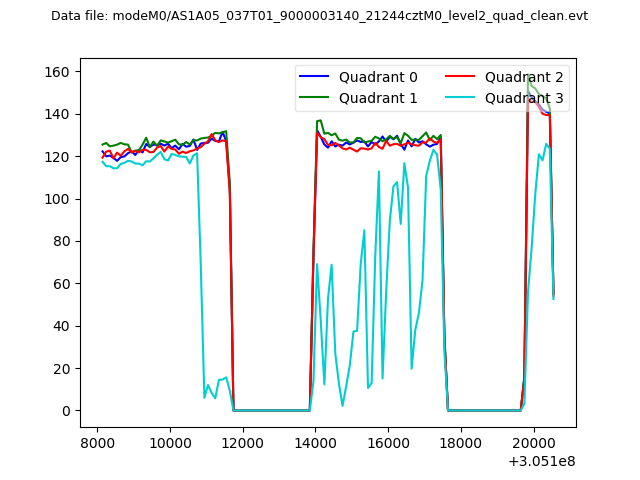 |
|
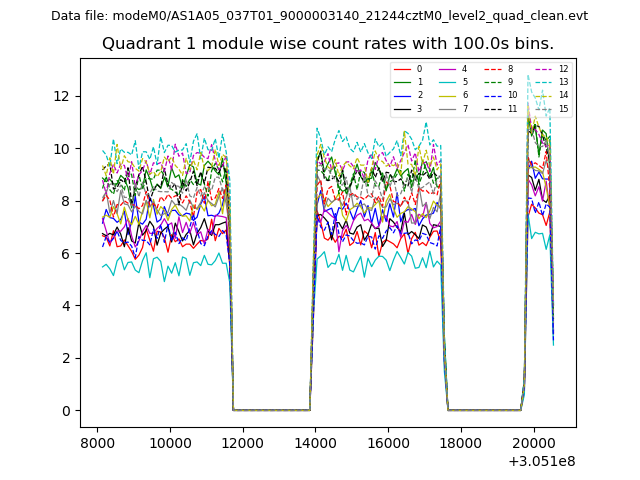
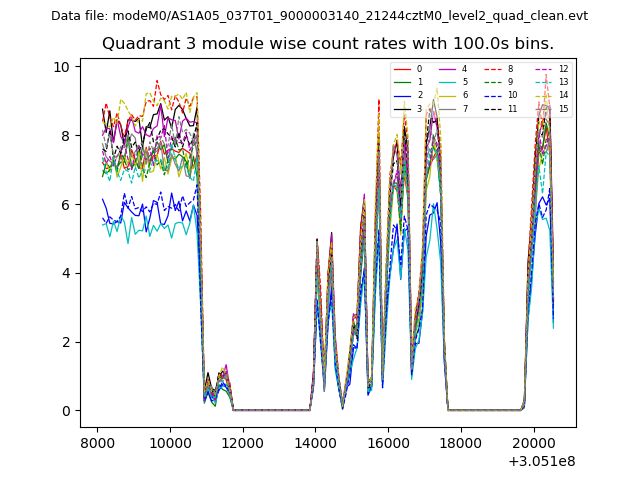
| Module-wise count rates for Quadrant A Data is divided into 100 sec bins |
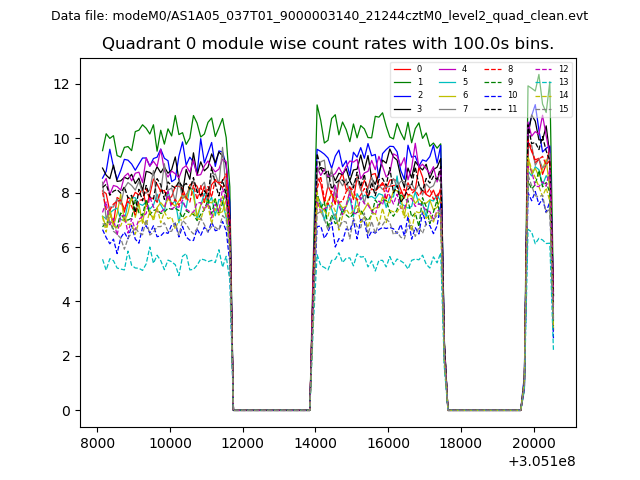 |
 |
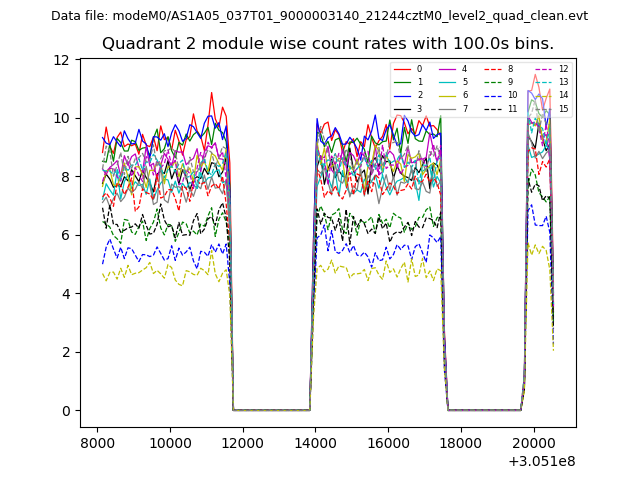
| Module-wise count rates for Quadrant B Data is divided into 100 sec bins |
 |
 |
| Module-wise count rates for Quadrant C Data is divided into 100 sec bins |
 |
 |
| Module-wise count rates for Quadrant D Data is divided into 100 sec bins |
 |
 |
| Parameter | Plot |
|---|---|
| CZT HV Monitor | 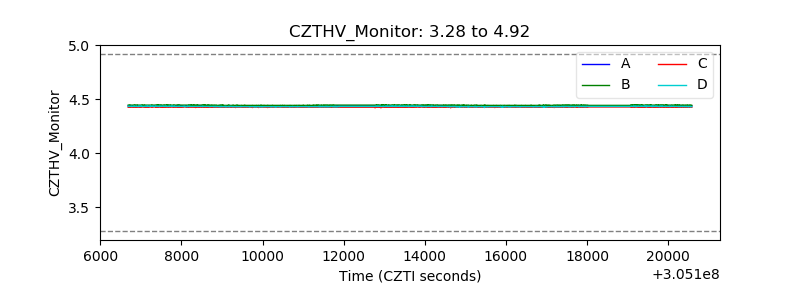 |
| D_VDD | 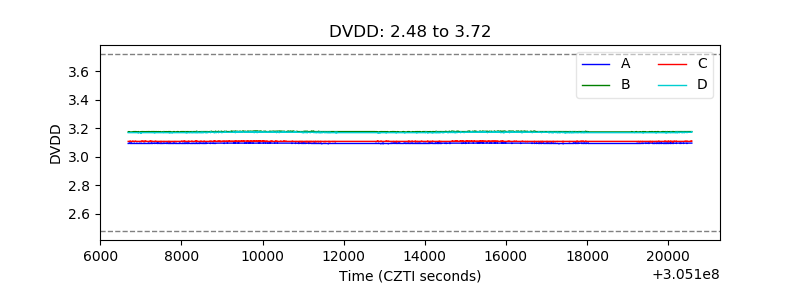 |
| Temperature 1 | 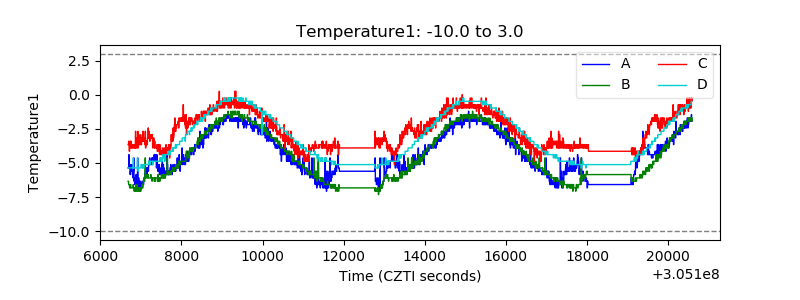 |
| Veto HV Monitor | 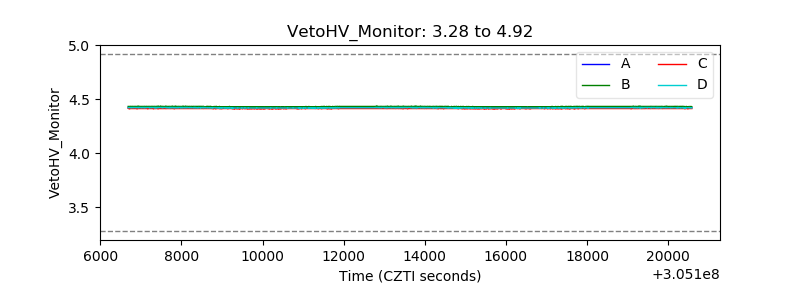 |
| Veto LLD |  |
| Alpha Counter | 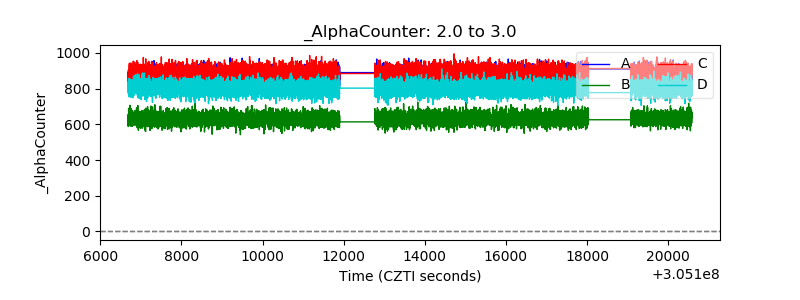 |
| _CPM_Rate | 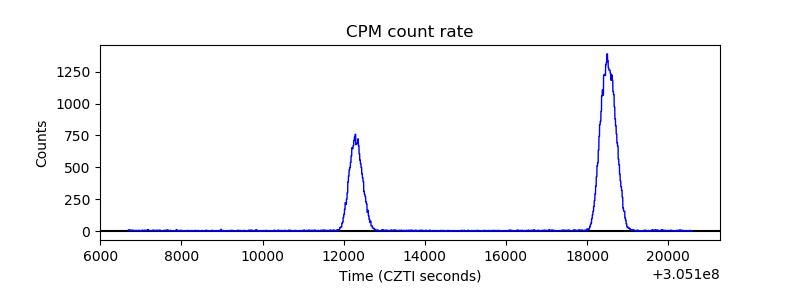 |
| CZT Counter | 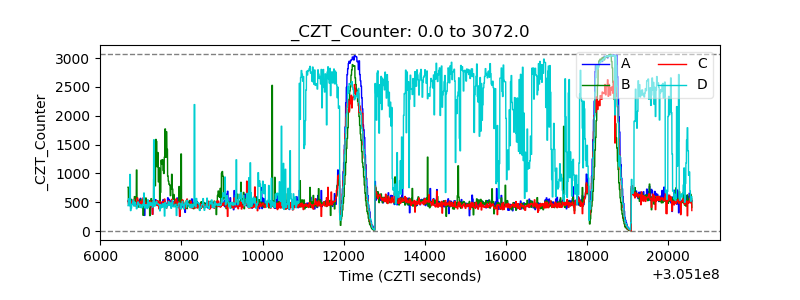 |
| +2.5 Volts monitor |  |
| +5 Volts monitor | 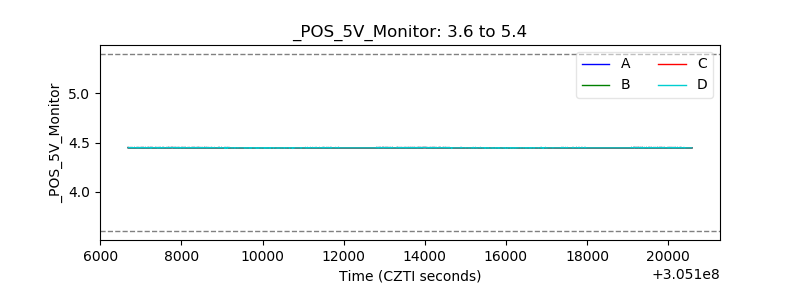 |
| _ROLL_ROT | 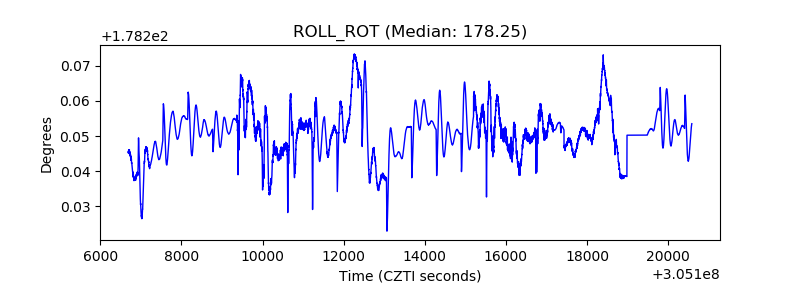 |
| _Roll_DEC | 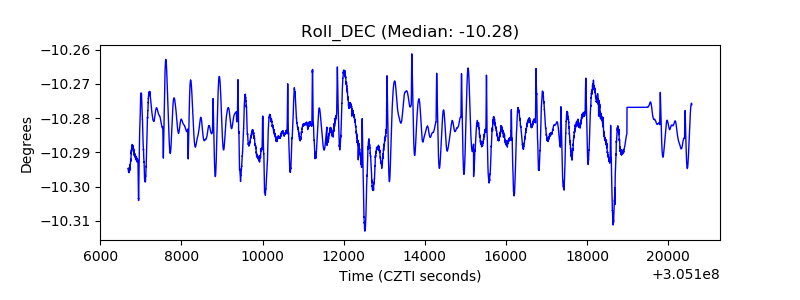 |
| _Roll_RA | 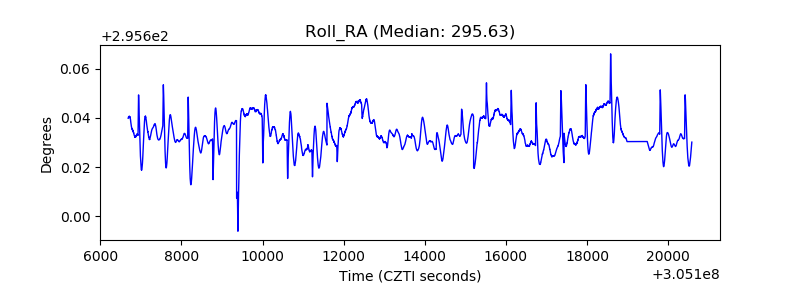 |
| Veto Counter | 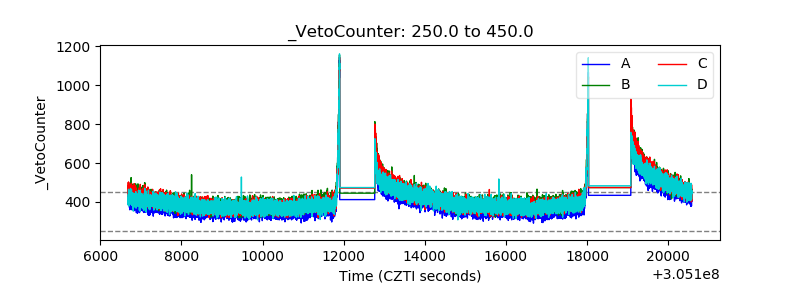 |