| Param | Original file | Final file |
|---|---|---|
| Filename | modeM0/AS1A05_037T01_9000003140_21246cztM0_level2.evt | modeM0/AS1A05_037T01_9000003140_21246cztM0_level2_quad_clean.evt |
| Size (bytes) | 588,582,720 | 94,659,840 |
| Size | 561.3 MB | 90.3 MB |
| Events in quadrant A | 3,098,480 | 649,542 |
| Events in quadrant B | 3,183,844 | 657,507 |
| Events in quadrant C | 2,987,518 | 631,819 |
| Events in quadrant D | 8,158,216 | 517,512 |
| Mode M9 | |||
|---|---|---|---|
| Quadrant | BADHDUFLAG | Total packets | Discarded packets |
| A | 0 | 12 | 0 |
| B | 0 | 12 | 0 |
| C | 0 | 12 | 0 |
| D | 0 | 12 | 0 |
| Mode M0 | |||
|---|---|---|---|
| Quadrant | BADHDUFLAG | Total packets | Discarded packets |
| A | 0 | 12976 | 1 |
| B | 0 | 13204 | 1 |
| C | 0 | 12622 | 1 |
| D | 0 | 28329 | 1 |
| Mode SS | |||
|---|---|---|---|
| Quadrant | BADHDUFLAG | Total packets | Discarded packets |
| A | 0 | 118 | 0 |
| B | 0 | 118 | 0 |
| C | 0 | 118 | 0 |
| D | 0 | 118 | 0 |
| Quadrant | Total seconds | Saturated seconds | Saturation percentage |
|---|---|---|---|
| A | 5868 | 56 | 0.954329% |
| B | 5869 | 87 | 1.482365% |
| C | 5869 | 77 | 1.311978% |
| D | 5869 | 1760 | 29.988073% |
Noise dominated data is calculated using 1-second bins in cleaned event files. If a bin has >2000 counts, and if more than 50% of those come from <1% of pixels, then it is considered to be noise-dominated and hence unusable.
| Quadrant | # 1 sec bins | Bins with >0 counts | Bins with >2000 counts | High rate bins dominated by noise | Noise dominated (total time) | Noise dominated (detector-on time) | Marked lightcurve |
|---|---|---|---|---|---|---|---|
| A | 7043 | 5868 | 0 | 0 | 0.00% | 0.00% | 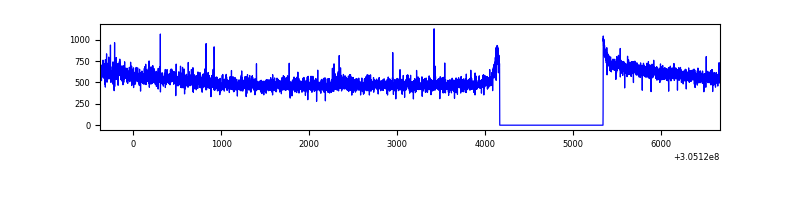 |
| B | 7044 | 5869 | 17 | 17 | 0.24% | 0.29% | 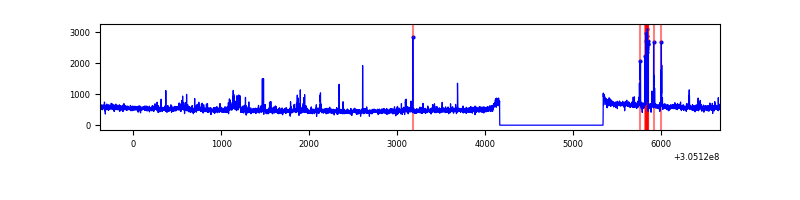 |
| C | 7044 | 5869 | 0 | 0 | 0.00% | 0.00% | 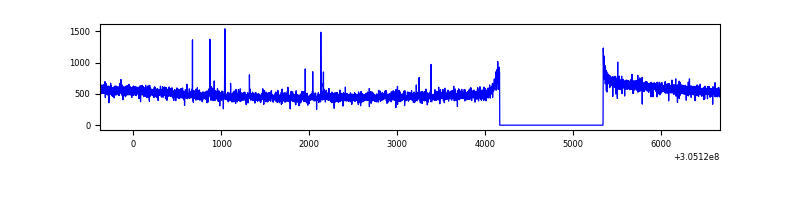 |
| D | 7044 | 5869 | 1683 | 1683 | 23.89% | 28.68% | 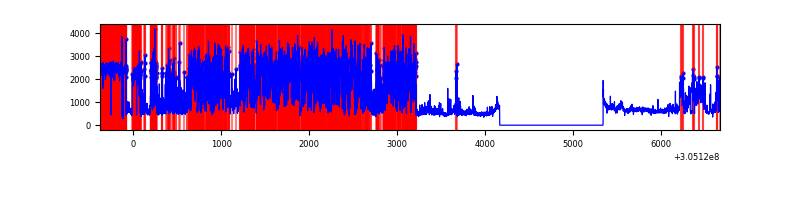 |
Top three noisy pixels from each quadrant. If the there are fewer than three noisy pixels in the level2.evt file, extra rows are filled as -1
| Pixel properties | Quadrant properties | ||||||
|---|---|---|---|---|---|---|---|
| Quadrant | DetID | PixID | Counts | Sigma | Mean | Median | Sigma |
| A | 15 | 236 | 98458 | 623.91 | 773 | 758 | 156.6 |
| A | 5 | 168 | 13869 | 83.73 | 773 | 758 | 156.6 |
| A | 13 | 254 | 9450 | 55.51 | 773 | 758 | 156.6 |
| B | 3 | 64 | 85987 | 597.51 | 759 | 742 | 142.7 |
| B | 0 | 197 | 39703 | 273.09 | 759 | 742 | 142.7 |
| B | 0 | 245 | 36104 | 247.86 | 759 | 742 | 142.7 |
| C | 14 | 238 | 115668 | 678.92 | 729 | 736 | 169.3 |
| C | 0 | 207 | 13762 | 76.95 | 729 | 736 | 169.3 |
| C | 3 | 233 | 13003 | 72.46 | 729 | 736 | 169.3 |
| D | 14 | 34 | 3885778 | 24573.04 | 653 | 636 | 158.1 |
| D | 7 | 238 | 928377 | 5867.85 | 653 | 636 | 158.1 |
| D | 1 | 239 | 370920 | 2342.0 | 653 | 636 | 158.1 |
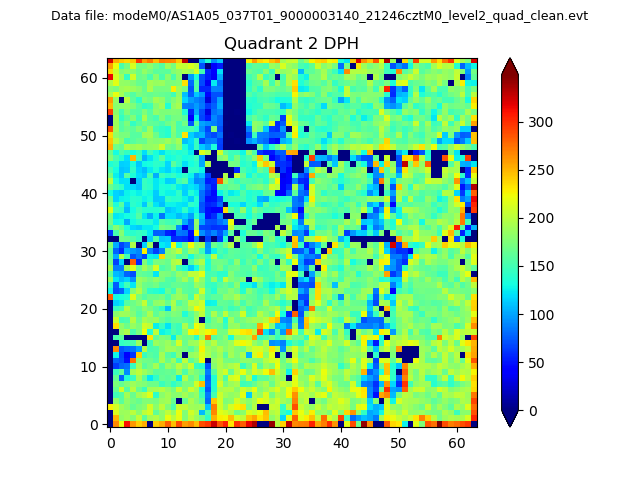
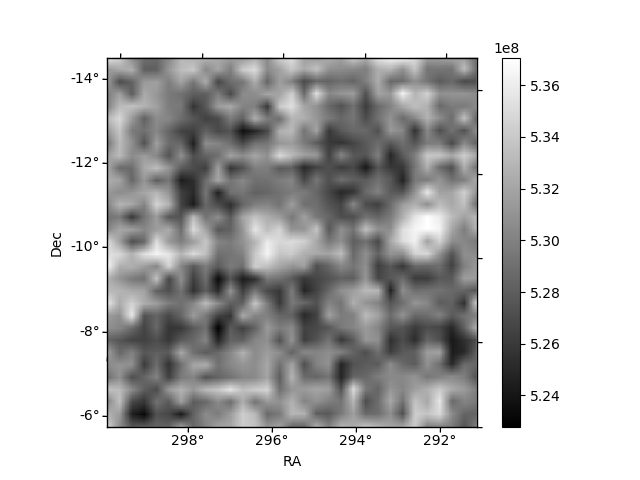
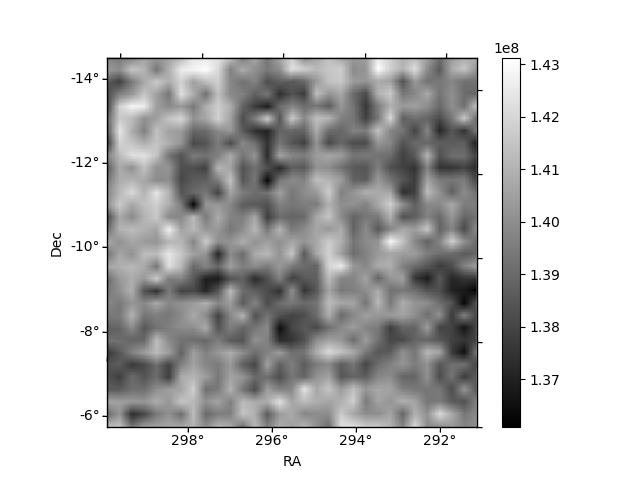
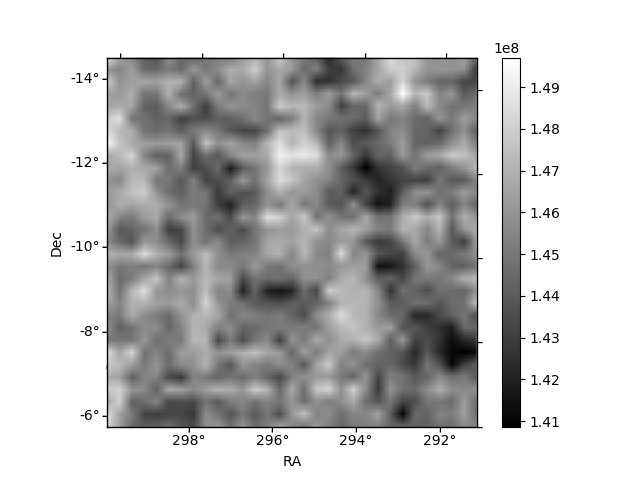
Histogram calculated using DETX and DETY for each event in the final _common_clean file
| Quadrant A | 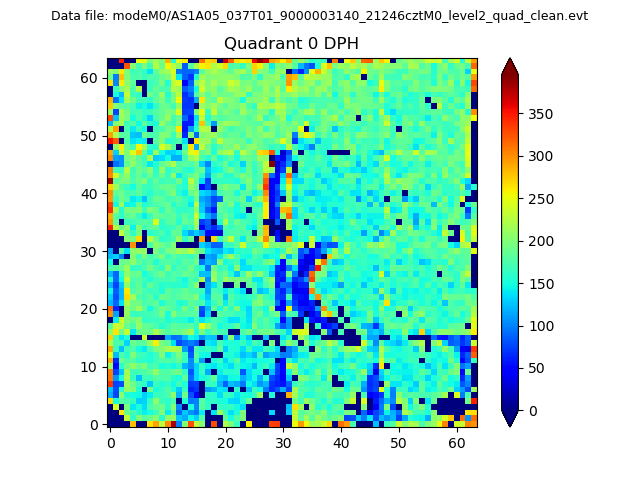 |
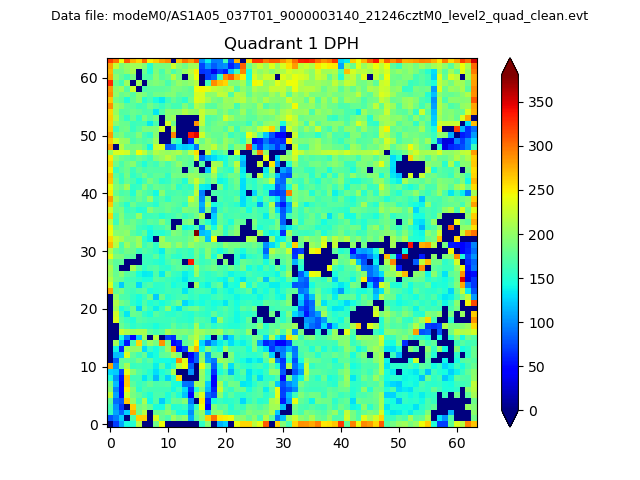 |
Quadrant B |
|---|---|---|---|
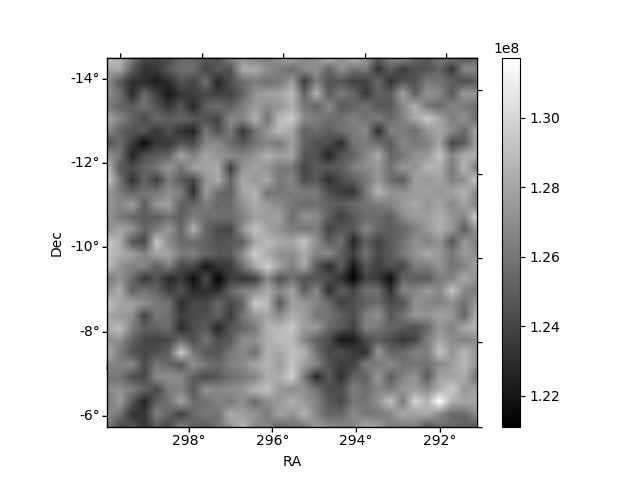
| Quadrant D | 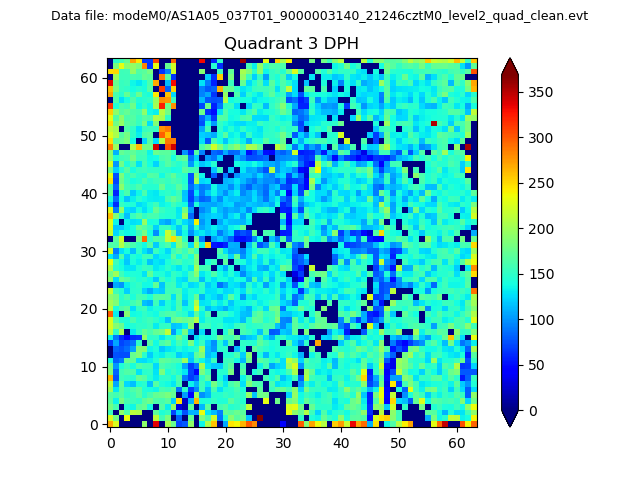 |
 |
Quadrant C |
| Plot type | Count rate plots | Images |
|---|---|---|
| Comparison with Poisson distribution Blue bars denote a histogram of data divided into 1 sec bins. Red curve is a Poisson curve with rate = median count rate of data. |
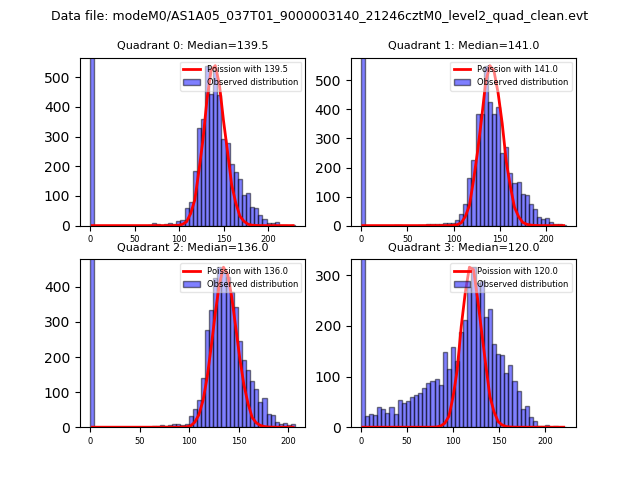 |
 |
| Quadrant-wise count rates Data is divided into 100 sec bins |
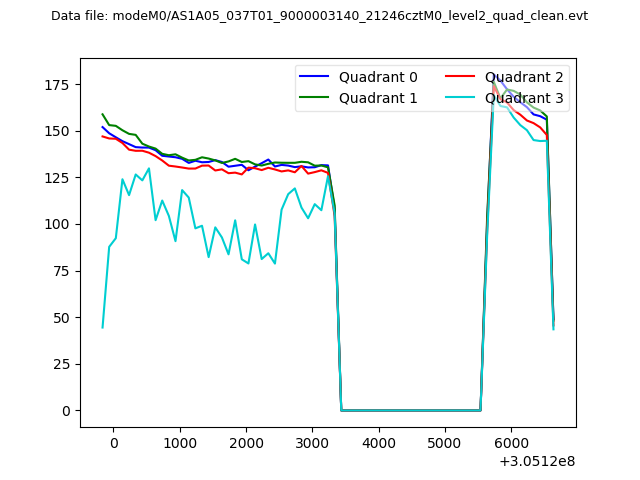 |
|
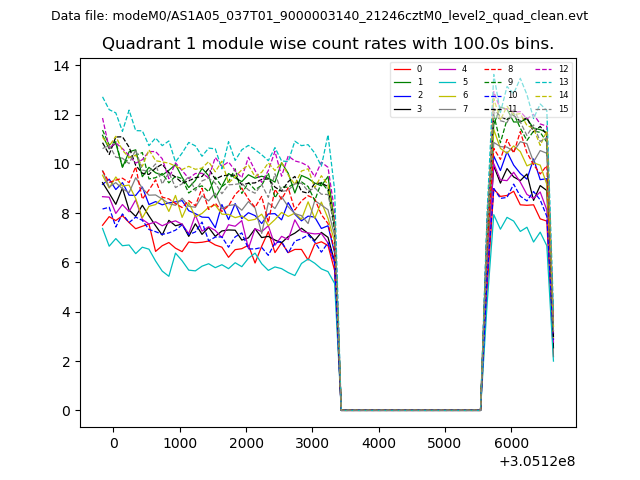
| Module-wise count rates for Quadrant A Data is divided into 100 sec bins |
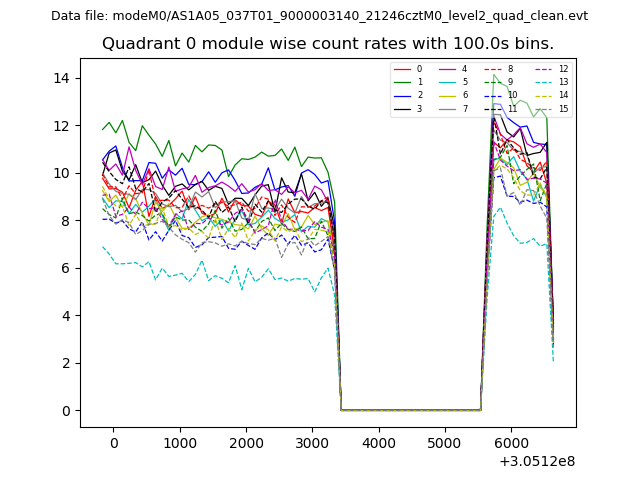 |
 |
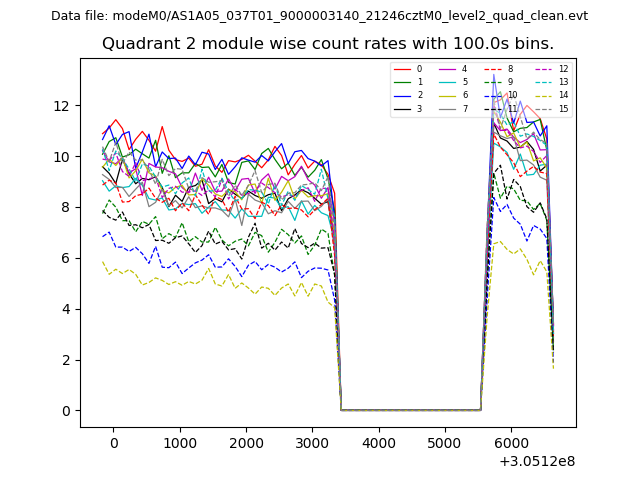
| Module-wise count rates for Quadrant B Data is divided into 100 sec bins |
 |
 |
| Module-wise count rates for Quadrant C Data is divided into 100 sec bins |
 |
 |
| Module-wise count rates for Quadrant D Data is divided into 100 sec bins |
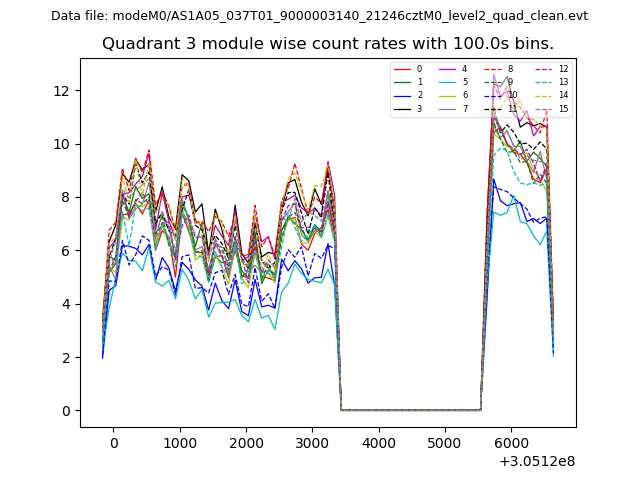 |
 |
| Parameter | Plot |
|---|---|
| CZT HV Monitor | 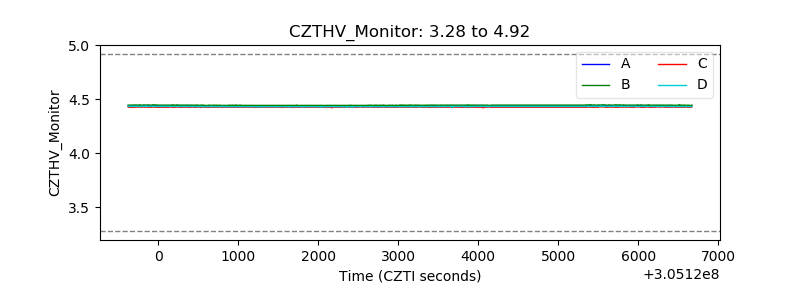 |
| D_VDD | 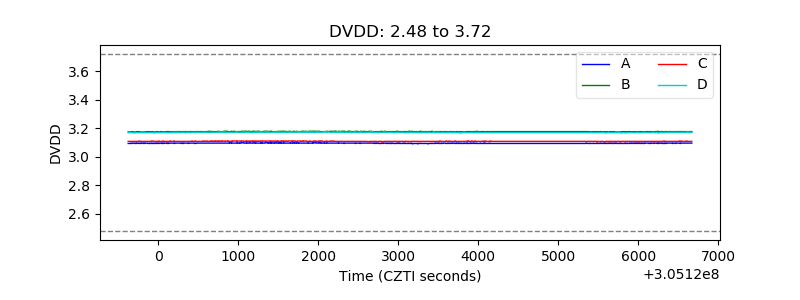 |
| Temperature 1 |  |
| Veto HV Monitor |  |
| Veto LLD | 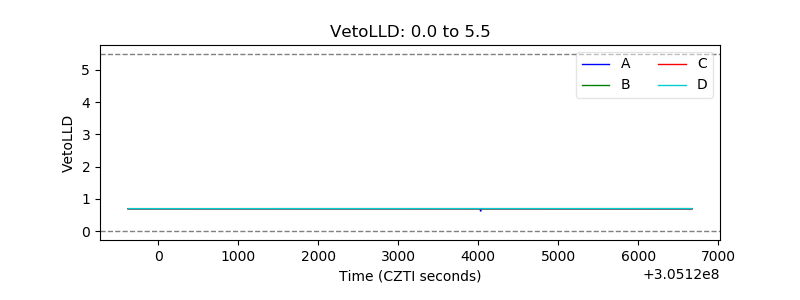 |
| Alpha Counter | 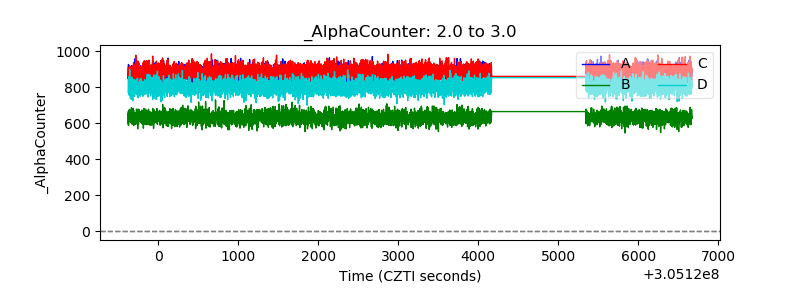 |
| _CPM_Rate | 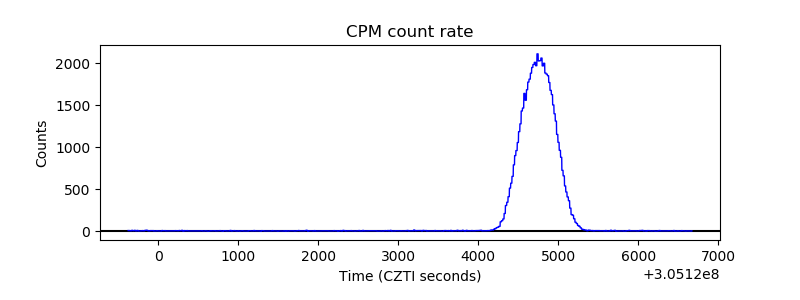 |
| CZT Counter | 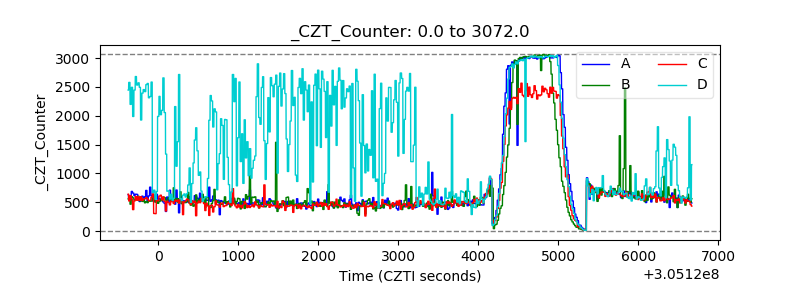 |
| +2.5 Volts monitor |  |
| +5 Volts monitor |  |
| _ROLL_ROT | 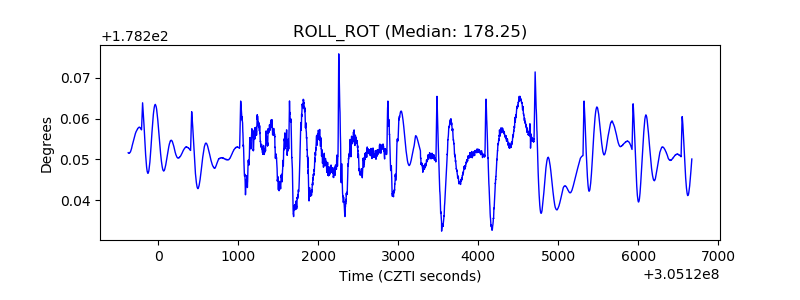 |
| _Roll_DEC |  |
| _Roll_RA | 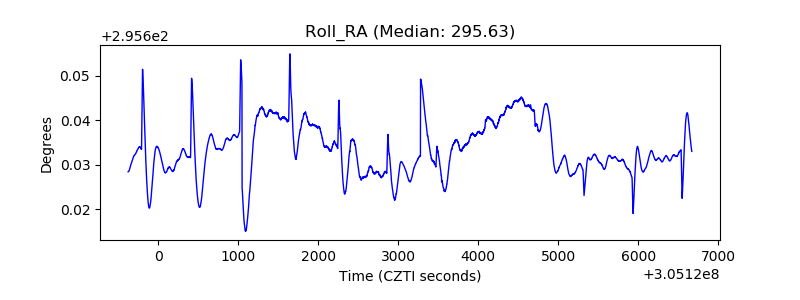 |
| Veto Counter | 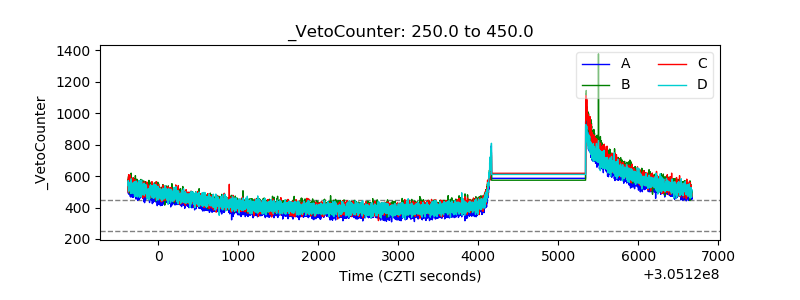 |