| Param | Original file | Final file |
|---|---|---|
| Filename | modeM0/AS1A05_037T01_9000003140_21247cztM0_level2.evt | modeM0/AS1A05_037T01_9000003140_21247cztM0_level2_quad_clean.evt |
| Size (bytes) | 472,872,960 | 103,625,280 |
| Size | 451.0 MB | 98.8 MB |
| Events in quadrant A | 2,986,214 | 708,639 |
| Events in quadrant B | 3,102,254 | 712,329 |
| Events in quadrant C | 2,921,537 | 677,799 |
| Events in quadrant D | 4,929,705 | 646,510 |
| Mode M9 | |||
|---|---|---|---|
| Quadrant | BADHDUFLAG | Total packets | Discarded packets |
| A | 0 | 12 | 0 |
| B | 0 | 12 | 0 |
| C | 0 | 12 | 0 |
| D | 0 | 12 | 0 |
| Mode M0 | |||
|---|---|---|---|
| Quadrant | BADHDUFLAG | Total packets | Discarded packets |
| A | 0 | 12481 | 1 |
| B | 0 | 12862 | 1 |
| C | 0 | 12240 | 1 |
| D | 0 | 18602 | 4 |
| Mode SS | |||
|---|---|---|---|
| Quadrant | BADHDUFLAG | Total packets | Discarded packets |
| A | 0 | 116 | 0 |
| B | 0 | 116 | 0 |
| C | 0 | 116 | 0 |
| D | 0 | 116 | 0 |
| Quadrant | Total seconds | Saturated seconds | Saturation percentage |
|---|---|---|---|
| A | 5614 | 69 | 1.229070% |
| B | 5615 | 97 | 1.727516% |
| C | 5615 | 99 | 1.763134% |
| D | 5614 | 327 | 5.824724% |
Noise dominated data is calculated using 1-second bins in cleaned event files. If a bin has >2000 counts, and if more than 50% of those come from <1% of pixels, then it is considered to be noise-dominated and hence unusable.
| Quadrant | # 1 sec bins | Bins with >0 counts | Bins with >2000 counts | High rate bins dominated by noise | Noise dominated (total time) | Noise dominated (detector-on time) | Marked lightcurve |
|---|---|---|---|---|---|---|---|
| A | 6869 | 5614 | 0 | 0 | 0.00% | 0.00% | 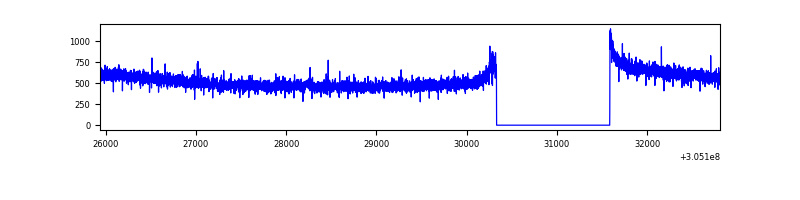 |
| B | 6870 | 5615 | 8 | 8 | 0.12% | 0.14% | 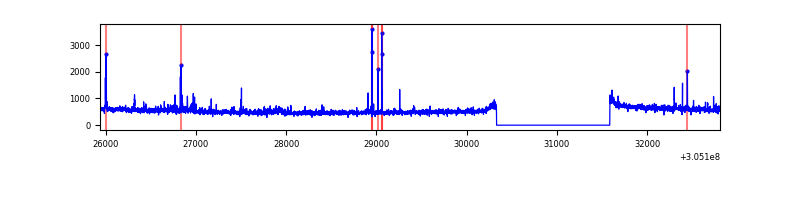 |
| C | 6870 | 5615 | 2 | 2 | 0.03% | 0.04% | 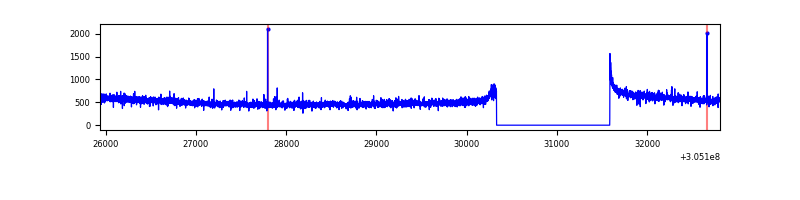 |
| D | 6869 | 5614 | 228 | 228 | 3.32% | 4.06% | 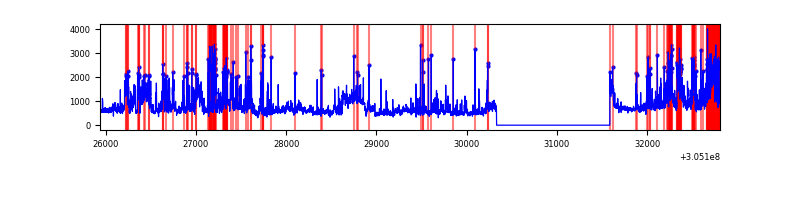 |
Top three noisy pixels from each quadrant. If the there are fewer than three noisy pixels in the level2.evt file, extra rows are filled as -1
| Pixel properties | Quadrant properties | ||||||
|---|---|---|---|---|---|---|---|
| Quadrant | DetID | PixID | Counts | Sigma | Mean | Median | Sigma |
| A | 15 | 236 | 40632 | 261.75 | 761 | 750 | 152.4 |
| A | 13 | 254 | 9163 | 55.22 | 761 | 750 | 152.4 |
| A | 5 | 168 | 7352 | 43.33 | 761 | 750 | 152.4 |
| B | 3 | 64 | 43855 | 303.14 | 749 | 735 | 142.2 |
| B | 0 | 245 | 38110 | 262.75 | 749 | 735 | 142.2 |
| B | 0 | 197 | 28539 | 195.47 | 749 | 735 | 142.2 |
| C | 14 | 238 | 114512 | 690.89 | 714 | 722 | 164.7 |
| C | 3 | 233 | 10164 | 57.33 | 714 | 722 | 164.7 |
| C | 0 | 207 | 7641 | 42.01 | 714 | 722 | 164.7 |
| D | 1 | 239 | 1169784 | 6666.14 | 725 | 705 | 175.4 |
| D | 1 | 52 | 448238 | 2551.85 | 725 | 705 | 175.4 |
| D | 13 | 104 | 132421 | 751.05 | 725 | 705 | 175.4 |
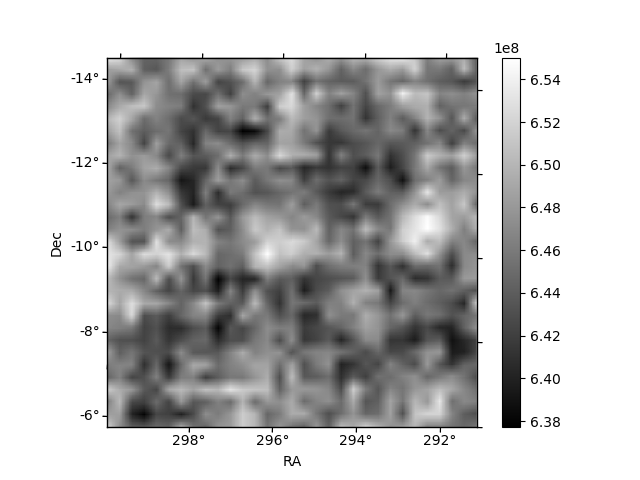
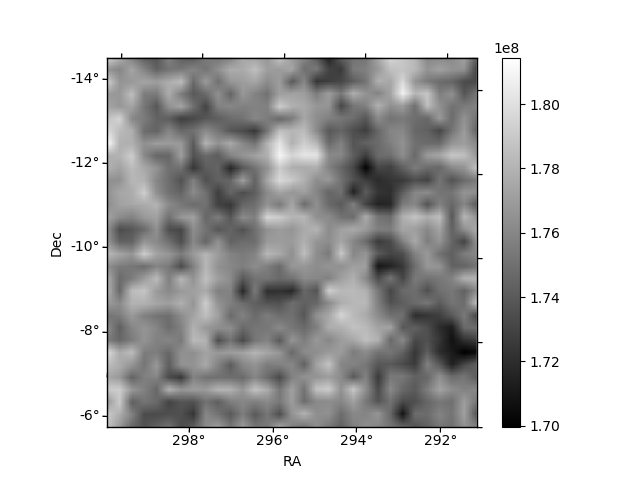
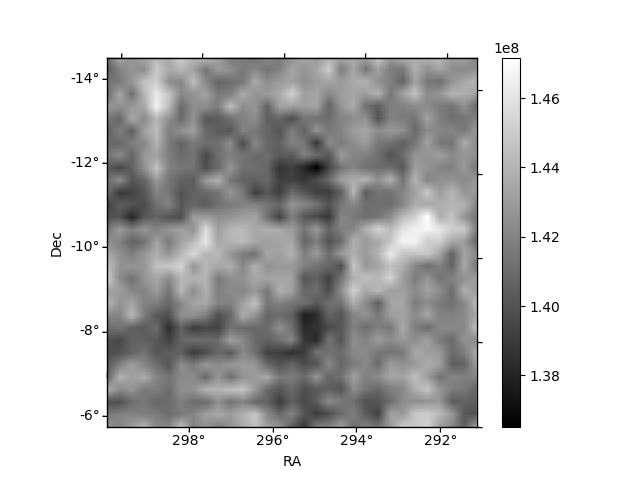
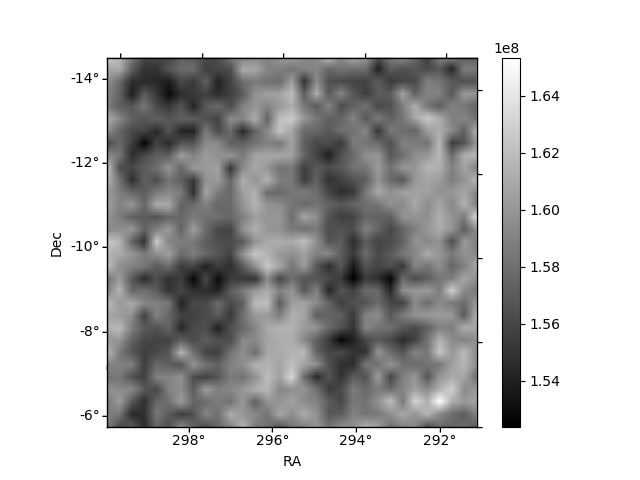
Histogram calculated using DETX and DETY for each event in the final _common_clean file
| Quadrant A | 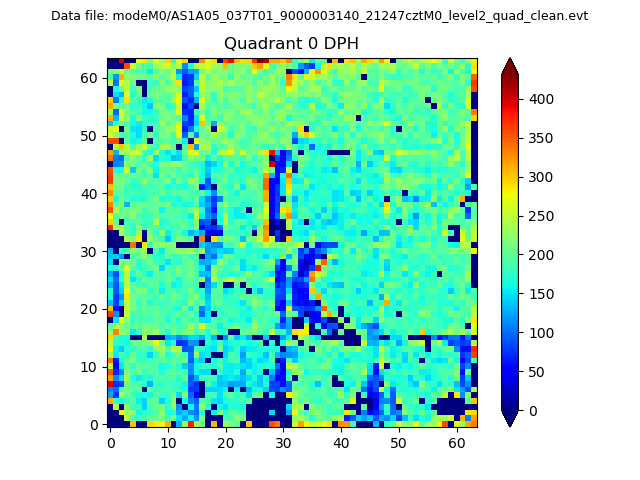 |
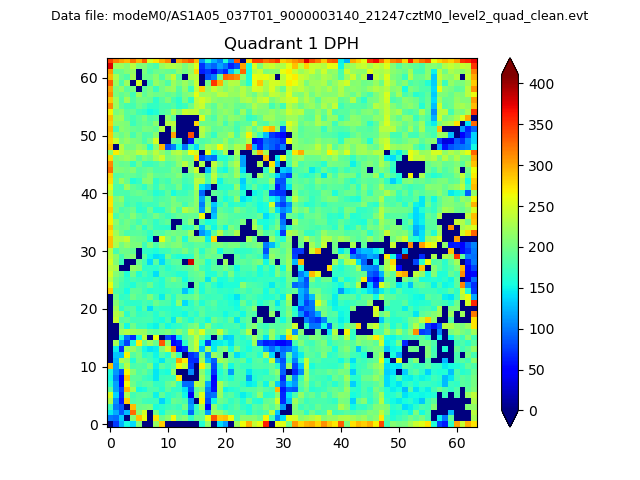 |
Quadrant B |
|---|---|---|---|
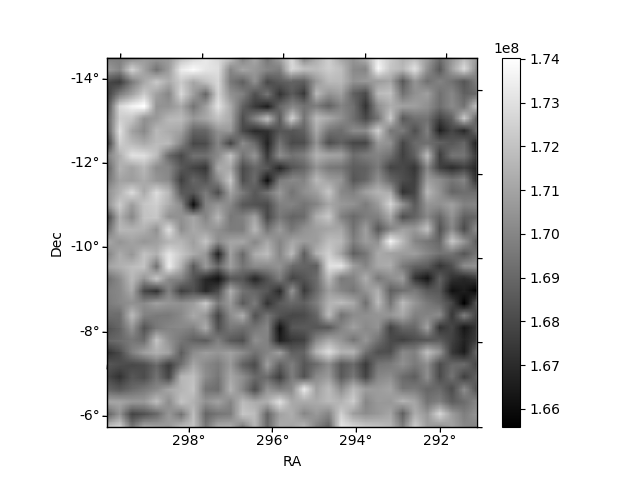
| Quadrant D |  |
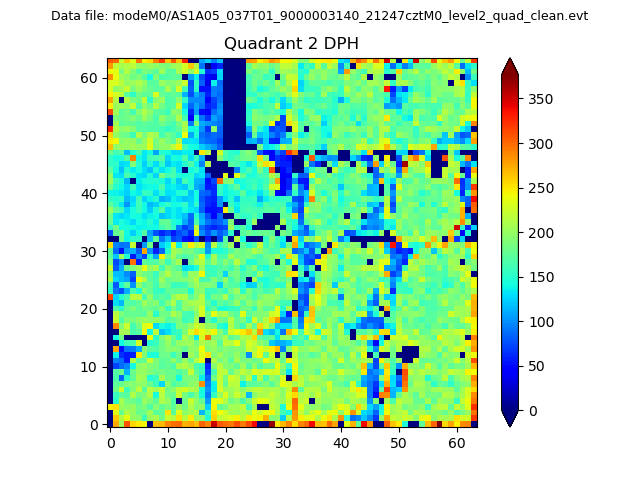 |
Quadrant C |
| Plot type | Count rate plots | Images |
|---|---|---|
| Comparison with Poisson distribution Blue bars denote a histogram of data divided into 1 sec bins. Red curve is a Poisson curve with rate = median count rate of data. |
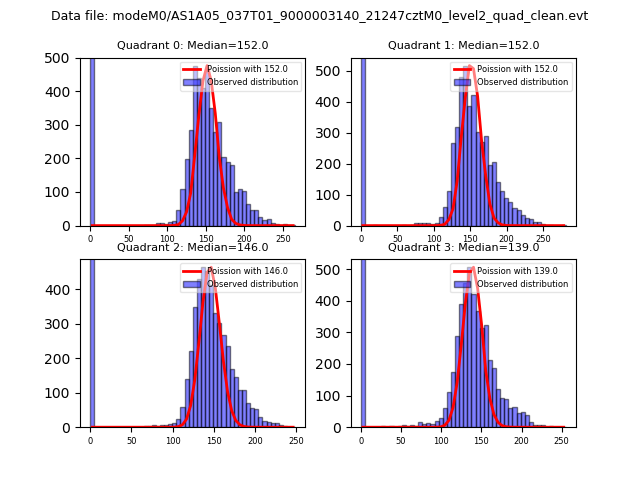 |
 |
| Quadrant-wise count rates Data is divided into 100 sec bins |
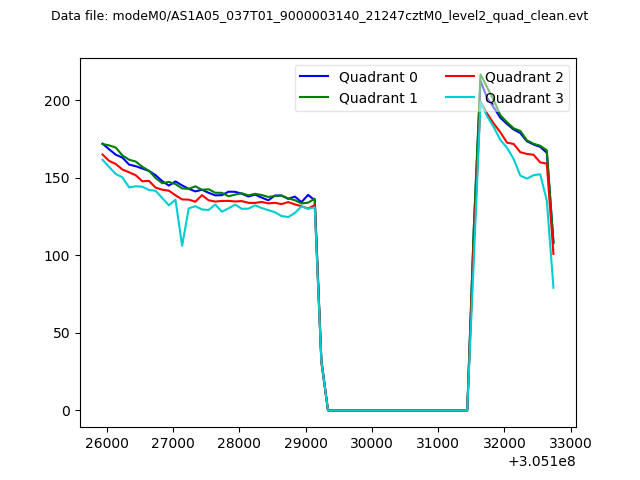 |
|
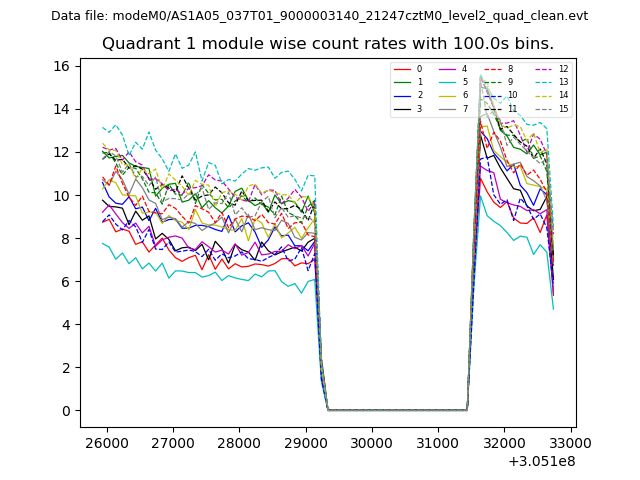
| Module-wise count rates for Quadrant A Data is divided into 100 sec bins |
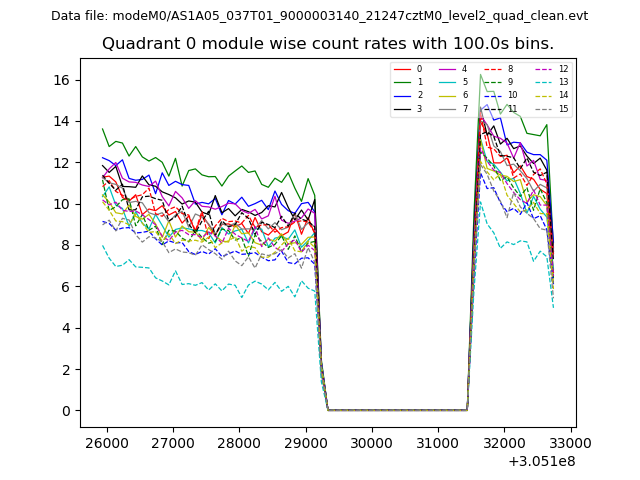 |
 |
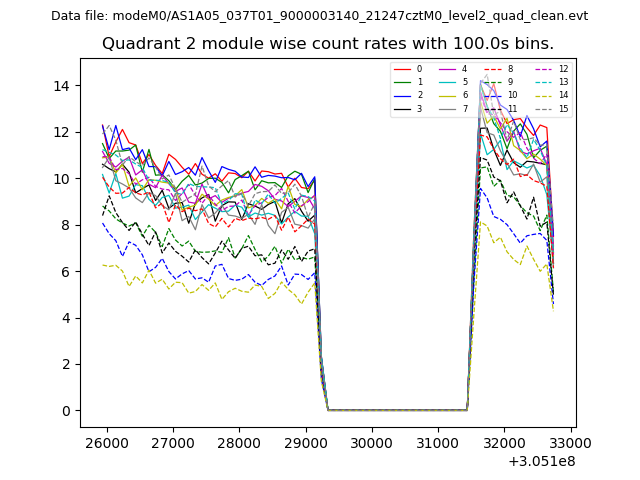
| Module-wise count rates for Quadrant B Data is divided into 100 sec bins |
 |
 |
| Module-wise count rates for Quadrant C Data is divided into 100 sec bins |
 |
 |
| Module-wise count rates for Quadrant D Data is divided into 100 sec bins |
 |
 |
| Parameter | Plot |
|---|---|
| CZT HV Monitor | 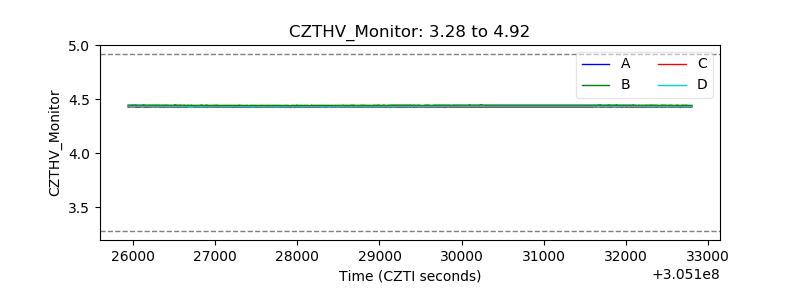 |
| D_VDD | 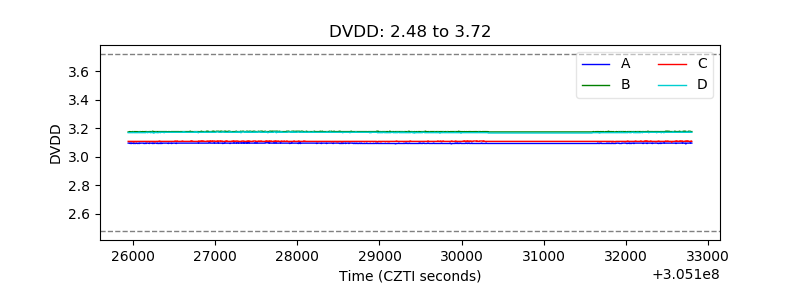 |
| Temperature 1 | 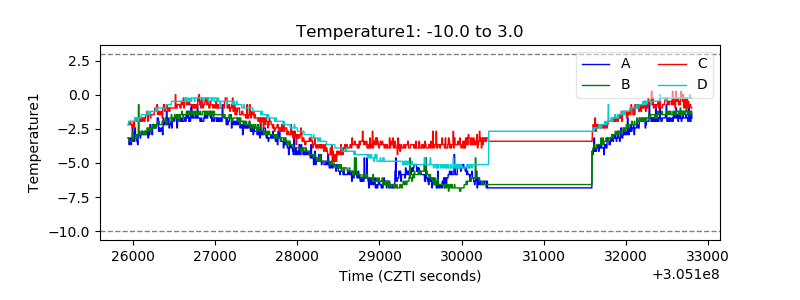 |
| Veto HV Monitor | 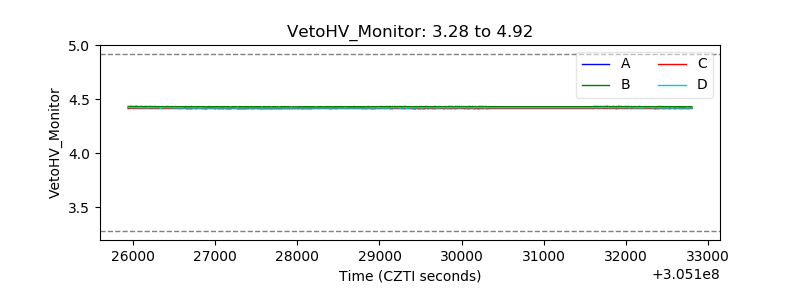 |
| Veto LLD |  |
| Alpha Counter | 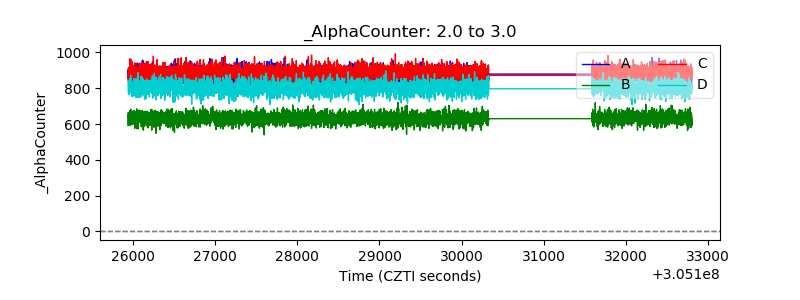 |
| _CPM_Rate | 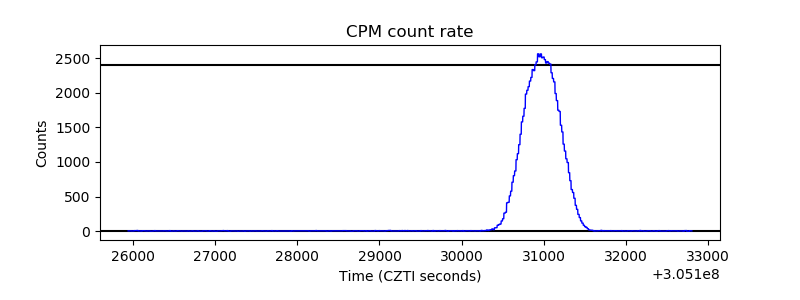 |
| CZT Counter | 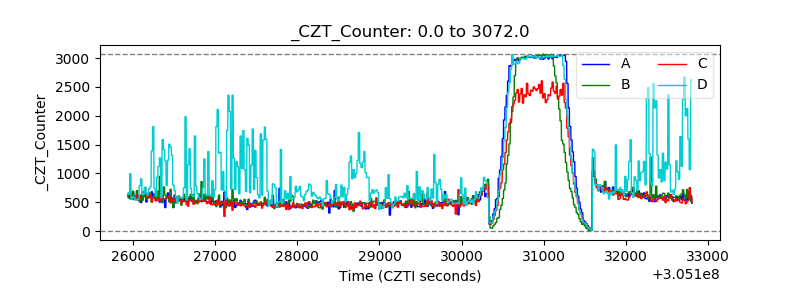 |
| +2.5 Volts monitor |  |
| +5 Volts monitor |  |
| _ROLL_ROT |  |
| _Roll_DEC | 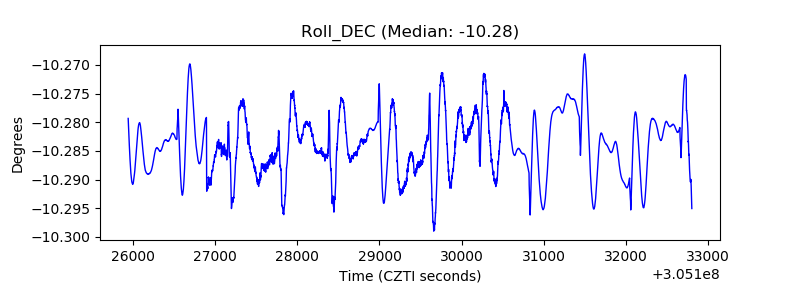 |
| _Roll_RA | 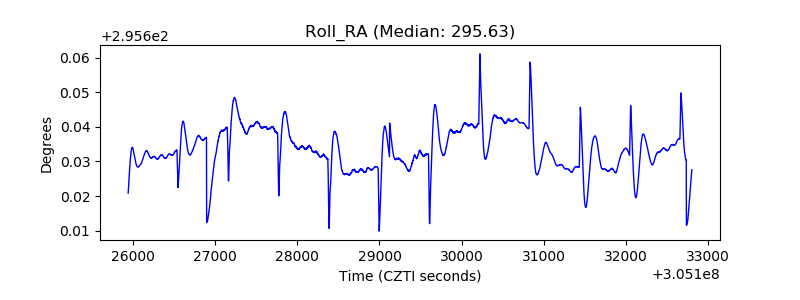 |
| Veto Counter |  |