| Param | Original file | Final file |
|---|---|---|
| Filename | modeM0/AS1A05_037T01_9000003140_21249cztM0_level2.evt | modeM0/AS1A05_037T01_9000003140_21249cztM0_level2_quad_clean.evt |
| Size (bytes) | 647,409,600 | 101,111,040 |
| Size | 617.4 MB | 96.4 MB |
| Events in quadrant A | 3,346,566 | 709,178 |
| Events in quadrant B | 4,127,454 | 686,529 |
| Events in quadrant C | 3,334,412 | 675,222 |
| Events in quadrant D | 8,373,788 | 552,448 |
| Mode M9 | |||
|---|---|---|---|
| Quadrant | BADHDUFLAG | Total packets | Discarded packets |
| A | 0 | 14 | 0 |
| B | 0 | 14 | 0 |
| C | 0 | 14 | 0 |
| D | 0 | 14 | 0 |
| Mode M0 | |||
|---|---|---|---|
| Quadrant | BADHDUFLAG | Total packets | Discarded packets |
| A | 0 | 13850 | 1 |
| B | 0 | 16371 | 1 |
| C | 0 | 13802 | 1 |
| D | 0 | 29278 | 1 |
| Mode SS | |||
|---|---|---|---|
| Quadrant | BADHDUFLAG | Total packets | Discarded packets |
| A | 0 | 128 | 0 |
| B | 0 | 128 | 0 |
| C | 0 | 128 | 0 |
| D | 0 | 128 | 0 |
| Quadrant | Total seconds | Saturated seconds | Saturation percentage |
|---|---|---|---|
| A | 6275 | 83 | 1.322709% |
| B | 6275 | 371 | 5.912351% |
| C | 6276 | 137 | 2.182919% |
| D | 6275 | 1537 | 24.494024% |
Noise dominated data is calculated using 1-second bins in cleaned event files. If a bin has >2000 counts, and if more than 50% of those come from <1% of pixels, then it is considered to be noise-dominated and hence unusable.
| Quadrant | # 1 sec bins | Bins with >0 counts | Bins with >2000 counts | High rate bins dominated by noise | Noise dominated (total time) | Noise dominated (detector-on time) | Marked lightcurve |
|---|---|---|---|---|---|---|---|
| A | 7640 | 6275 | 0 | 0 | 0.00% | 0.00% | 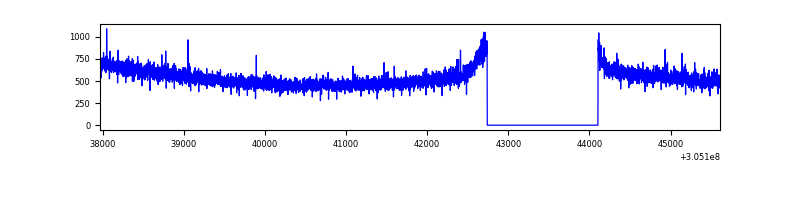 |
| B | 7640 | 6275 | 229 | 229 | 3.00% | 3.65% |  |
| C | 7641 | 6277 | 23 | 23 | 0.30% | 0.37% | 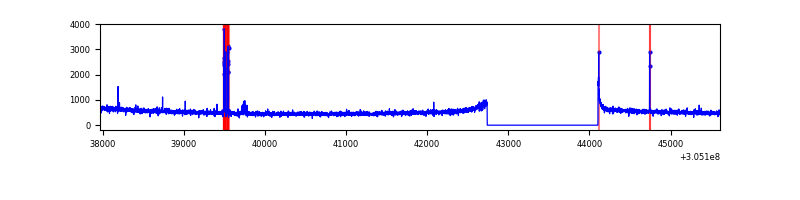 |
| D | 7640 | 6276 | 1451 | 1451 | 18.99% | 23.12% | 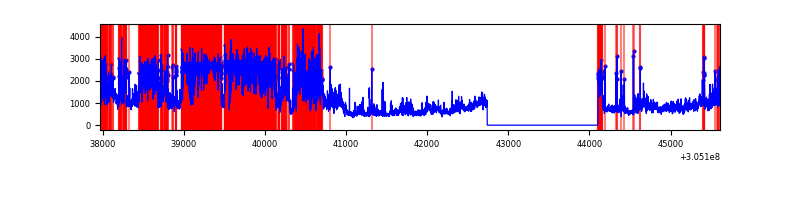 |
Top three noisy pixels from each quadrant. If the there are fewer than three noisy pixels in the level2.evt file, extra rows are filled as -1
| Pixel properties | Quadrant properties | ||||||
|---|---|---|---|---|---|---|---|
| Quadrant | DetID | PixID | Counts | Sigma | Mean | Median | Sigma |
| A | 15 | 236 | 46873 | 272.7 | 849 | 835 | 168.8 |
| A | 5 | 168 | 18989 | 107.53 | 849 | 835 | 168.8 |
| A | 13 | 254 | 9761 | 52.87 | 849 | 835 | 168.8 |
| B | 0 | 189 | 710824 | 4631.72 | 820 | 803 | 153.3 |
| B | 0 | 245 | 130678 | 847.22 | 820 | 803 | 153.3 |
| B | 0 | 190 | 24074 | 151.8 | 820 | 803 | 153.3 |
| C | 14 | 238 | 126899 | 689.34 | 796 | 804 | 182.9 |
| C | 0 | 207 | 83955 | 454.57 | 796 | 804 | 182.9 |
| C | 0 | 10 | 17806 | 92.95 | 796 | 804 | 182.9 |
| D | 14 | 34 | 3426574 | 18846.04 | 745 | 725 | 181.8 |
| D | 12 | 235 | 739774 | 4065.6 | 745 | 725 | 181.8 |
| D | 1 | 239 | 398981 | 2190.86 | 745 | 725 | 181.8 |
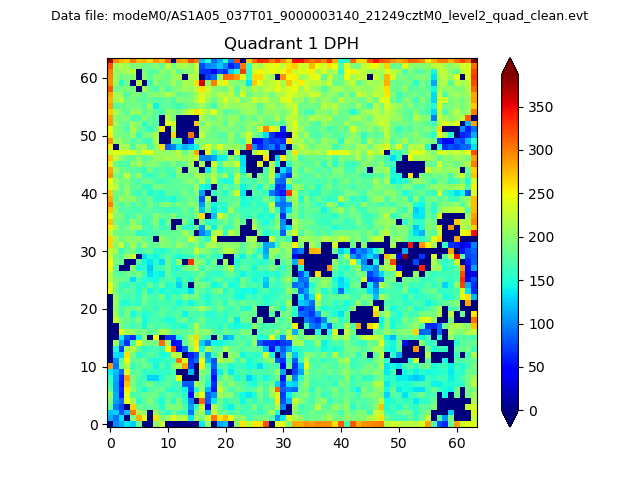
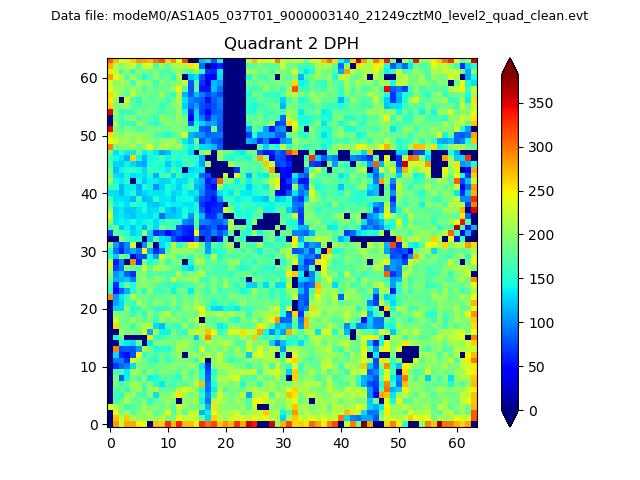
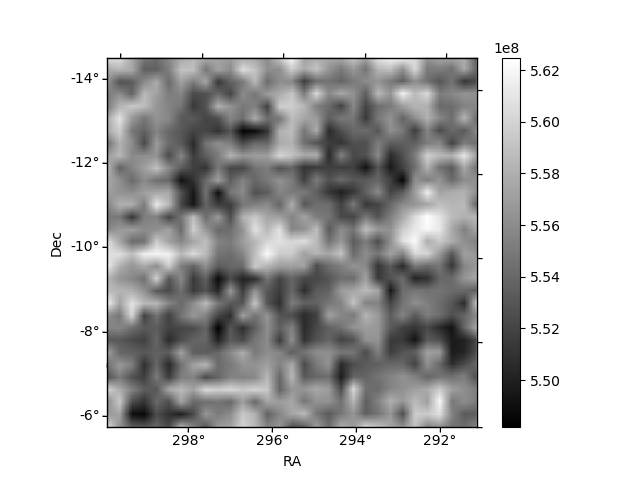
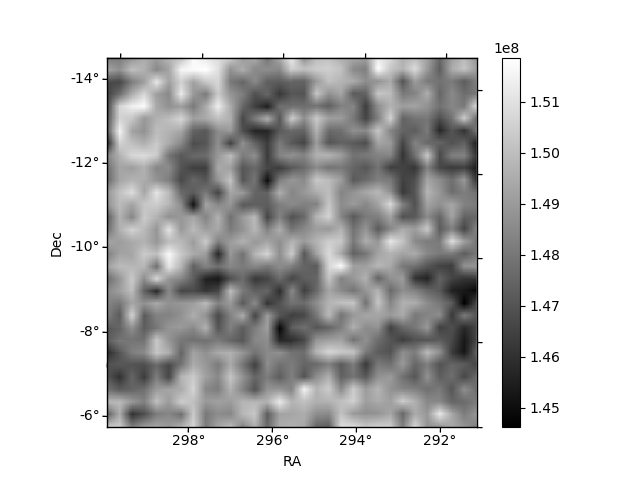
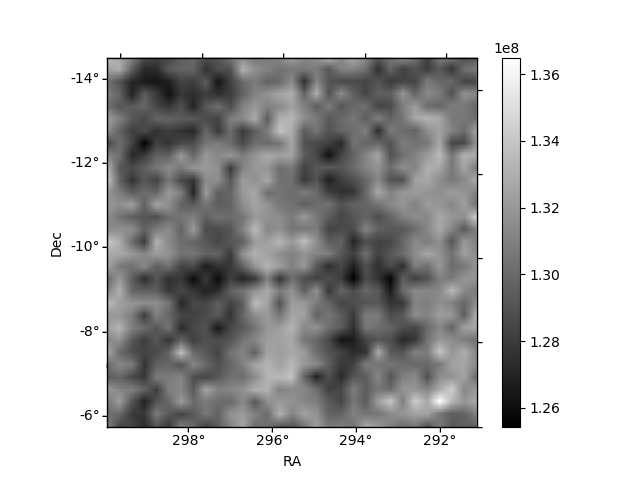
Histogram calculated using DETX and DETY for each event in the final _common_clean file
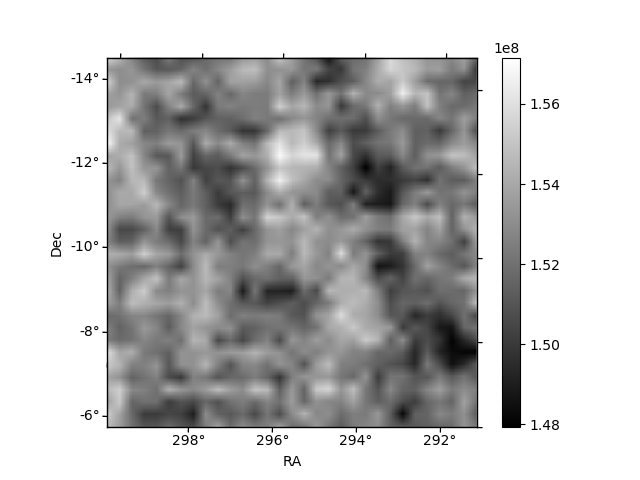
| Quadrant A | 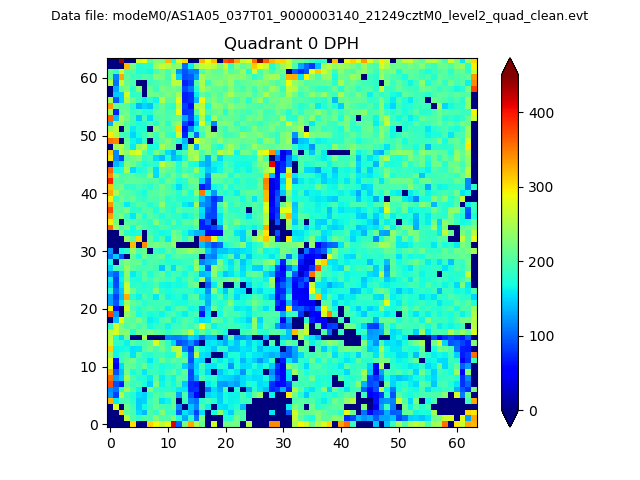 |
 |
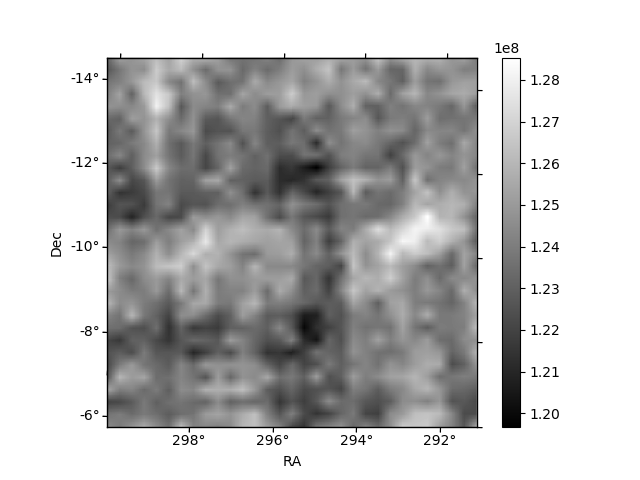
Quadrant B |
|---|---|---|---|
| Quadrant D | 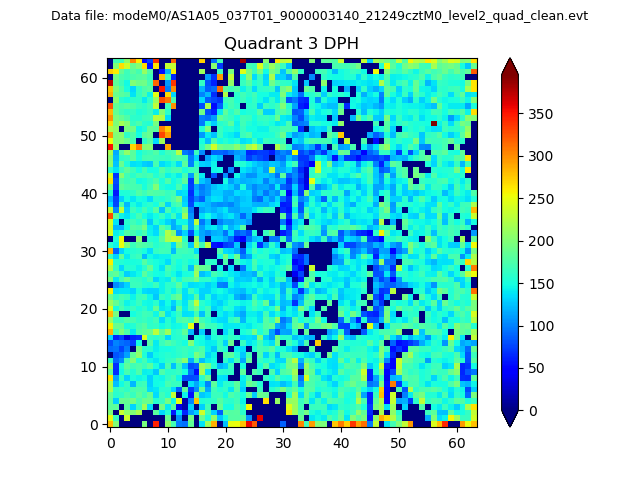 |
 |
Quadrant C |
| Plot type | Count rate plots | Images |
|---|---|---|
| Comparison with Poisson distribution Blue bars denote a histogram of data divided into 1 sec bins. Red curve is a Poisson curve with rate = median count rate of data. |
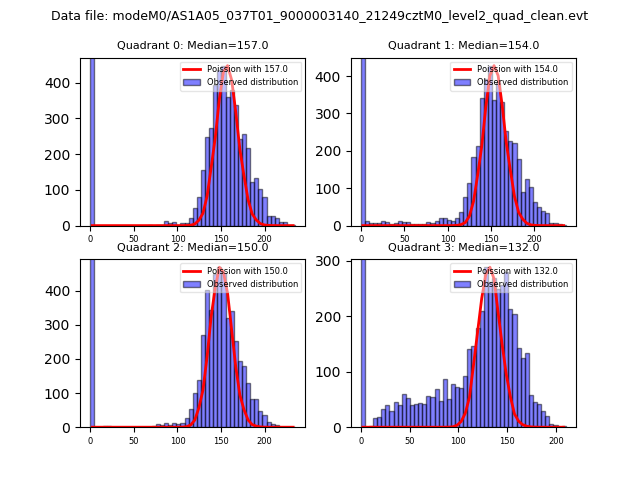 |
 |
| Quadrant-wise count rates Data is divided into 100 sec bins |
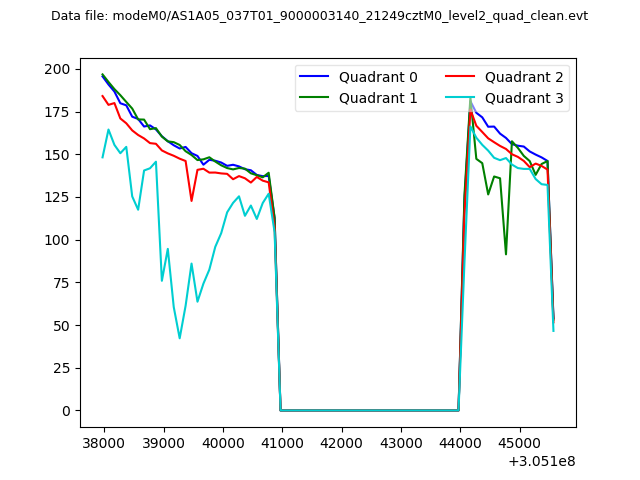 |
|
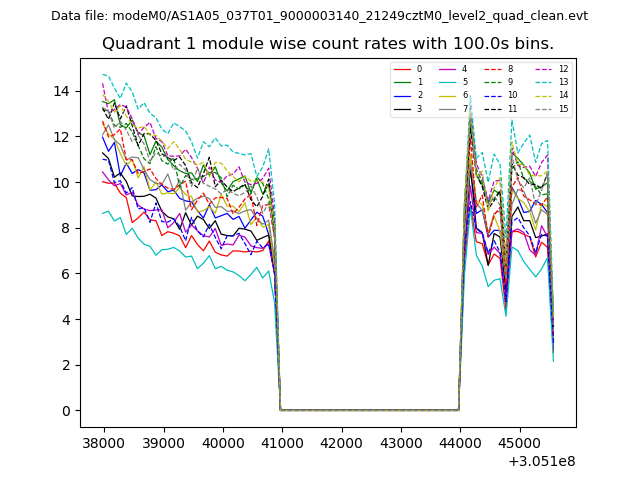
| Module-wise count rates for Quadrant A Data is divided into 100 sec bins |
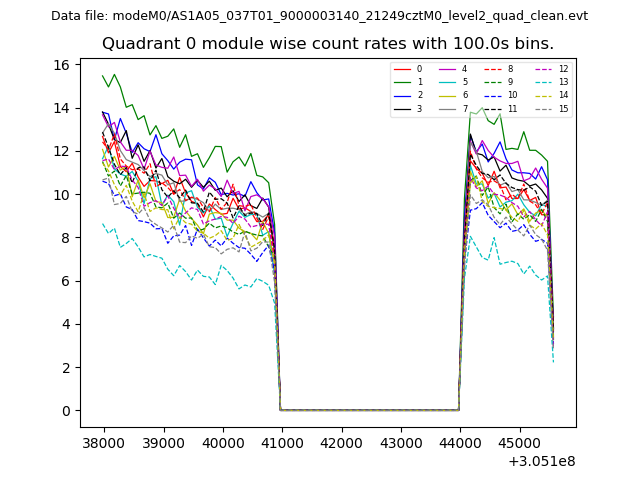 |
 |
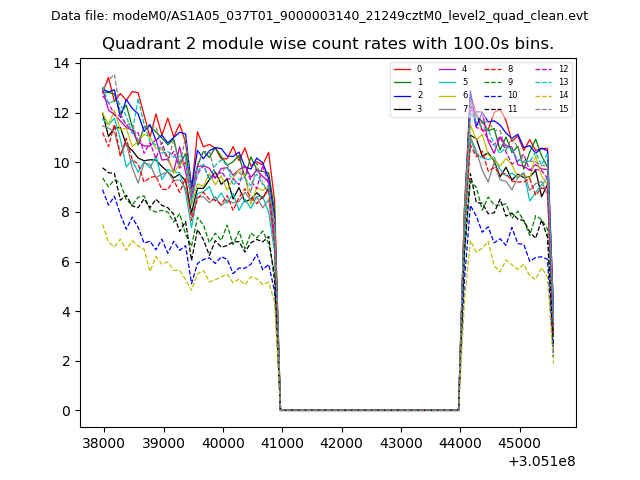
| Module-wise count rates for Quadrant B Data is divided into 100 sec bins |
 |
 |
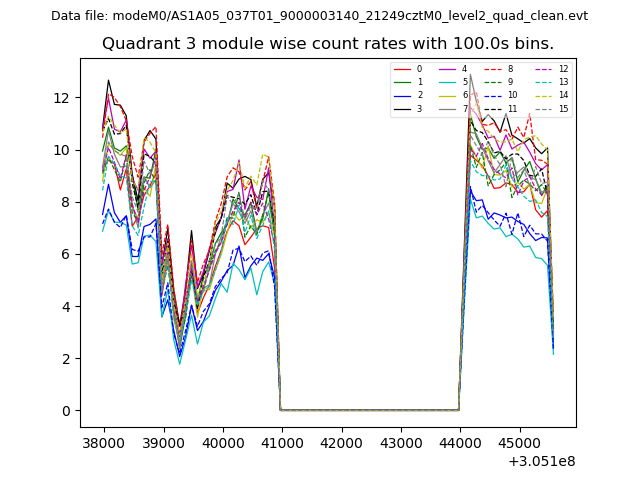
| Module-wise count rates for Quadrant C Data is divided into 100 sec bins |
 |
 |
| Module-wise count rates for Quadrant D Data is divided into 100 sec bins |
 |
 |
| Parameter | Plot |
|---|---|
| CZT HV Monitor | 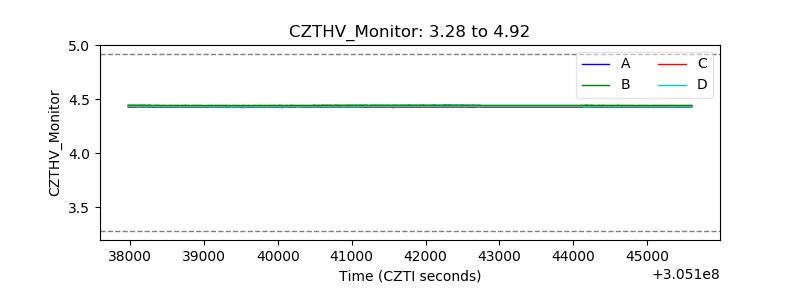 |
| D_VDD | 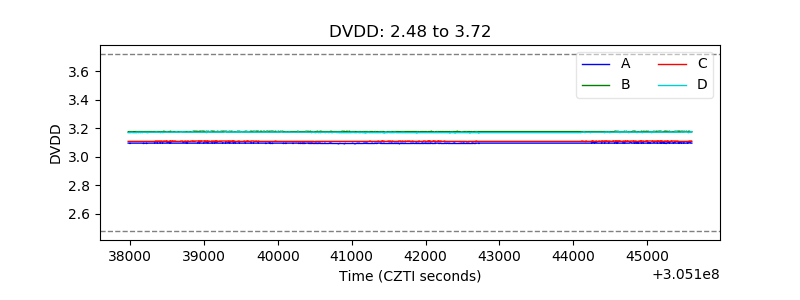 |
| Temperature 1 | 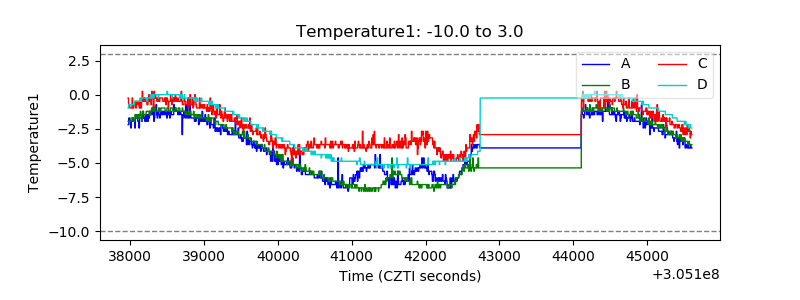 |
| Veto HV Monitor |  |
| Veto LLD | 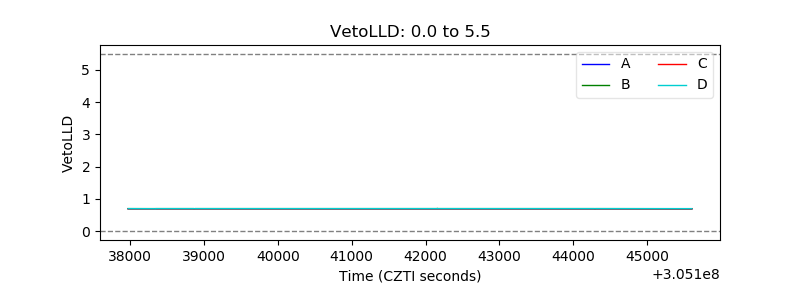 |
| Alpha Counter | 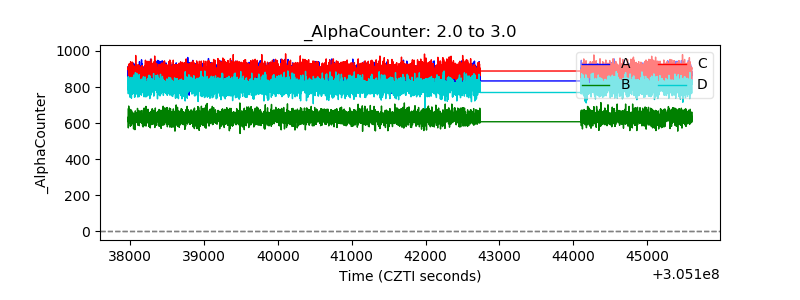 |
| _CPM_Rate |  |
| CZT Counter | 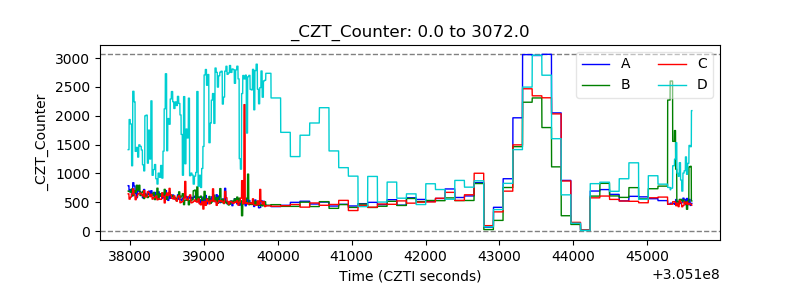 |
| +2.5 Volts monitor |  |
| +5 Volts monitor |  |
| _ROLL_ROT | 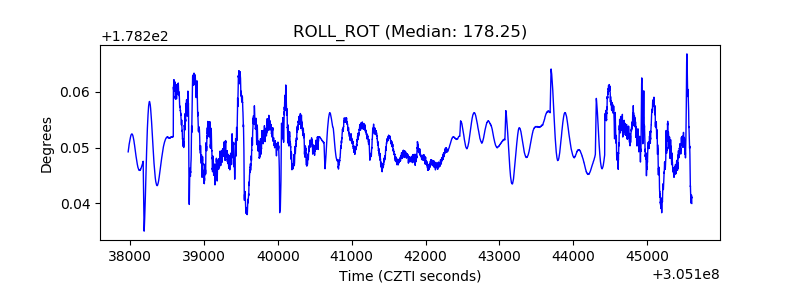 |
| _Roll_DEC | 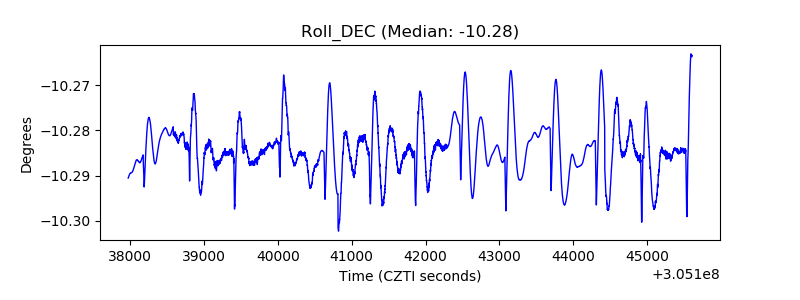 |
| _Roll_RA | 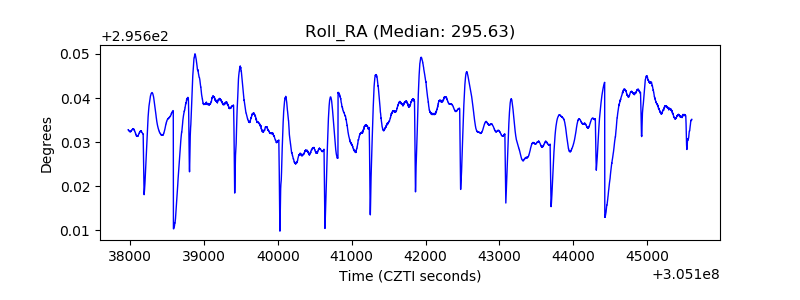 |
| Veto Counter | 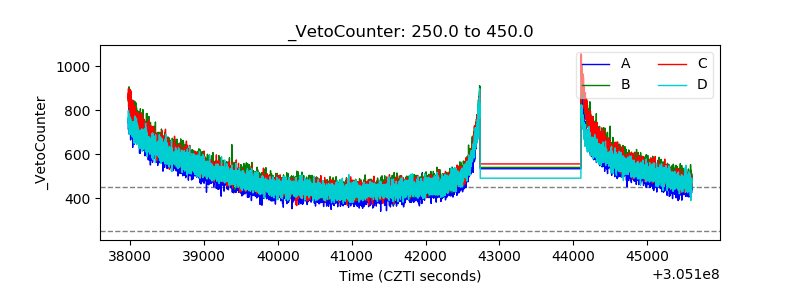 |