| Param | Original file | Final file |
|---|---|---|
| Filename | modeM0/AS1A05_037T01_9000003140_21251cztM0_level2.evt | modeM0/AS1A05_037T01_9000003140_21251cztM0_level2_quad_clean.evt |
| Size (bytes) | 589,852,800 | 91,800,000 |
| Size | 562.5 MB | 87.5 MB |
| Events in quadrant A | 3,502,043 | 607,847 |
| Events in quadrant B | 4,255,829 | 590,919 |
| Events in quadrant C | 3,282,552 | 596,283 |
| Events in quadrant D | 6,372,199 | 520,407 |
| Mode M9 | |||
|---|---|---|---|
| Quadrant | BADHDUFLAG | Total packets | Discarded packets |
| A | 0 | 15 | 0 |
| B | 0 | 16 | 0 |
| C | 0 | 16 | 0 |
| D | 0 | 16 | 0 |
| Mode M0 | |||
|---|---|---|---|
| Quadrant | BADHDUFLAG | Total packets | Discarded packets |
| A | 0 | 14603 | 2 |
| B | 0 | 17050 | 2 |
| C | 0 | 14023 | 2 |
| D | 0 | 23527 | 2 |
| Mode SS | |||
|---|---|---|---|
| Quadrant | BADHDUFLAG | Total packets | Discarded packets |
| A | 0 | 136 | 0 |
| B | 0 | 136 | 0 |
| C | 0 | 136 | 0 |
| D | 0 | 136 | 0 |
| Quadrant | Total seconds | Saturated seconds | Saturation percentage |
|---|---|---|---|
| A | 6655 | 63 | 0.946657% |
| B | 6655 | 407 | 6.115702% |
| C | 6655 | 97 | 1.457551% |
| D | 6655 | 873 | 13.117956% |
Noise dominated data is calculated using 1-second bins in cleaned event files. If a bin has >2000 counts, and if more than 50% of those come from <1% of pixels, then it is considered to be noise-dominated and hence unusable.
| Quadrant | # 1 sec bins | Bins with >0 counts | Bins with >2000 counts | High rate bins dominated by noise | Noise dominated (total time) | Noise dominated (detector-on time) | Marked lightcurve |
|---|---|---|---|---|---|---|---|
| A | 7600 | 6655 | 0 | 0 | 0.00% | 0.00% | 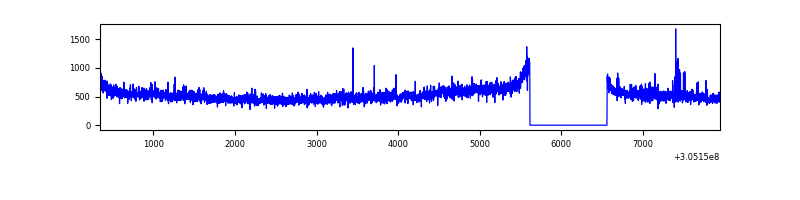 |
| B | 7600 | 6656 | 296 | 296 | 3.89% | 4.45% | 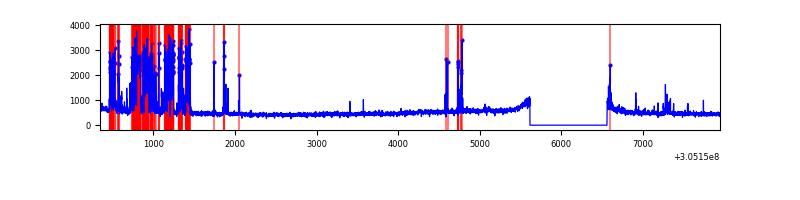 |
| C | 7600 | 6655 | 5 | 5 | 0.07% | 0.08% | 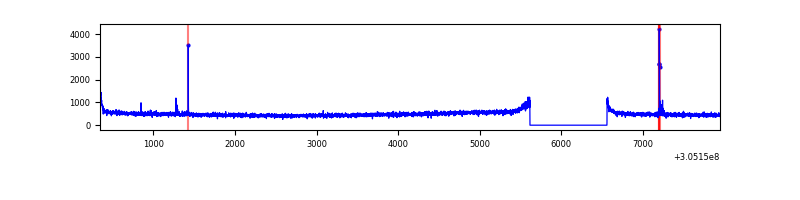 |
| D | 7600 | 6655 | 713 | 713 | 9.38% | 10.71% | 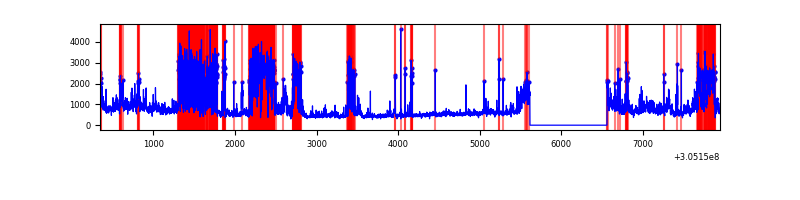 |
Top three noisy pixels from each quadrant. If the there are fewer than three noisy pixels in the level2.evt file, extra rows are filled as -1
| Pixel properties | Quadrant properties | ||||||
|---|---|---|---|---|---|---|---|
| Quadrant | DetID | PixID | Counts | Sigma | Mean | Median | Sigma |
| A | 15 | 236 | 227171 | 1334.51 | 836 | 819 | 169.6 |
| A | 11 | 47 | 27541 | 157.54 | 836 | 819 | 169.6 |
| A | 12 | 96 | 16731 | 93.81 | 836 | 819 | 169.6 |
| B | 0 | 189 | 922483 | 5902.81 | 812 | 791 | 156.1 |
| B | 0 | 190 | 60132 | 380.04 | 812 | 791 | 156.1 |
| B | 3 | 64 | 52299 | 329.87 | 812 | 791 | 156.1 |
| C | 14 | 238 | 124631 | 664.72 | 796 | 802 | 186.3 |
| C | 0 | 207 | 30481 | 159.32 | 796 | 802 | 186.3 |
| C | 0 | 10 | 22385 | 115.86 | 796 | 802 | 186.3 |
| D | 1 | 239 | 1873119 | 10036.2 | 760 | 739 | 186.6 |
| D | 13 | 104 | 401039 | 2145.66 | 760 | 739 | 186.6 |
| D | 14 | 34 | 308421 | 1649.22 | 760 | 739 | 186.6 |
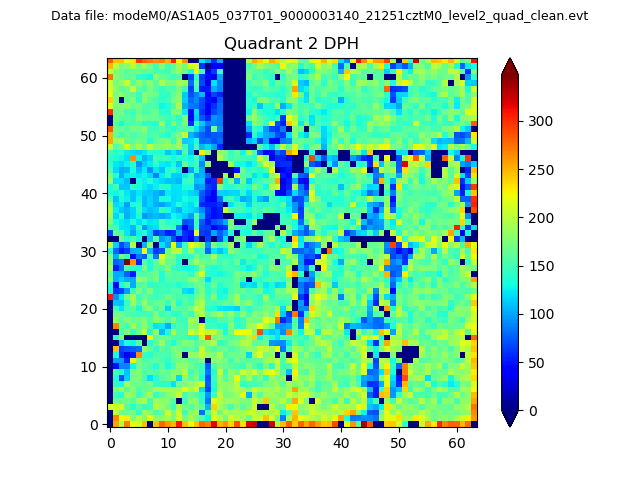
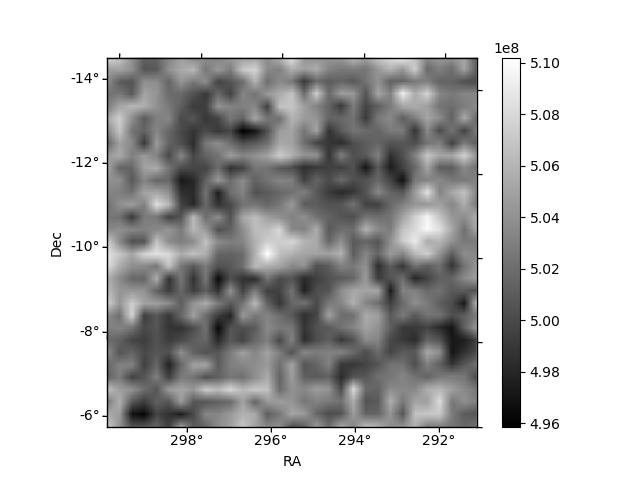
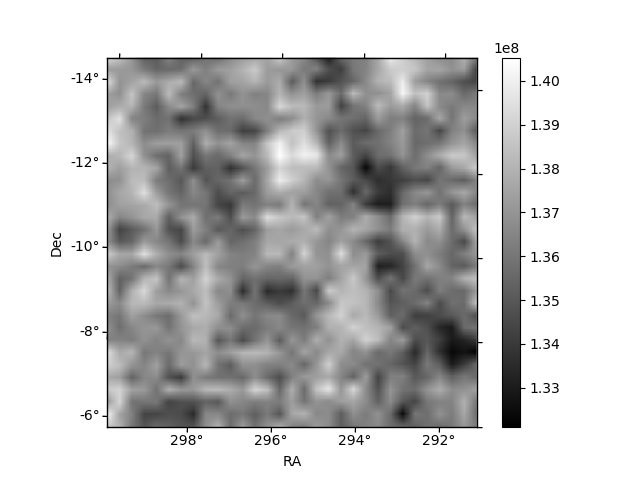
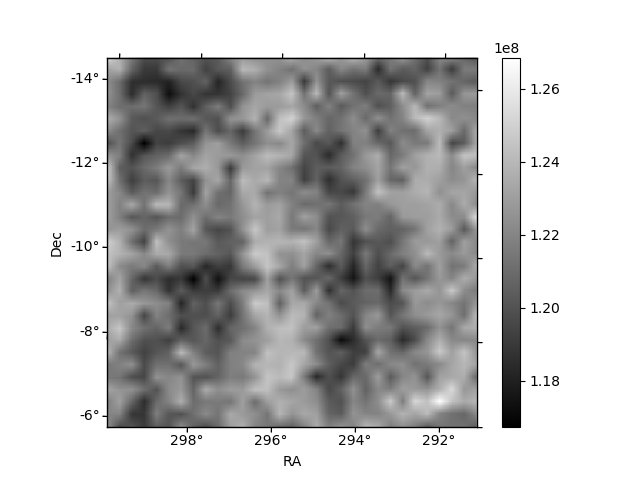
Histogram calculated using DETX and DETY for each event in the final _common_clean file
| Quadrant A | 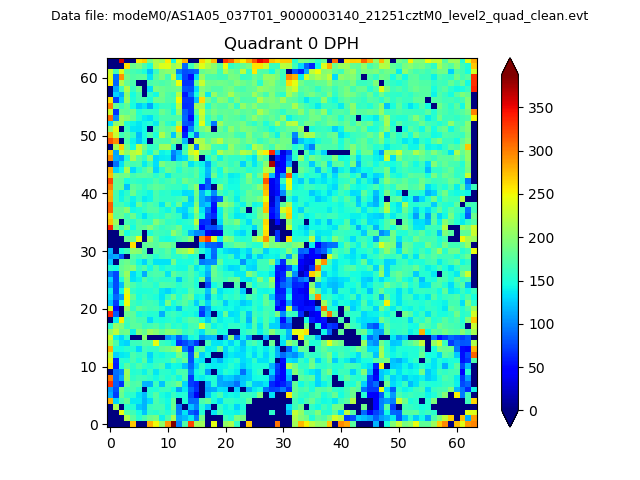 |
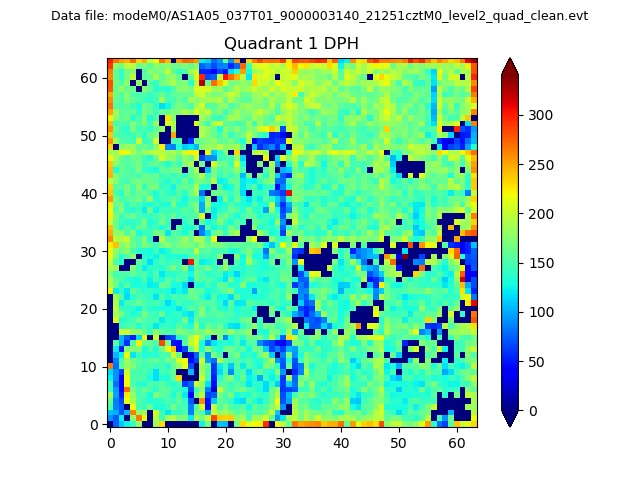 |
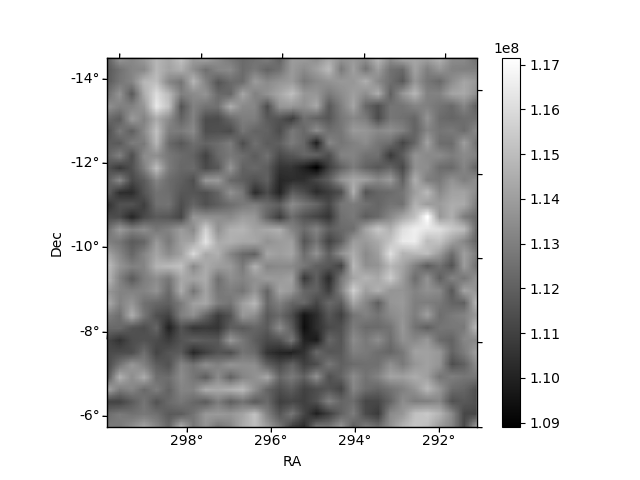
Quadrant B |
|---|---|---|---|
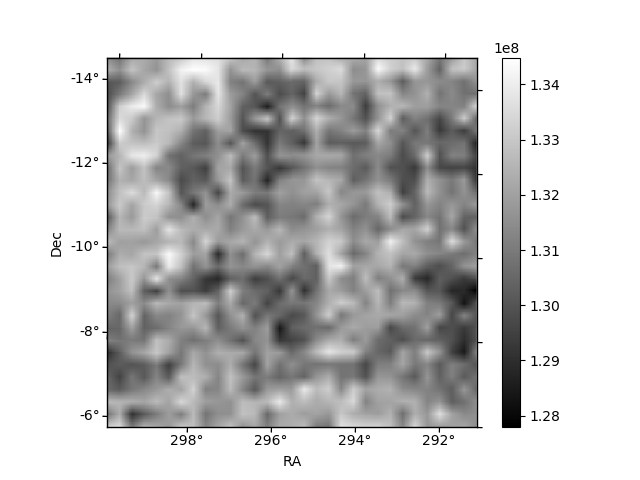
| Quadrant D | 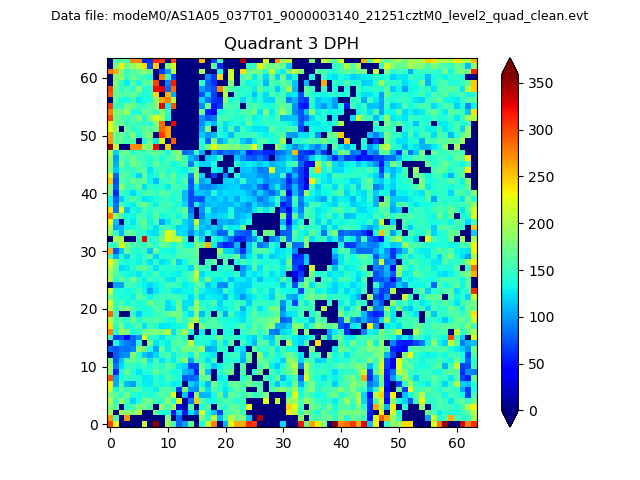 |
 |
Quadrant C |
| Plot type | Count rate plots | Images |
|---|---|---|
| Comparison with Poisson distribution Blue bars denote a histogram of data divided into 1 sec bins. Red curve is a Poisson curve with rate = median count rate of data. |
 |
 |
| Quadrant-wise count rates Data is divided into 100 sec bins |
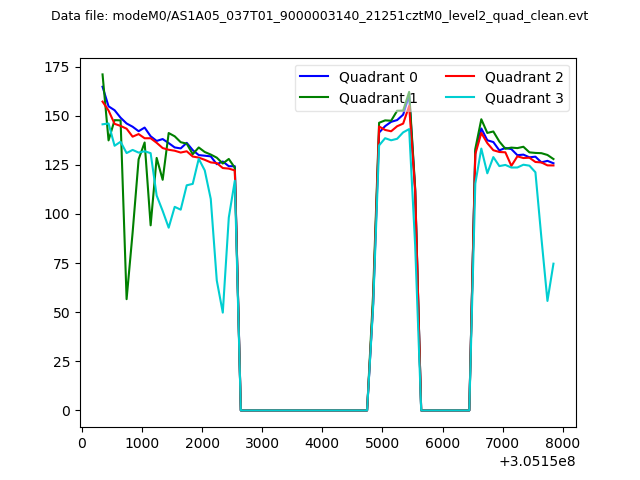 |
|
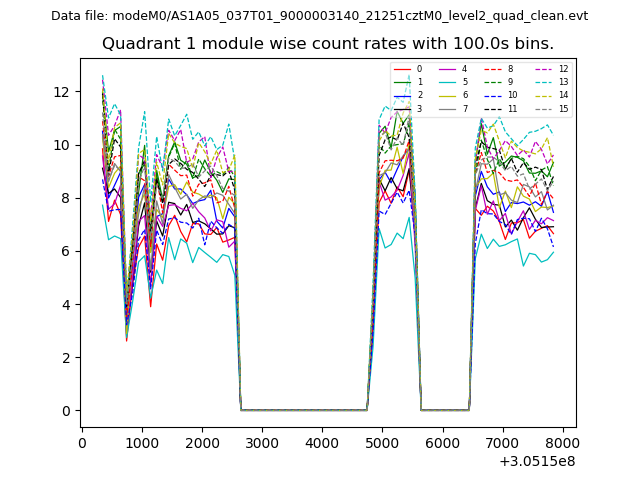
| Module-wise count rates for Quadrant A Data is divided into 100 sec bins |
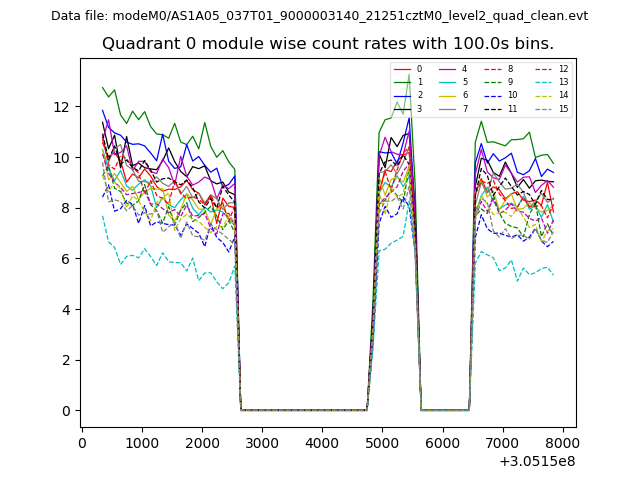 |
 |
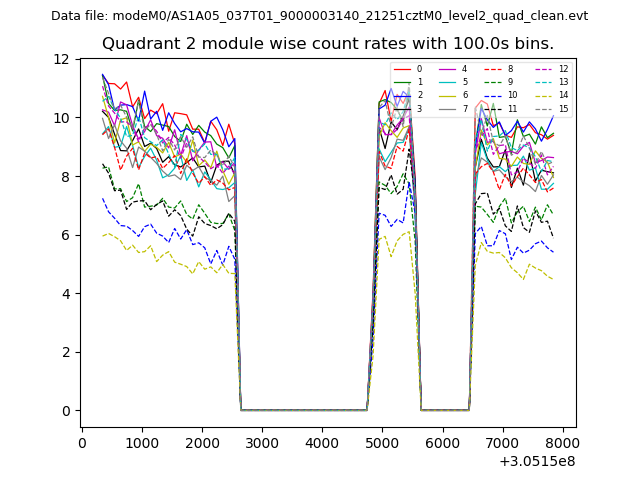
| Module-wise count rates for Quadrant B Data is divided into 100 sec bins |
 |
 |
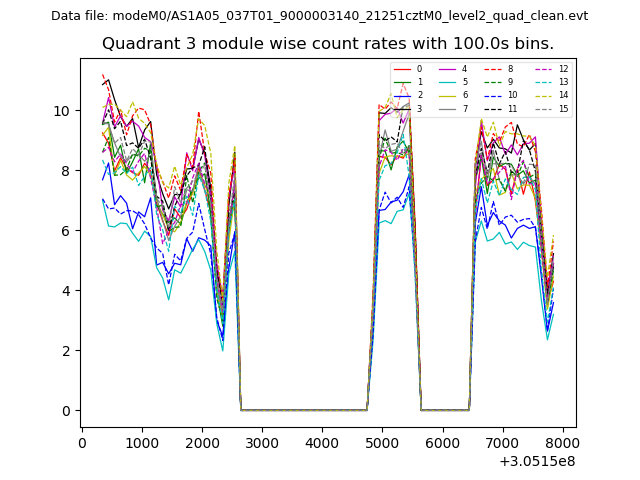
| Module-wise count rates for Quadrant C Data is divided into 100 sec bins |
 |
 |
| Module-wise count rates for Quadrant D Data is divided into 100 sec bins |
 |
 |
| Parameter | Plot |
|---|---|
| CZT HV Monitor | 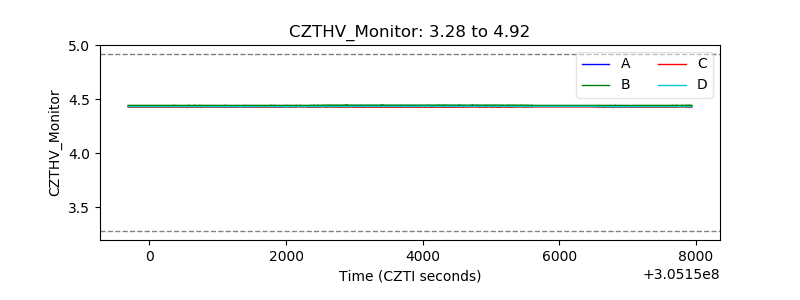 |
| D_VDD | 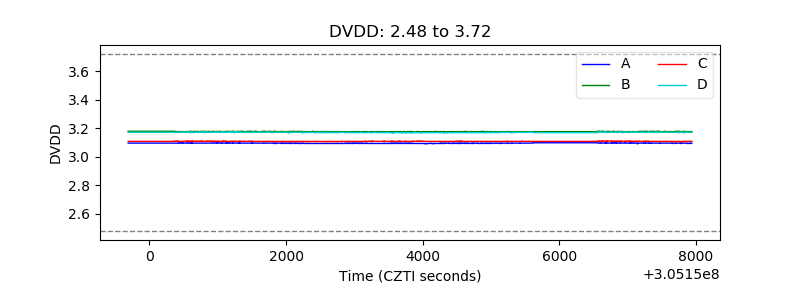 |
| Temperature 1 | 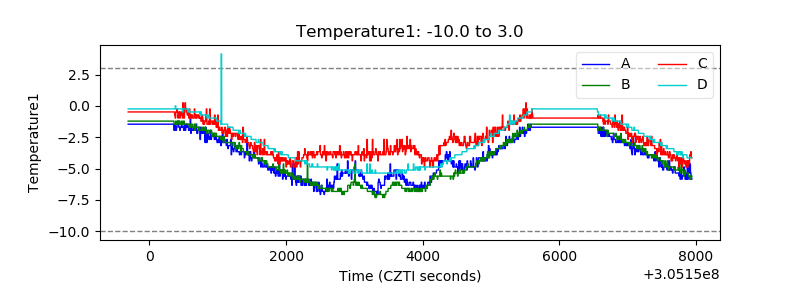 |
| Veto HV Monitor | 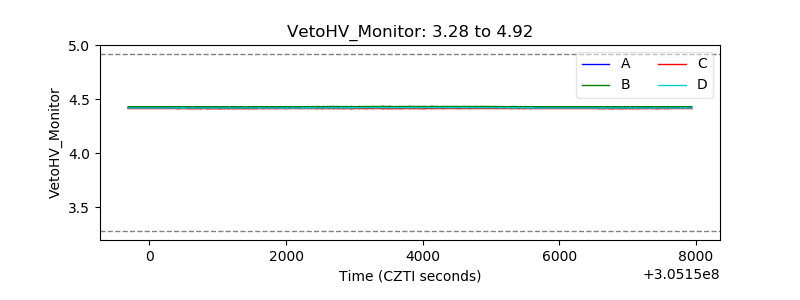 |
| Veto LLD | 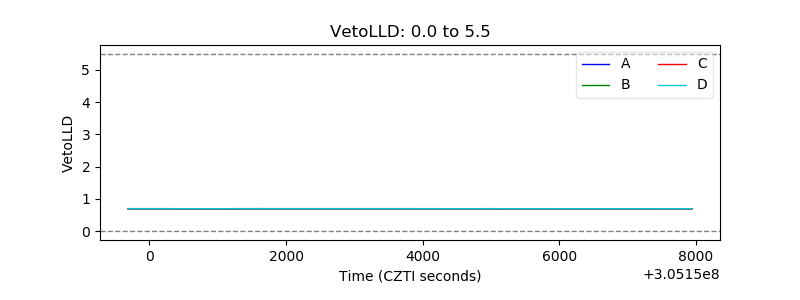 |
| Alpha Counter |  |
| _CPM_Rate | 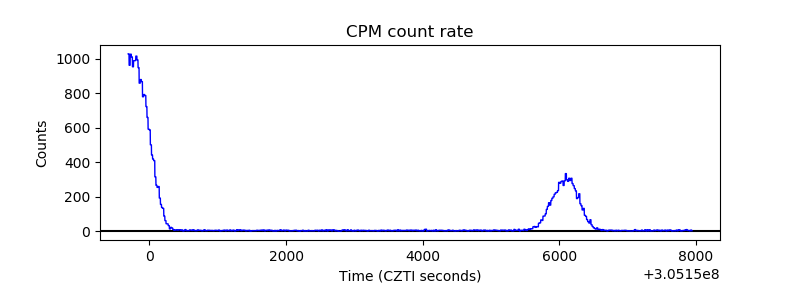 |
| CZT Counter | 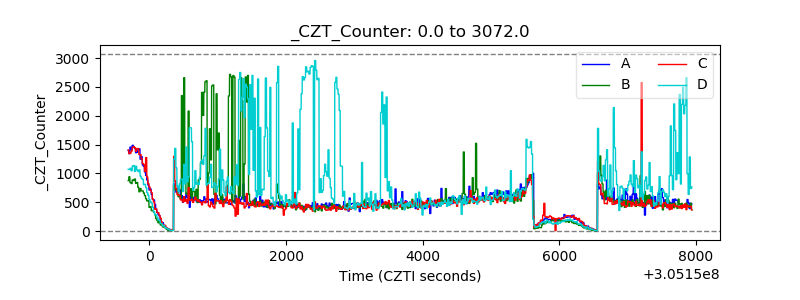 |
| +2.5 Volts monitor |  |
| +5 Volts monitor |  |
| _ROLL_ROT | 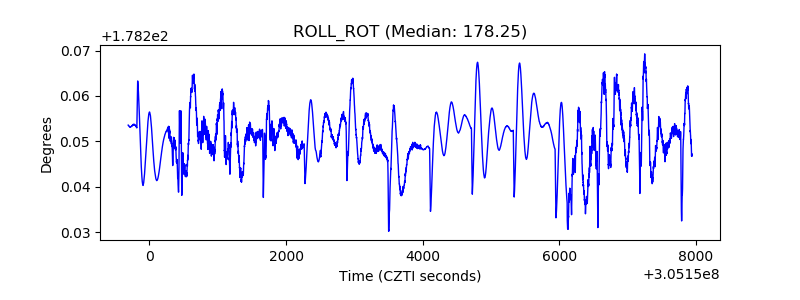 |
| _Roll_DEC | 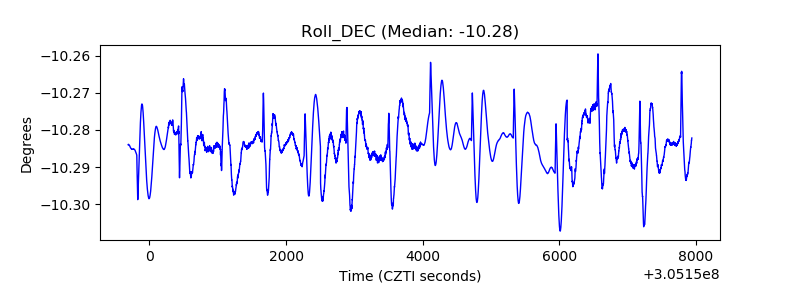 |
| _Roll_RA | 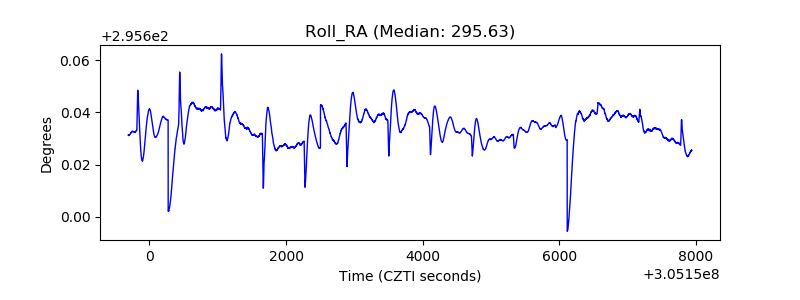 |
| Veto Counter | 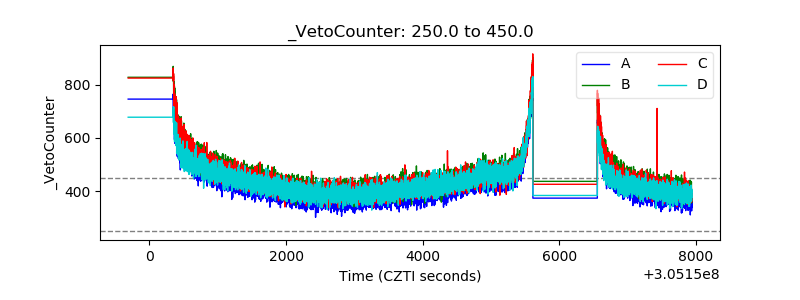 |