| Param | Original file | Final file |
|---|---|---|
| Filename | modeM0/AS1A05_037T01_9000003140_21253cztM0_level2.evt | modeM0/AS1A05_037T01_9000003140_21253cztM0_level2_quad_clean.evt |
| Size (bytes) | 561,945,600 | 101,016,000 |
| Size | 535.9 MB | 96.3 MB |
| Events in quadrant A | 3,635,560 | 641,959 |
| Events in quadrant B | 3,702,119 | 652,345 |
| Events in quadrant C | 3,559,777 | 635,272 |
| Events in quadrant D | 5,609,089 | 604,294 |
| Mode M9 | |||
|---|---|---|---|
| Quadrant | BADHDUFLAG | Total packets | Discarded packets |
| A | 0 | 5 | 0 |
| B | 0 | 6 | 0 |
| C | 0 | 6 | 0 |
| D | 0 | 6 | 0 |
| Mode M0 | |||
|---|---|---|---|
| Quadrant | BADHDUFLAG | Total packets | Discarded packets |
| A | 0 | 15675 | 2 |
| B | 0 | 15926 | 2 |
| C | 0 | 15498 | 2 |
| D | 0 | 21732 | 2 |
| Mode SS | |||
|---|---|---|---|
| Quadrant | BADHDUFLAG | Total packets | Discarded packets |
| A | 0 | 154 | 0 |
| B | 0 | 154 | 0 |
| C | 0 | 154 | 0 |
| D | 0 | 154 | 0 |
| Quadrant | Total seconds | Saturated seconds | Saturation percentage |
|---|---|---|---|
| A | 7546 | 60 | 0.795123% |
| B | 7546 | 82 | 1.086668% |
| C | 7546 | 88 | 1.166181% |
| D | 7546 | 321 | 4.253909% |
Noise dominated data is calculated using 1-second bins in cleaned event files. If a bin has >2000 counts, and if more than 50% of those come from <1% of pixels, then it is considered to be noise-dominated and hence unusable.
| Quadrant | # 1 sec bins | Bins with >0 counts | Bins with >2000 counts | High rate bins dominated by noise | Noise dominated (total time) | Noise dominated (detector-on time) | Marked lightcurve |
|---|---|---|---|---|---|---|---|
| A | 7781 | 7547 | 1 | 1 | 0.01% | 0.01% | 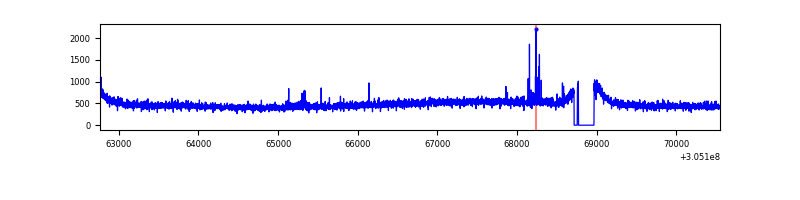 |
| B | 7781 | 7548 | 2 | 2 | 0.03% | 0.03% | 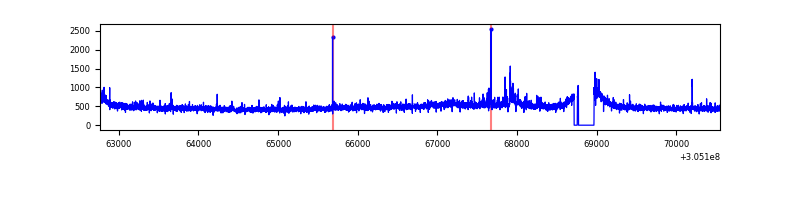 |
| C | 7781 | 7548 | 0 | 0 | 0.00% | 0.00% | 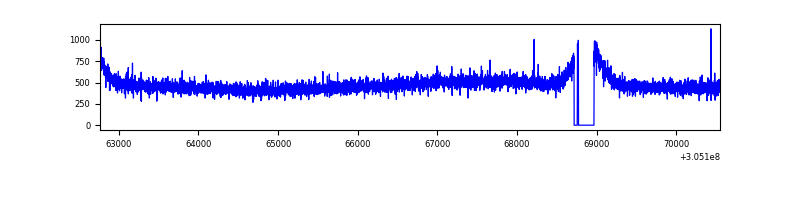 |
| D | 7781 | 7548 | 234 | 234 | 3.01% | 3.10% | 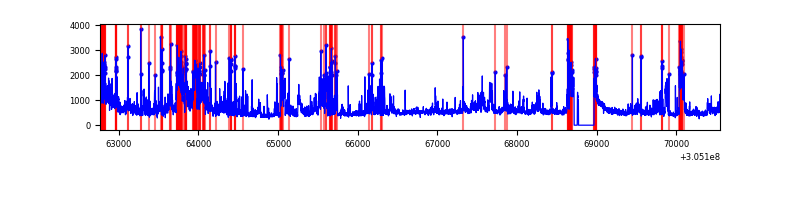 |
Top three noisy pixels from each quadrant. If the there are fewer than three noisy pixels in the level2.evt file, extra rows are filled as -1
| Pixel properties | Quadrant properties | ||||||
|---|---|---|---|---|---|---|---|
| Quadrant | DetID | PixID | Counts | Sigma | Mean | Median | Sigma |
| A | 15 | 236 | 65494 | 349.24 | 914 | 895 | 185.0 |
| A | 5 | 16 | 23561 | 122.54 | 914 | 895 | 185.0 |
| A | 13 | 254 | 12399 | 62.19 | 914 | 895 | 185.0 |
| B | 0 | 245 | 51305 | 284.38 | 915 | 892 | 177.3 |
| B | 0 | 230 | 24144 | 131.17 | 915 | 892 | 177.3 |
| B | 12 | 111 | 20707 | 111.78 | 915 | 892 | 177.3 |
| C | 14 | 238 | 136062 | 661.03 | 874 | 877 | 204.5 |
| C | 8 | 128 | 6337 | 26.7 | 874 | 877 | 204.5 |
| C | 13 | 61 | 6152 | 25.79 | 874 | 877 | 204.5 |
| D | 13 | 174 | 1347534 | 6281.46 | 874 | 850 | 214.4 |
| D | 1 | 20 | 200437 | 930.95 | 874 | 850 | 214.4 |
| D | 13 | 153 | 152235 | 706.12 | 874 | 850 | 214.4 |
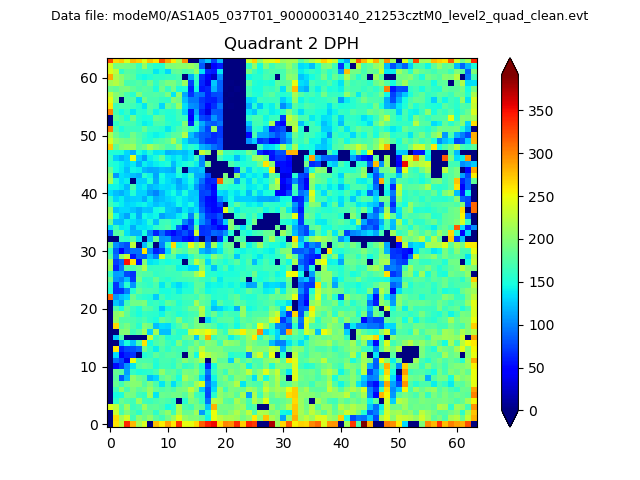
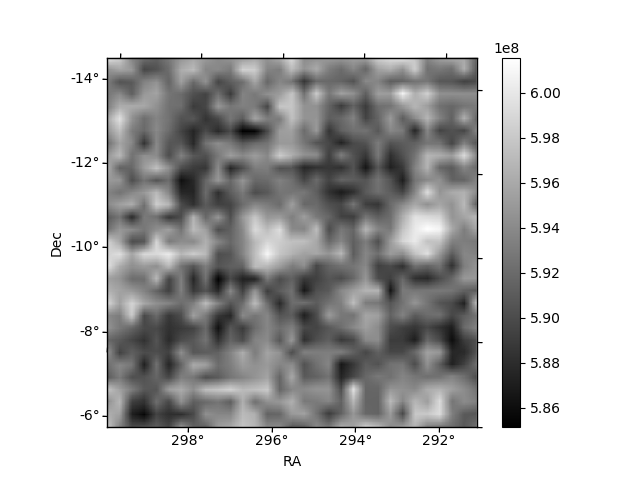
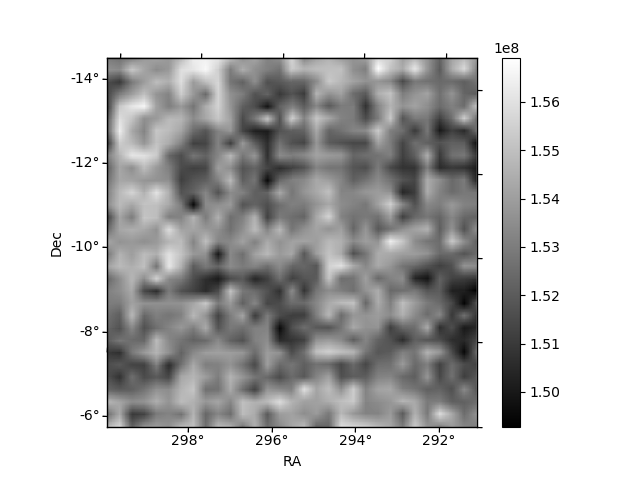
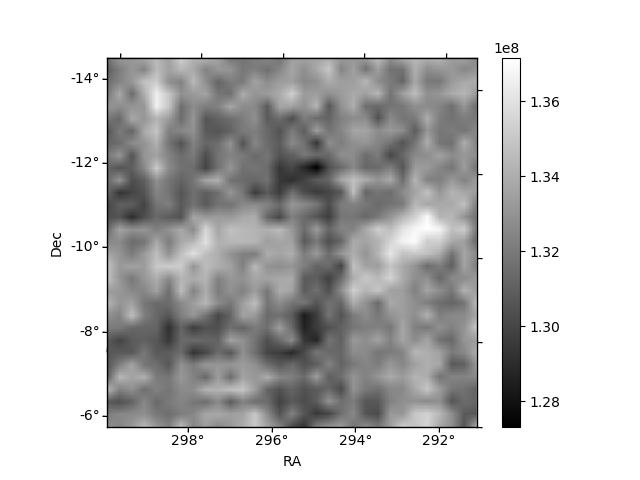
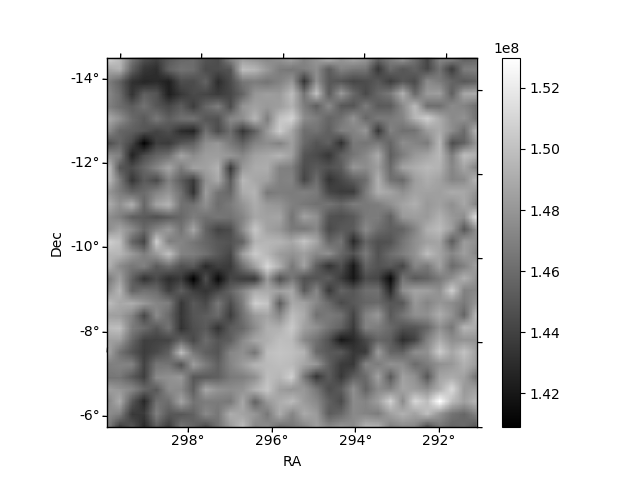
Histogram calculated using DETX and DETY for each event in the final _common_clean file
| Quadrant A | 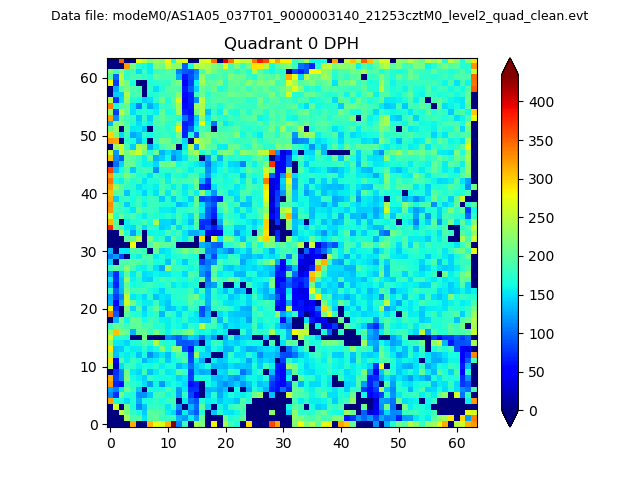 |
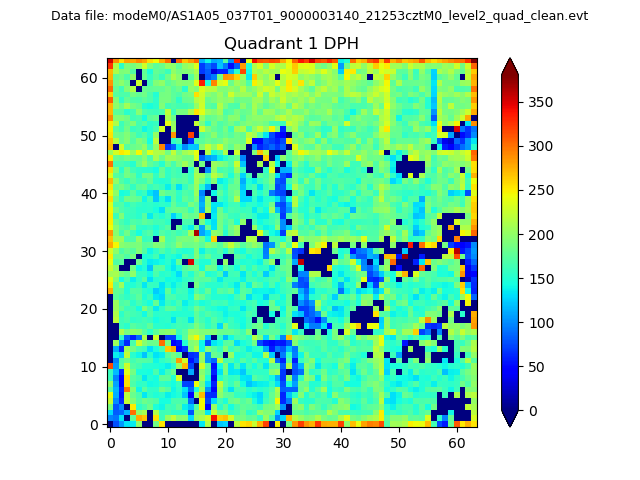 |
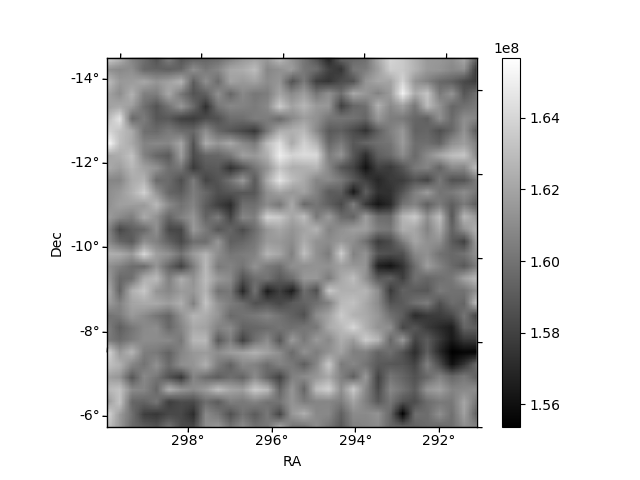
Quadrant B |
|---|---|---|---|
| Quadrant D | 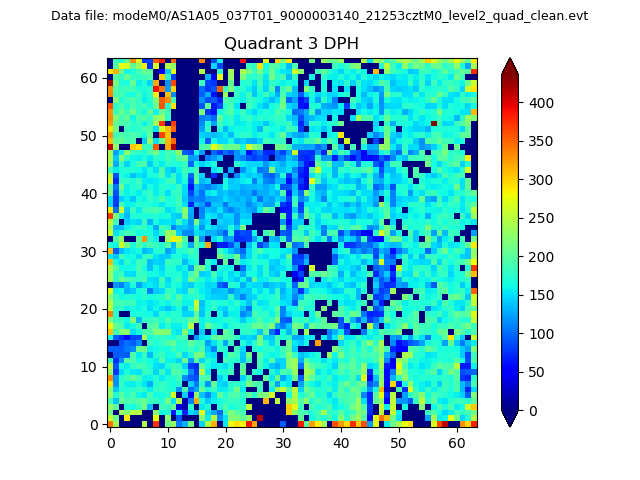 |
 |
Quadrant C |
| Plot type | Count rate plots | Images |
|---|---|---|
| Comparison with Poisson distribution Blue bars denote a histogram of data divided into 1 sec bins. Red curve is a Poisson curve with rate = median count rate of data. |
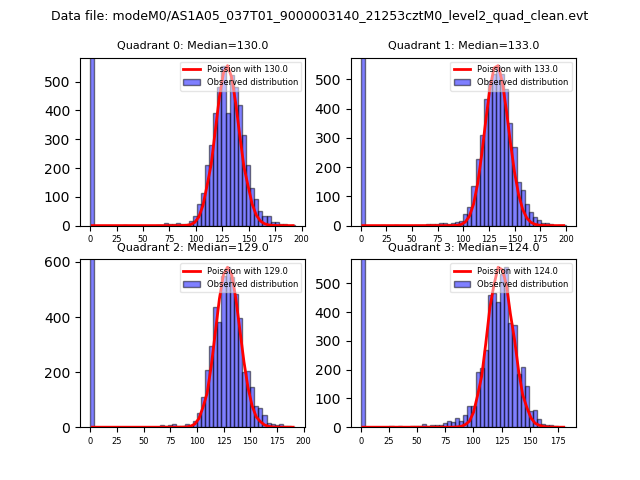 |
 |
| Quadrant-wise count rates Data is divided into 100 sec bins |
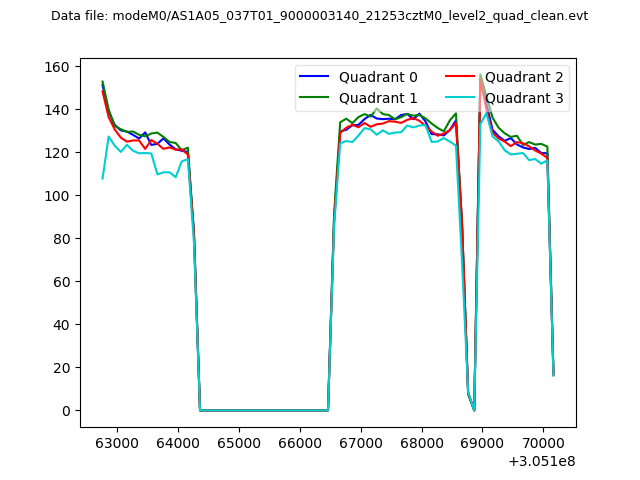 |
|
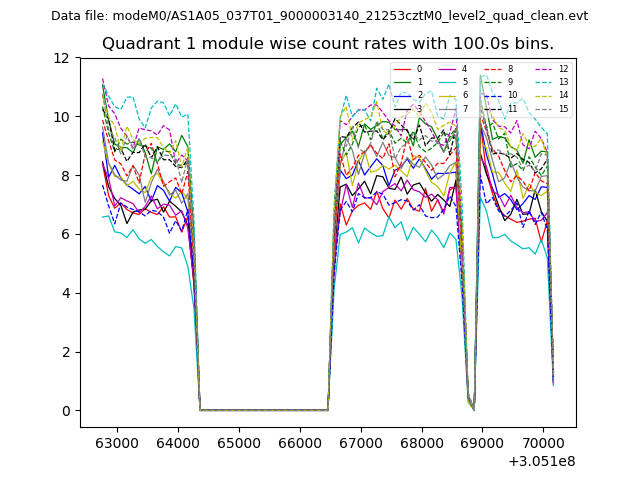
| Module-wise count rates for Quadrant A Data is divided into 100 sec bins |
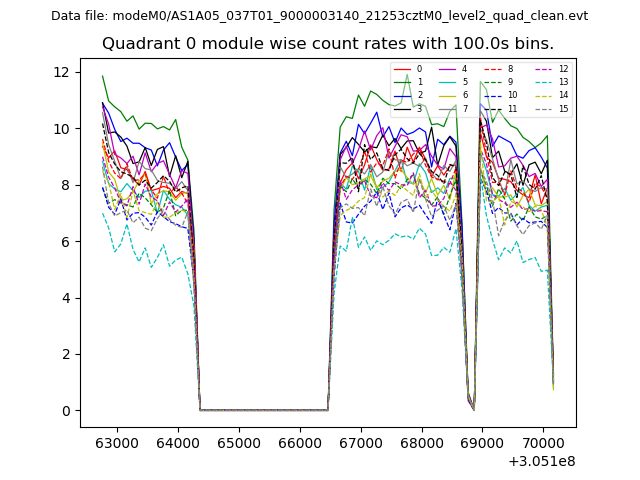 |
 |
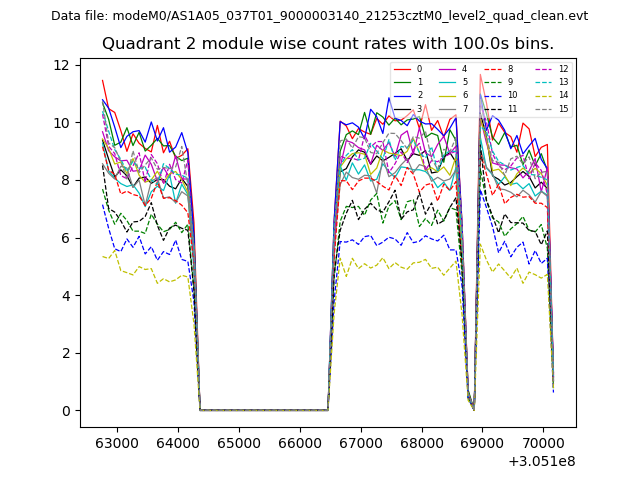
| Module-wise count rates for Quadrant B Data is divided into 100 sec bins |
 |
 |
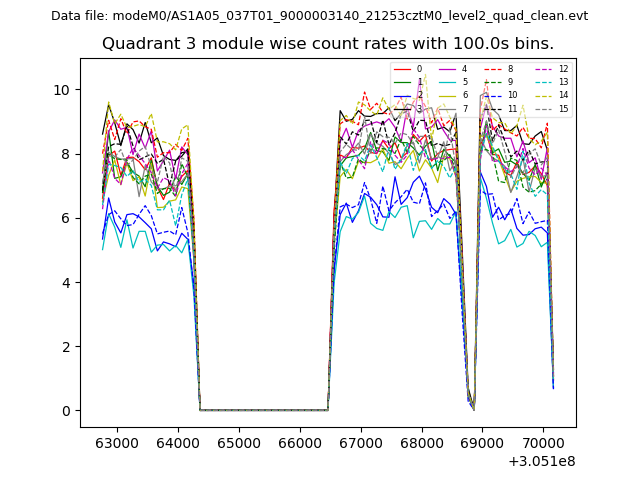
| Module-wise count rates for Quadrant C Data is divided into 100 sec bins |
 |
 |
| Module-wise count rates for Quadrant D Data is divided into 100 sec bins |
 |
 |
| Parameter | Plot |
|---|---|
| CZT HV Monitor | 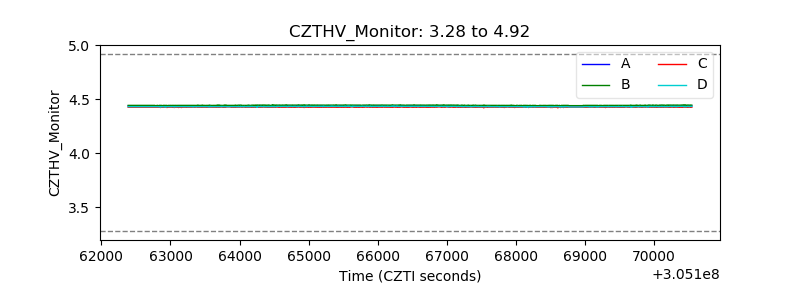 |
| D_VDD | 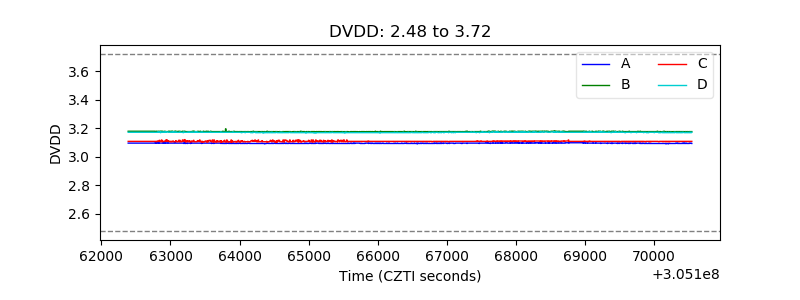 |
| Temperature 1 | 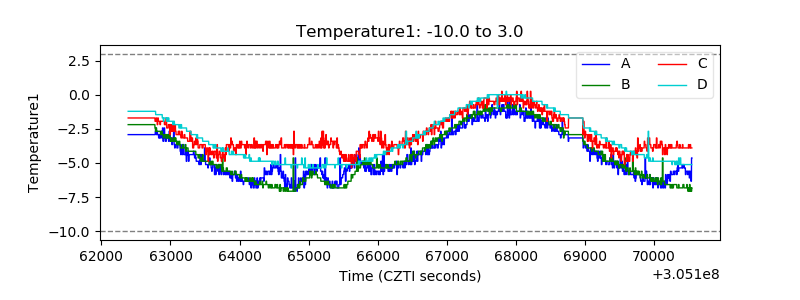 |
| Veto HV Monitor | 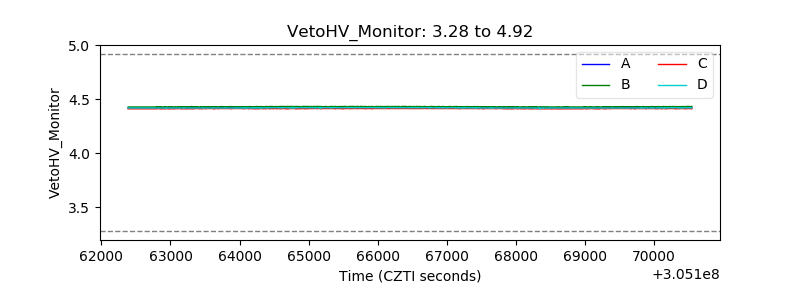 |
| Veto LLD | 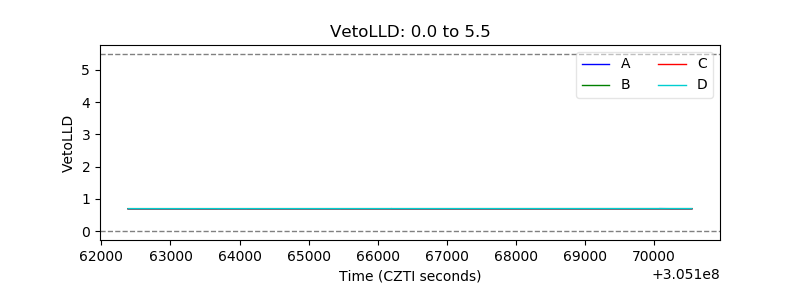 |
| Alpha Counter | 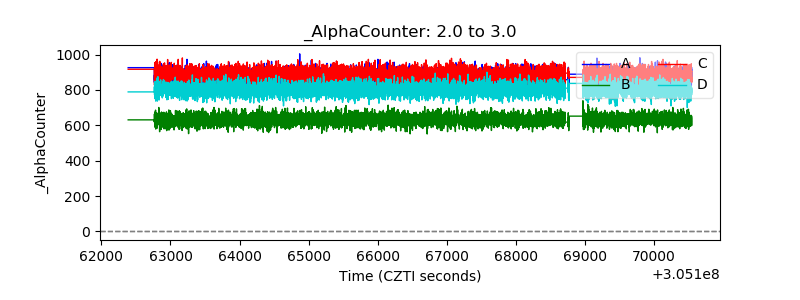 |
| _CPM_Rate | 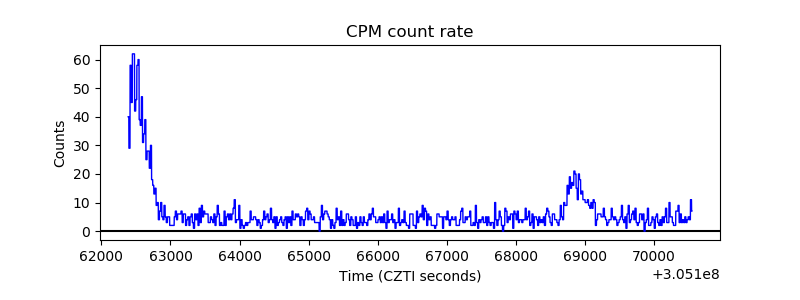 |
| CZT Counter |  |
| +2.5 Volts monitor |  |
| +5 Volts monitor |  |
| _ROLL_ROT | 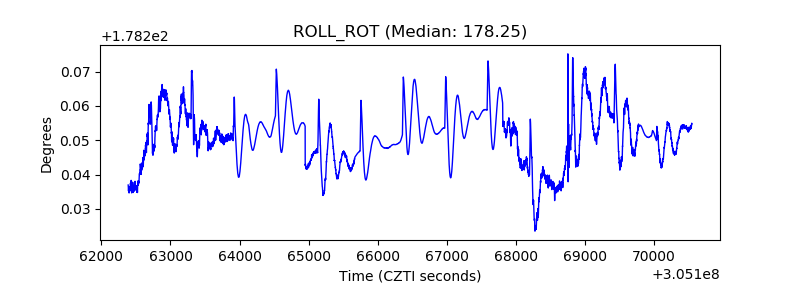 |
| _Roll_DEC | 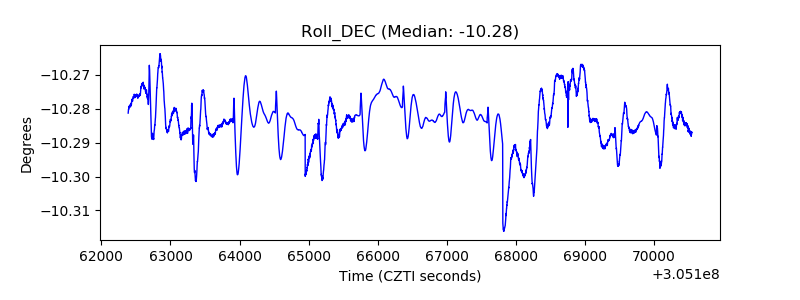 |
| _Roll_RA |  |
| Veto Counter | 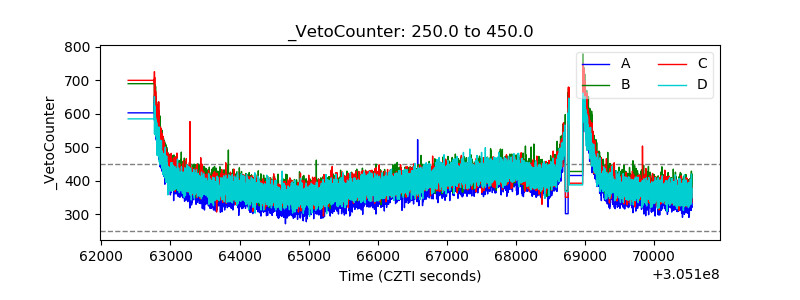 |