| Param | Original file | Final file |
|---|---|---|
| Filename | modeM0/AS1A05_037T01_9000003140_21254cztM0_level2.evt | modeM0/AS1A05_037T01_9000003140_21254cztM0_level2_quad_clean.evt |
| Size (bytes) | 640,399,680 | 115,390,080 |
| Size | 610.7 MB | 110.0 MB |
| Events in quadrant A | 4,309,694 | 728,864 |
| Events in quadrant B | 4,434,700 | 743,531 |
| Events in quadrant C | 4,199,745 | 724,971 |
| Events in quadrant D | 5,863,611 | 695,988 |
| Mode M9 | |||
|---|---|---|---|
| Quadrant | BADHDUFLAG | Total packets | Discarded packets |
| A | 0 | 5 | 0 |
| B | 0 | 5 | 0 |
| C | 0 | 5 | 0 |
| D | 0 | 5 | 0 |
| Mode M0 | |||
|---|---|---|---|
| Quadrant | BADHDUFLAG | Total packets | Discarded packets |
| A | 0 | 18260 | 2 |
| B | 0 | 18825 | 2 |
| C | 0 | 18067 | 2 |
| D | 0 | 23280 | 4 |
| Mode SS | |||
|---|---|---|---|
| Quadrant | BADHDUFLAG | Total packets | Discarded packets |
| A | 0 | 178 | 0 |
| B | 0 | 178 | 0 |
| C | 0 | 178 | 0 |
| D | 0 | 178 | 0 |
| Quadrant | Total seconds | Saturated seconds | Saturation percentage |
|---|---|---|---|
| A | 8656 | 101 | 1.166821% |
| B | 8656 | 166 | 1.917745% |
| C | 8656 | 149 | 1.721349% |
| D | 8655 | 232 | 2.680531% |
Noise dominated data is calculated using 1-second bins in cleaned event files. If a bin has >2000 counts, and if more than 50% of those come from <1% of pixels, then it is considered to be noise-dominated and hence unusable.
| Quadrant | # 1 sec bins | Bins with >0 counts | Bins with >2000 counts | High rate bins dominated by noise | Noise dominated (total time) | Noise dominated (detector-on time) | Marked lightcurve |
|---|---|---|---|---|---|---|---|
| A | 9167 | 8657 | 11 | 11 | 0.12% | 0.13% | 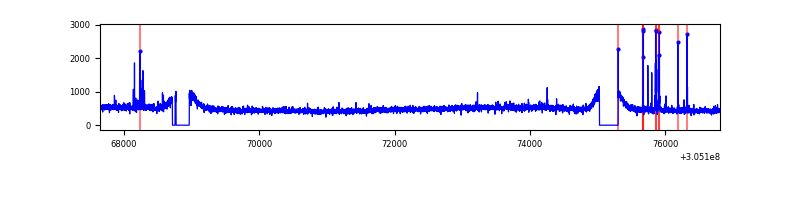 |
| B | 9167 | 8659 | 19 | 19 | 0.21% | 0.22% | 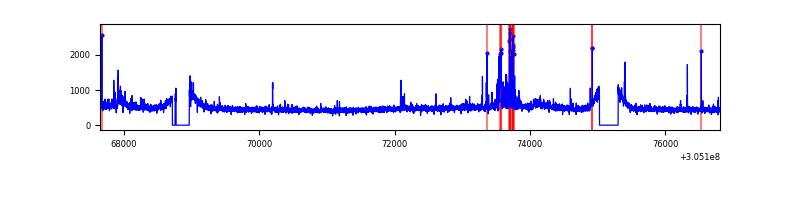 |
| C | 9167 | 8659 | 8 | 8 | 0.09% | 0.09% | 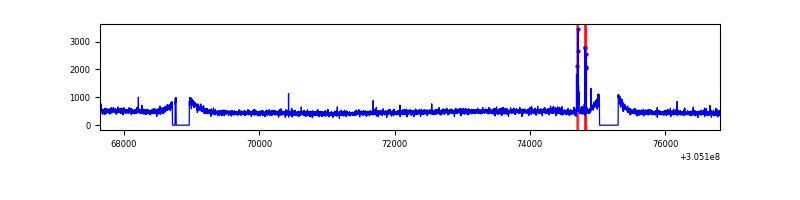 |
| D | 9166 | 8657 | 103 | 103 | 1.12% | 1.19% | 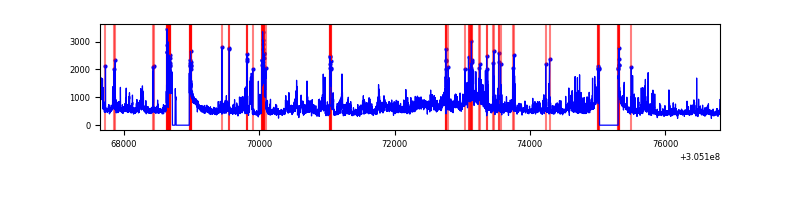 |
Top three noisy pixels from each quadrant. If the there are fewer than three noisy pixels in the level2.evt file, extra rows are filled as -1
| Pixel properties | Quadrant properties | ||||||
|---|---|---|---|---|---|---|---|
| Quadrant | DetID | PixID | Counts | Sigma | Mean | Median | Sigma |
| A | 15 | 236 | 102088 | 467.0 | 1064 | 1041 | 216.4 |
| A | 5 | 16 | 71094 | 323.76 | 1064 | 1041 | 216.4 |
| A | 13 | 254 | 13847 | 59.18 | 1064 | 1041 | 216.4 |
| B | 0 | 245 | 159060 | 769.46 | 1063 | 1034 | 205.4 |
| B | 3 | 64 | 30722 | 144.56 | 1063 | 1034 | 205.4 |
| B | 12 | 111 | 24511 | 114.31 | 1063 | 1034 | 205.4 |
| C | 14 | 238 | 157664 | 652.14 | 1021 | 1028 | 240.2 |
| C | 0 | 207 | 49807 | 203.09 | 1021 | 1028 | 240.2 |
| C | 13 | 61 | 7231 | 25.83 | 1021 | 1028 | 240.2 |
| D | 13 | 174 | 1003976 | 3994.37 | 1024 | 993 | 251.1 |
| D | 1 | 20 | 167957 | 664.93 | 1024 | 993 | 251.1 |
| D | 12 | 235 | 159292 | 630.42 | 1024 | 993 | 251.1 |
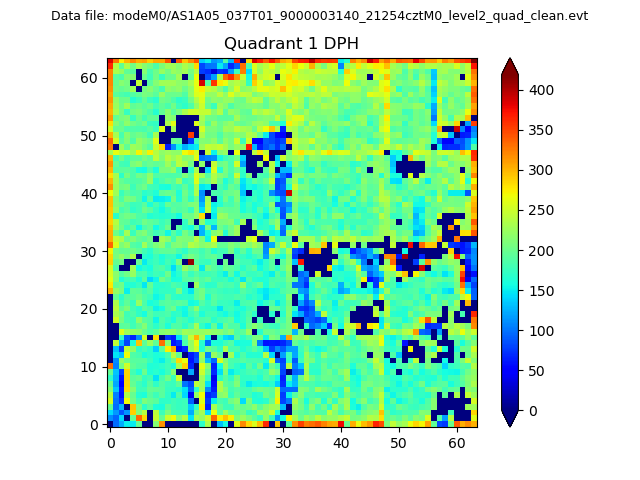
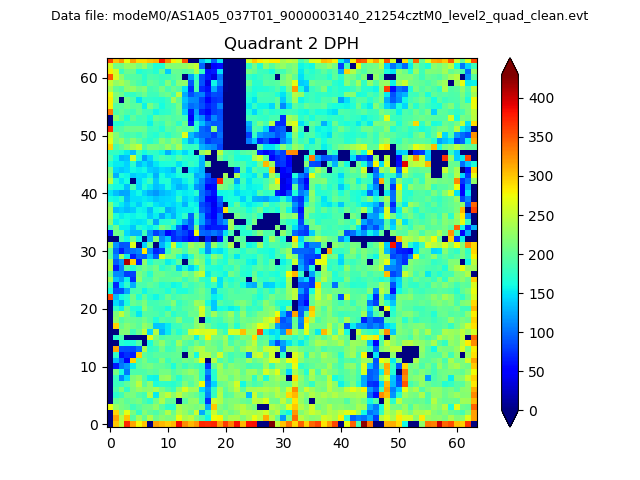
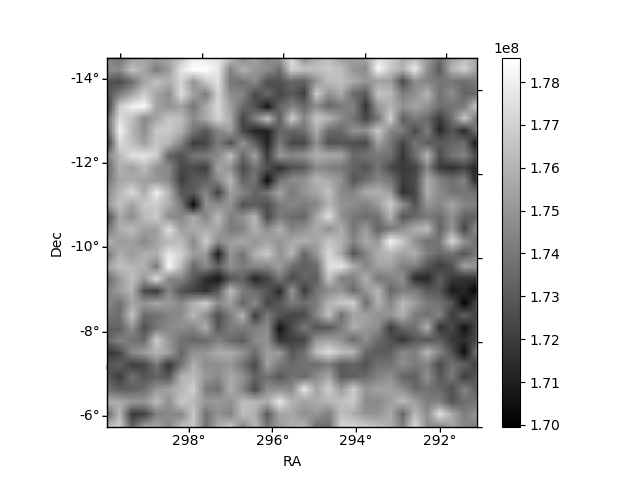
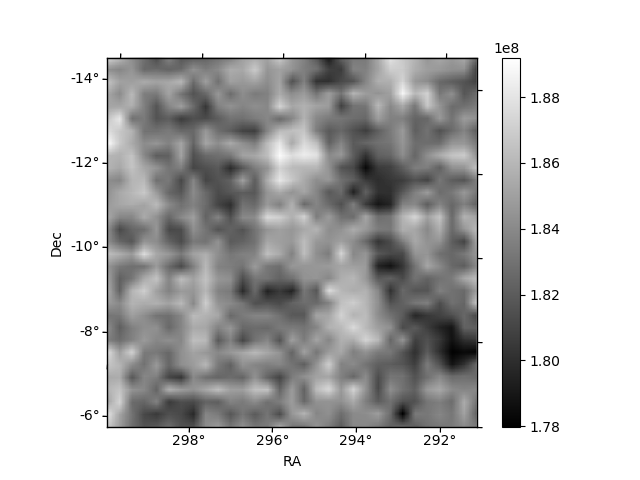
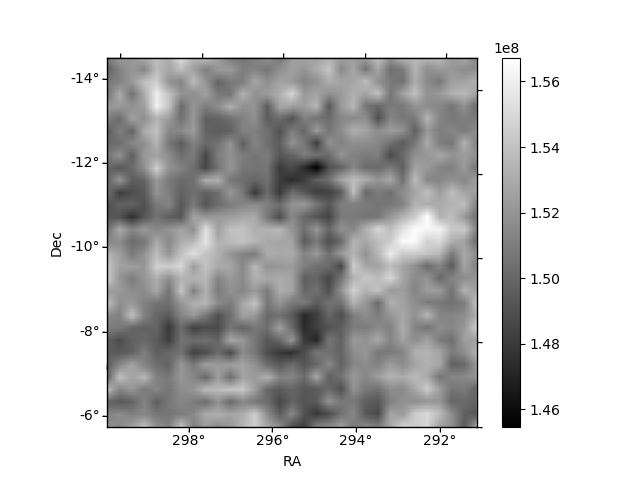
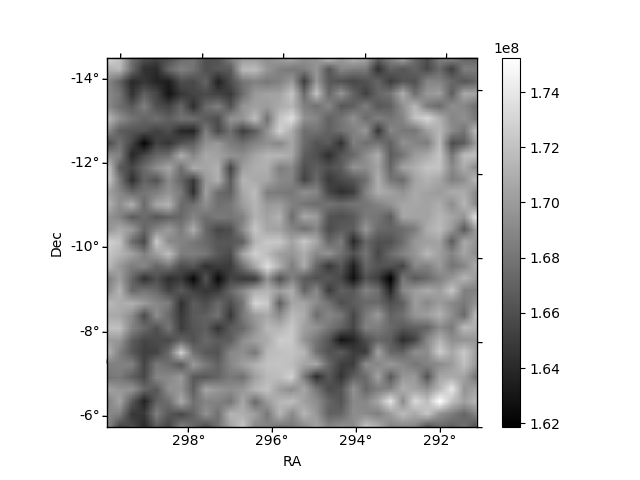
Histogram calculated using DETX and DETY for each event in the final _common_clean file
| Quadrant A |  |
 |
Quadrant B |
|---|---|---|---|
| Quadrant D |  |
 |
Quadrant C |
| Plot type | Count rate plots | Images |
|---|---|---|
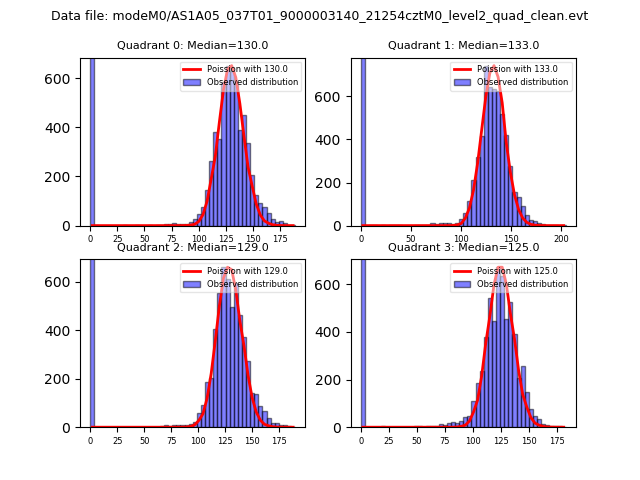
| Comparison with Poisson distribution Blue bars denote a histogram of data divided into 1 sec bins. Red curve is a Poisson curve with rate = median count rate of data. |
 |
 |
| Quadrant-wise count rates Data is divided into 100 sec bins |
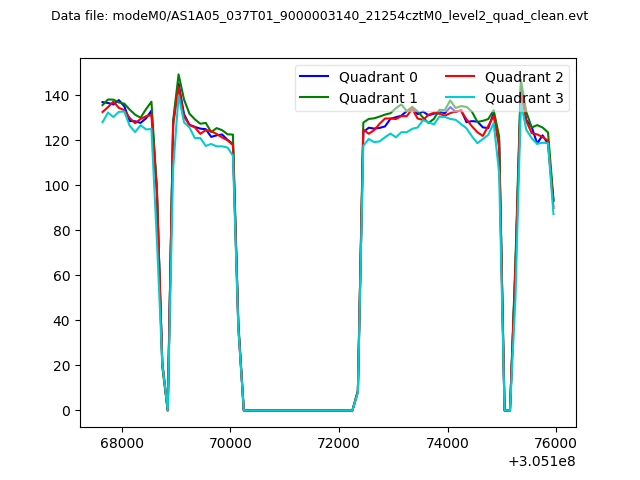 |
|
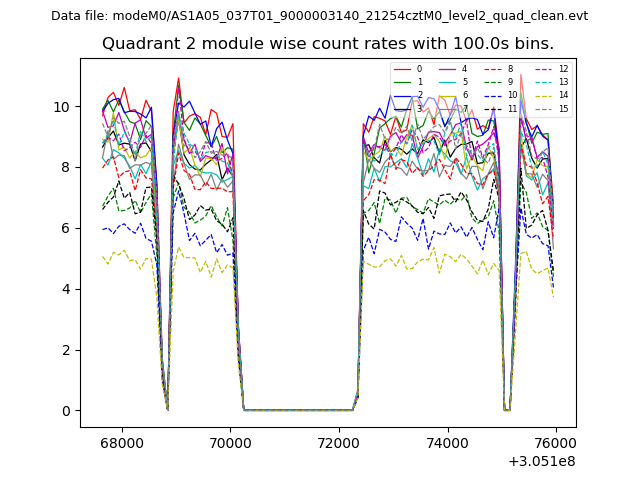
| Module-wise count rates for Quadrant A Data is divided into 100 sec bins |
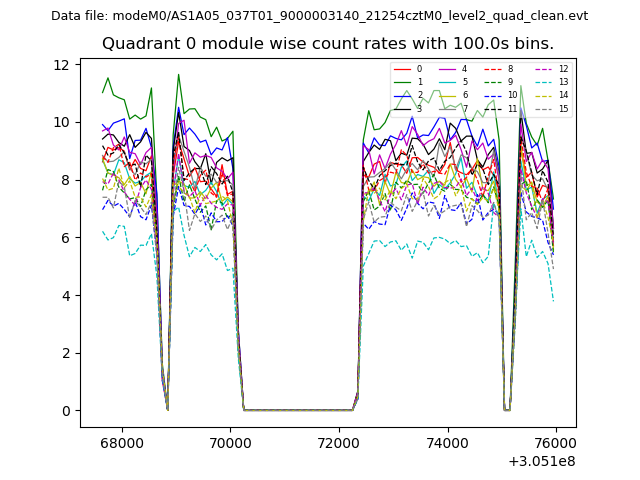 |
 |
| Module-wise count rates for Quadrant B Data is divided into 100 sec bins |
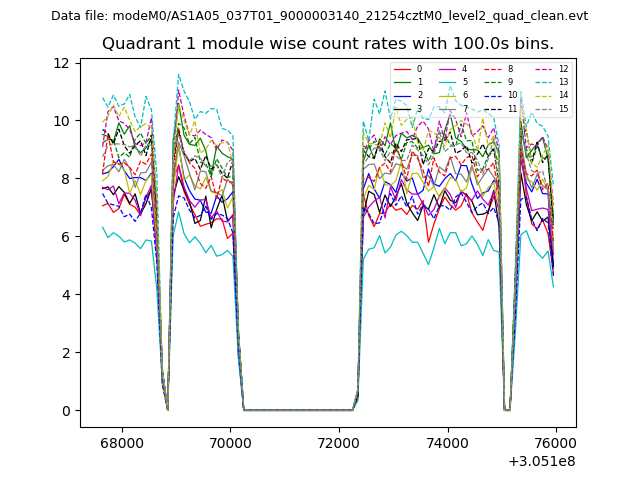 |
 |
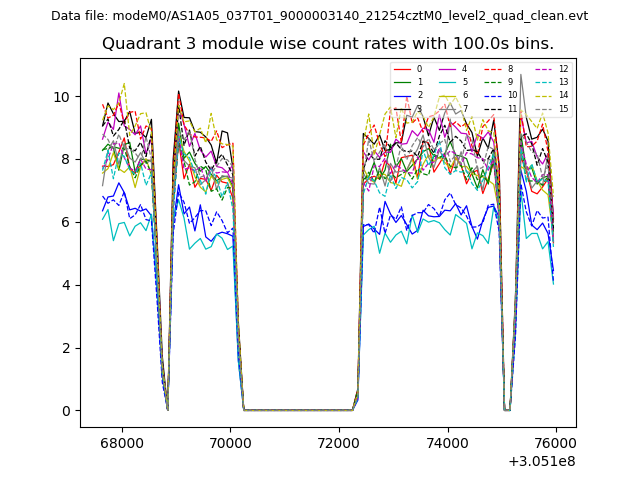
| Module-wise count rates for Quadrant C Data is divided into 100 sec bins |
 |
 |
| Module-wise count rates for Quadrant D Data is divided into 100 sec bins |
 |
 |
| Parameter | Plot |
|---|---|
| CZT HV Monitor | 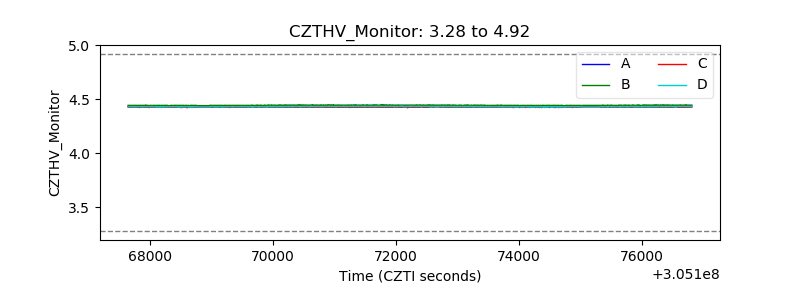 |
| D_VDD | 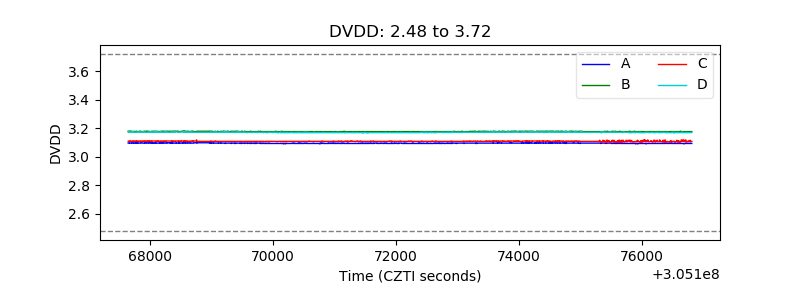 |
| Temperature 1 | 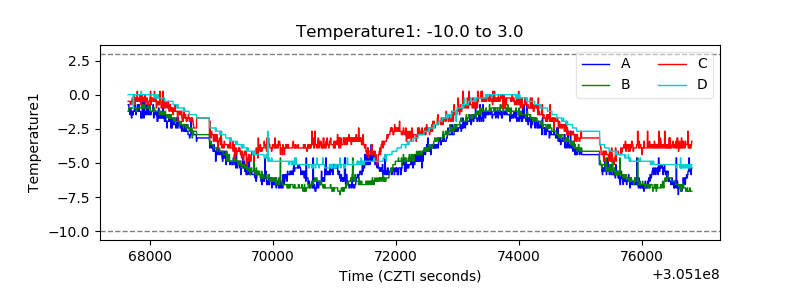 |
| Veto HV Monitor | 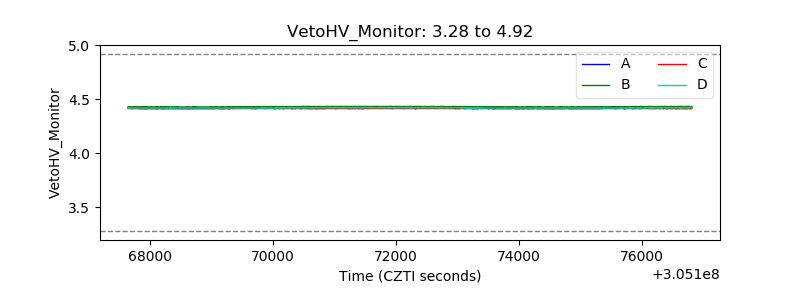 |
| Veto LLD | 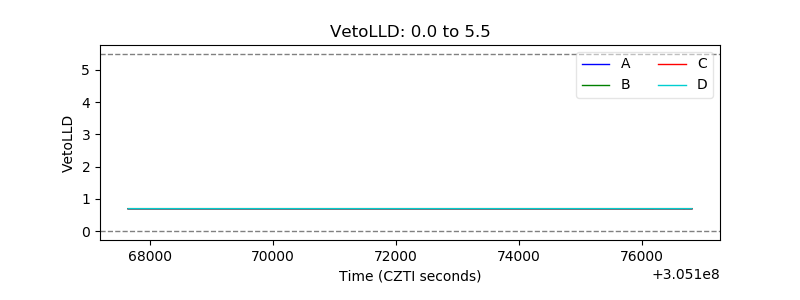 |
| Alpha Counter | 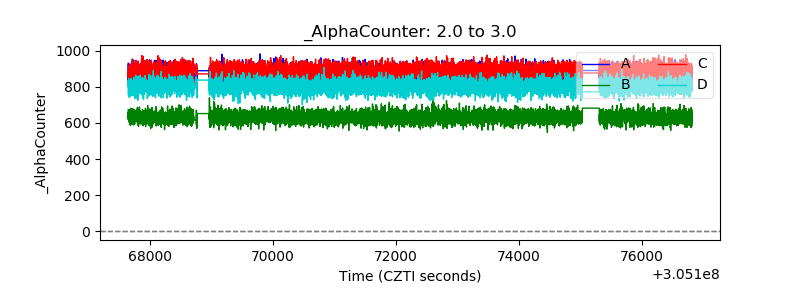 |
| _CPM_Rate | 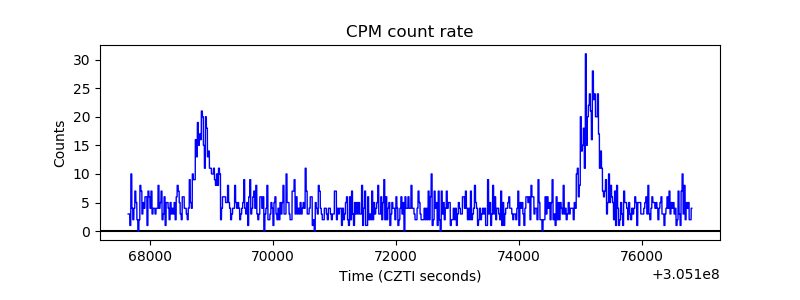 |
| CZT Counter | 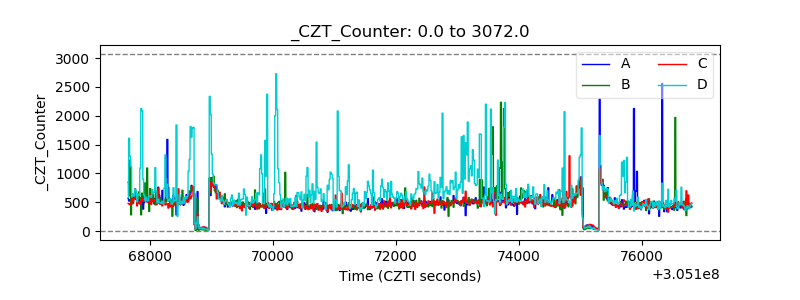 |
| +2.5 Volts monitor |  |
| +5 Volts monitor | 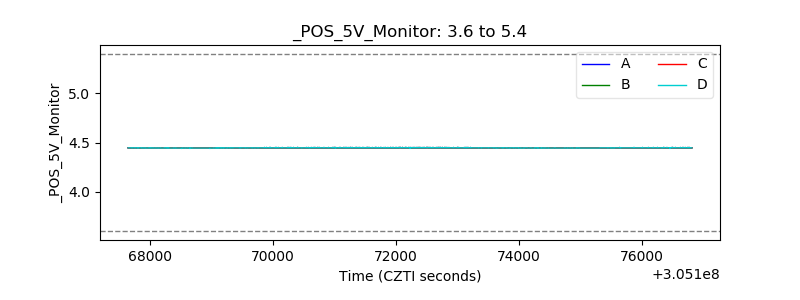 |
| _ROLL_ROT | 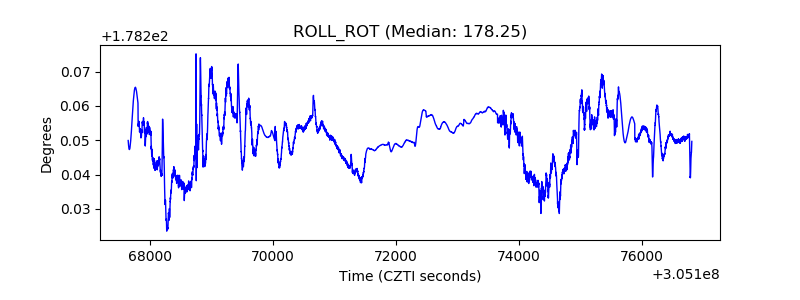 |
| _Roll_DEC | 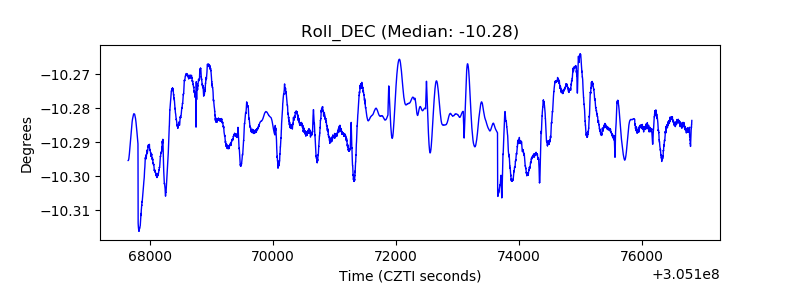 |
| _Roll_RA | 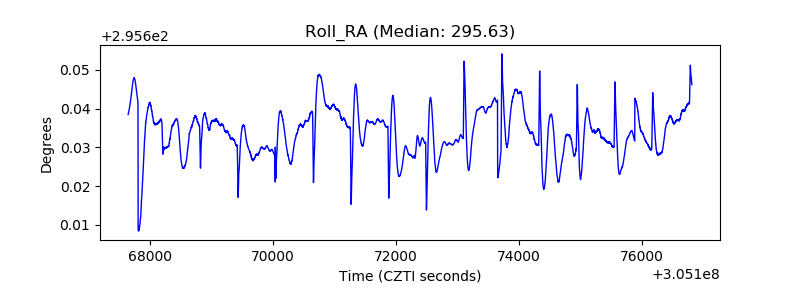 |
| Veto Counter | 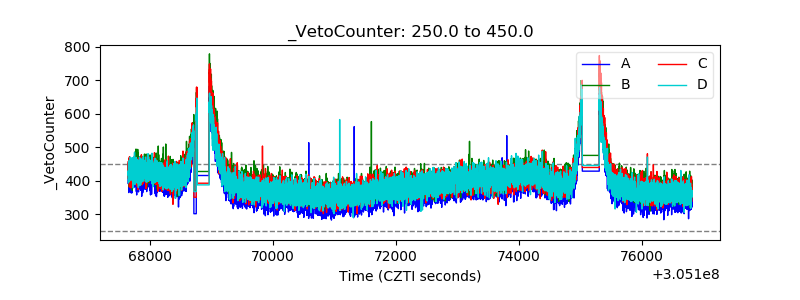 |