| Param | Original file | Final file |
|---|---|---|
| Filename | modeM0/AS1A05_037T01_9000003140_21257cztM0_level2.evt | modeM0/AS1A05_037T01_9000003140_21257cztM0_level2_quad_clean.evt |
| Size (bytes) | 1,467,146,880 | 227,332,800 |
| Size | 1.4 GB | 216.8 MB |
| Events in quadrant A | 10,007,419 | 1,401,058 |
| Events in quadrant B | 9,319,009 | 1,433,278 |
| Events in quadrant C | 9,207,042 | 1,404,690 |
| Events in quadrant D | 14,607,108 | 1,327,613 |
| Mode M9 | |||
|---|---|---|---|
| Quadrant | BADHDUFLAG | Total packets | Discarded packets |
| A | 0 | 21 | 0 |
| B | 0 | 21 | 0 |
| C | 0 | 21 | 0 |
| D | 0 | 21 | 0 |
| Mode M0 | |||
|---|---|---|---|
| Quadrant | BADHDUFLAG | Total packets | Discarded packets |
| A | 0 | 41691 | 5 |
| B | 0 | 39600 | 4 |
| C | 0 | 39438 | 4 |
| D | 0 | 56367 | 4 |
| Mode SS | |||
|---|---|---|---|
| Quadrant | BADHDUFLAG | Total packets | Discarded packets |
| A | 0 | 392 | 0 |
| B | 0 | 392 | 0 |
| C | 0 | 392 | 0 |
| D | 0 | 392 | 0 |
| Quadrant | Total seconds | Saturated seconds | Saturation percentage |
|---|---|---|---|
| A | 19132 | 246 | 1.285804% |
| B | 19132 | 213 | 1.113318% |
| C | 19132 | 256 | 1.338072% |
| D | 19132 | 1282 | 6.700815% |
Noise dominated data is calculated using 1-second bins in cleaned event files. If a bin has >2000 counts, and if more than 50% of those come from <1% of pixels, then it is considered to be noise-dominated and hence unusable.
| Quadrant | # 1 sec bins | Bins with >0 counts | Bins with >2000 counts | High rate bins dominated by noise | Noise dominated (total time) | Noise dominated (detector-on time) | Marked lightcurve |
|---|---|---|---|---|---|---|---|
| A | 21323 | 19133 | 60 | 60 | 0.28% | 0.31% | 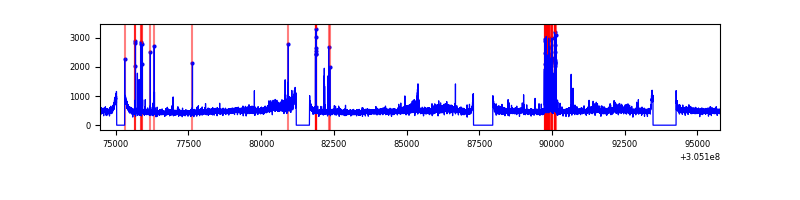 |
| B | 21323 | 19133 | 7 | 7 | 0.03% | 0.04% | 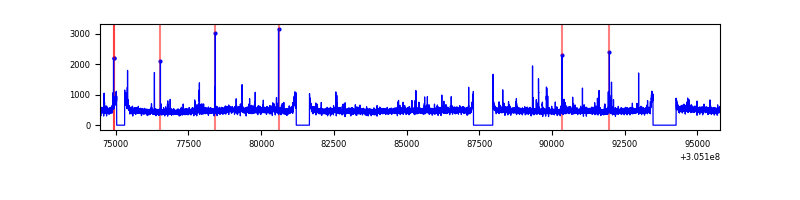 |
| C | 21323 | 19134 | 14 | 14 | 0.07% | 0.07% | 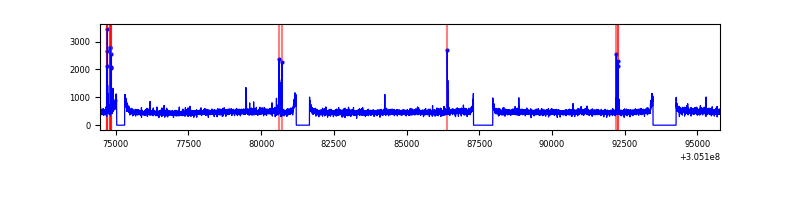 |
| D | 21323 | 19133 | 984 | 984 | 4.61% | 5.14% | 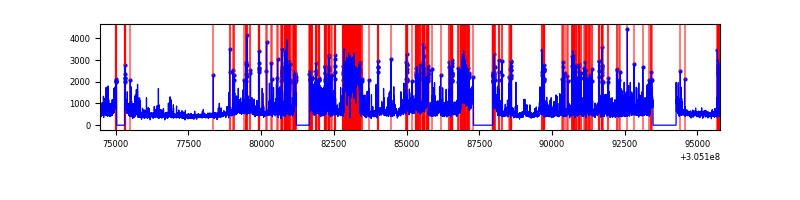 |
Top three noisy pixels from each quadrant. If the there are fewer than three noisy pixels in the level2.evt file, extra rows are filled as -1
| Pixel properties | Quadrant properties | ||||||
|---|---|---|---|---|---|---|---|
| Quadrant | DetID | PixID | Counts | Sigma | Mean | Median | Sigma |
| A | 15 | 236 | 452189 | 968.5 | 2316 | 2264 | 464.6 |
| A | 12 | 96 | 407390 | 872.06 | 2316 | 2264 | 464.6 |
| A | 3 | 247 | 125544 | 265.37 | 2316 | 2264 | 464.6 |
| B | 0 | 230 | 66011 | 142.82 | 2322 | 2266 | 446.3 |
| B | 12 | 111 | 54548 | 117.13 | 2322 | 2266 | 446.3 |
| B | 11 | 111 | 47042 | 100.32 | 2322 | 2266 | 446.3 |
| C | 14 | 238 | 347671 | 662.74 | 2229 | 2244 | 521.2 |
| C | 0 | 207 | 101484 | 190.4 | 2229 | 2244 | 521.2 |
| C | 3 | 233 | 35732 | 64.25 | 2229 | 2244 | 521.2 |
| D | 1 | 52 | 2429216 | 4502.63 | 2196 | 2136 | 539.0 |
| D | 13 | 174 | 1649361 | 3055.87 | 2196 | 2136 | 539.0 |
| D | 2 | 16 | 618939 | 1144.27 | 2196 | 2136 | 539.0 |
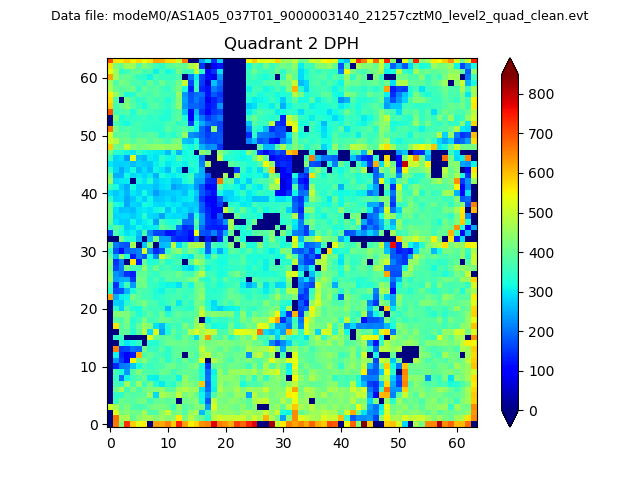
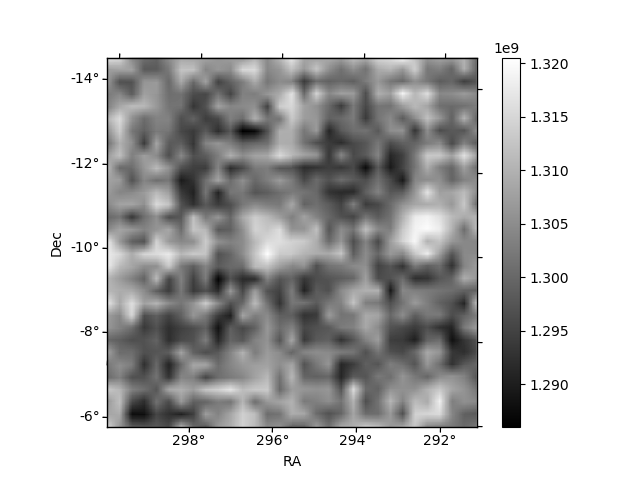
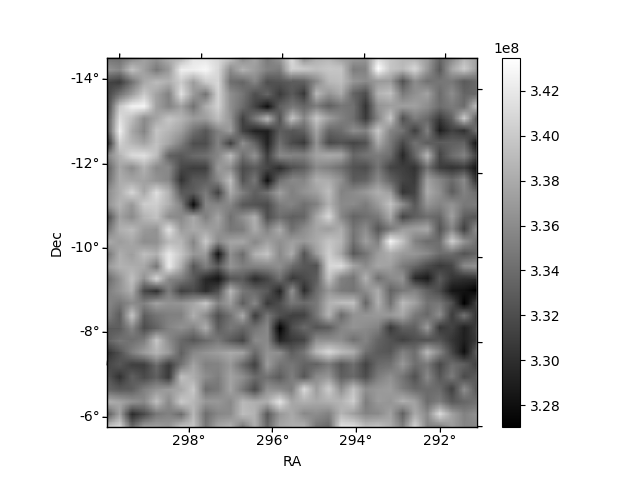
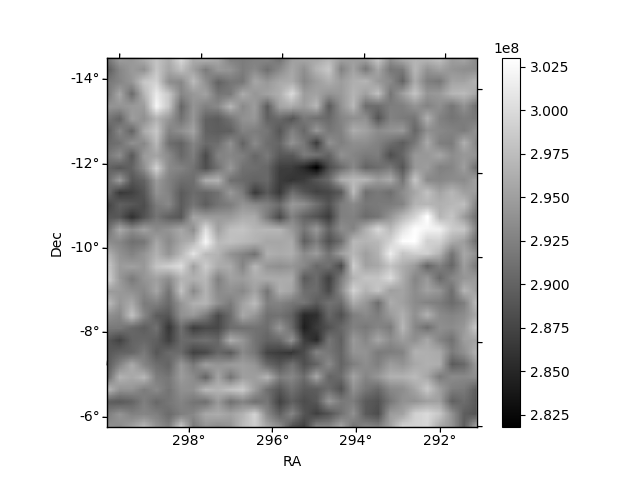
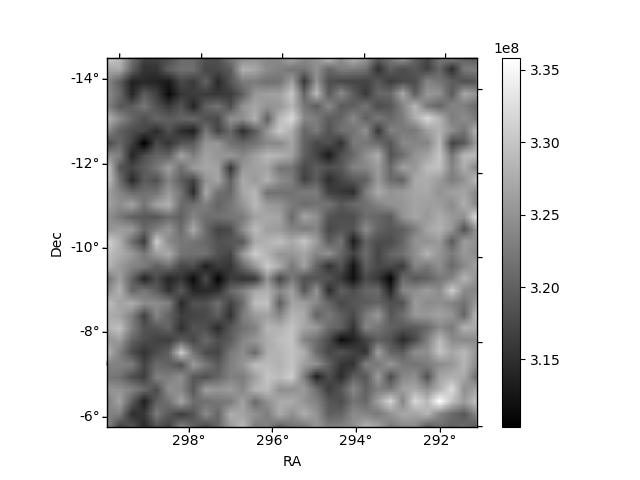
Histogram calculated using DETX and DETY for each event in the final _common_clean file
| Quadrant A | 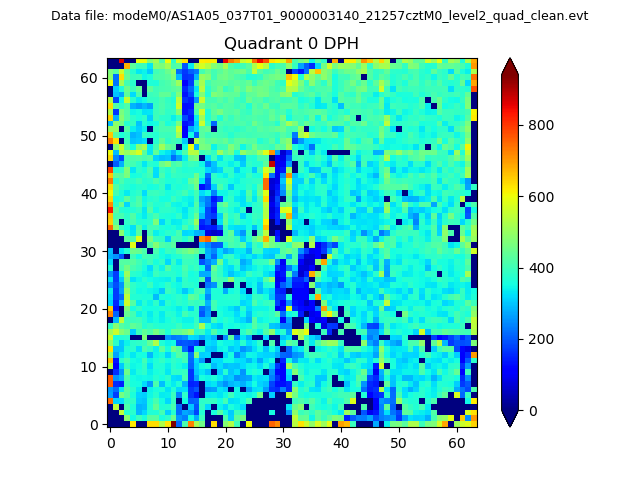 |
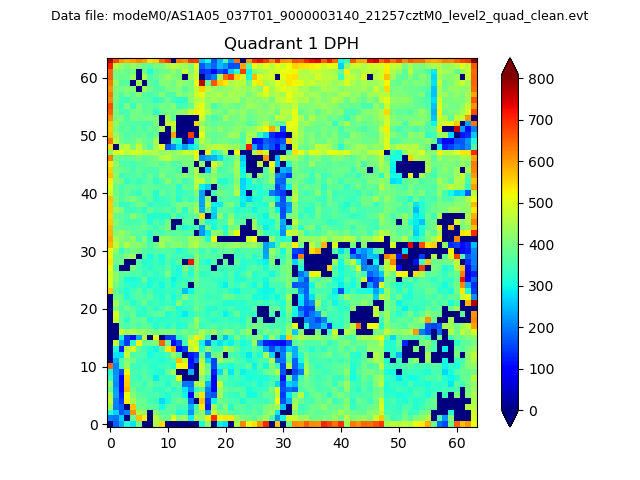 |
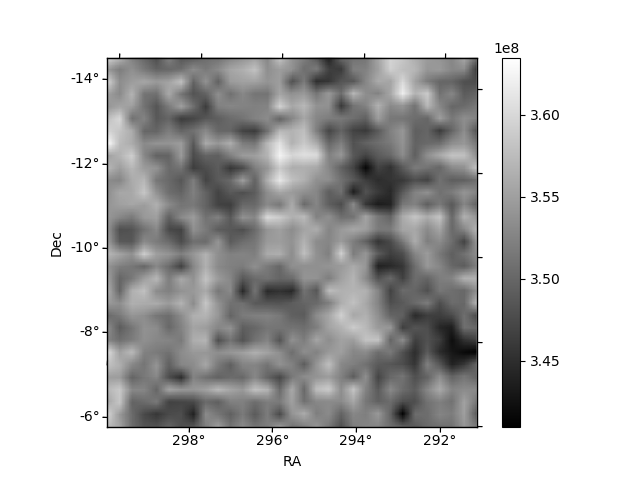
Quadrant B |
|---|---|---|---|
| Quadrant D | 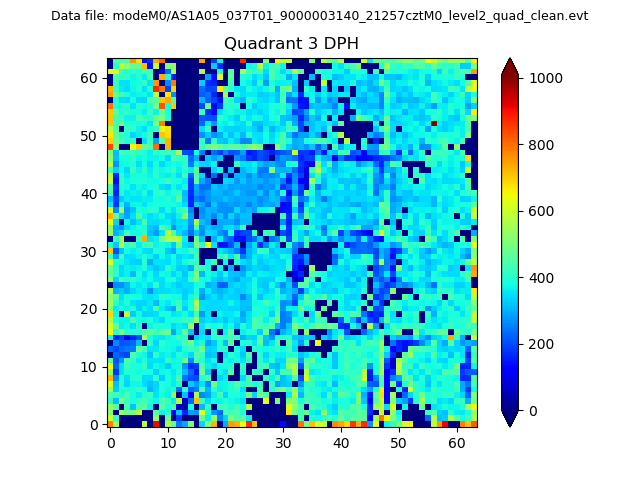 |
 |
Quadrant C |
| Plot type | Count rate plots | Images |
|---|---|---|
| Comparison with Poisson distribution Blue bars denote a histogram of data divided into 1 sec bins. Red curve is a Poisson curve with rate = median count rate of data. |
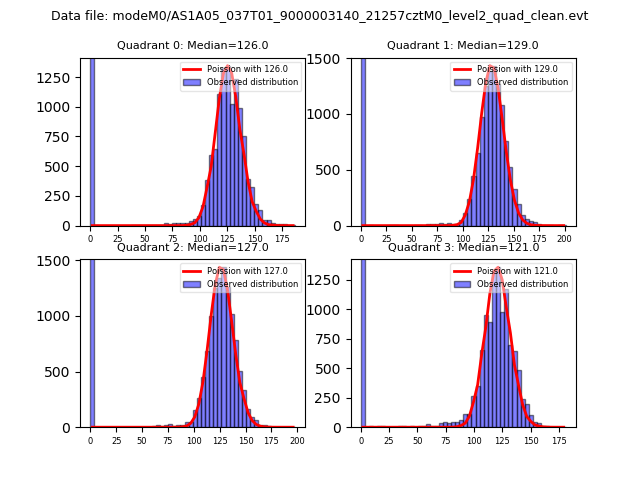 |
 |
| Quadrant-wise count rates Data is divided into 100 sec bins |
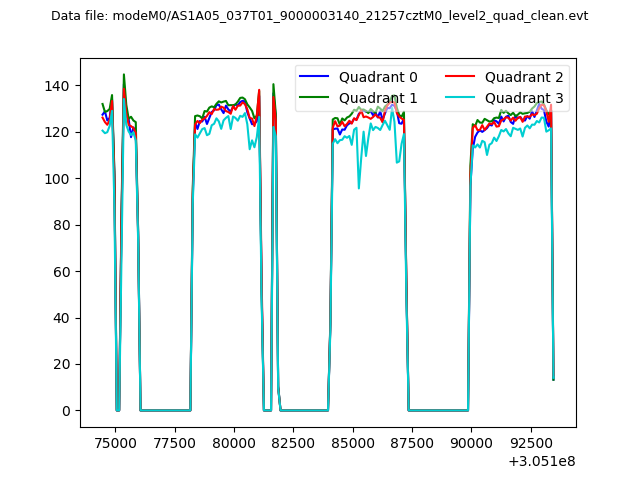 |
|
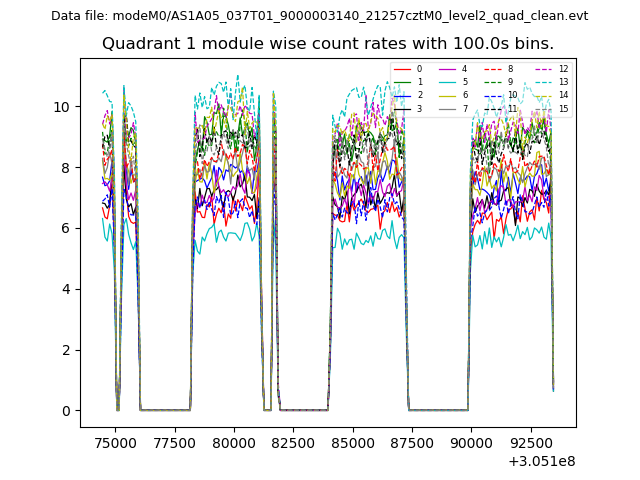
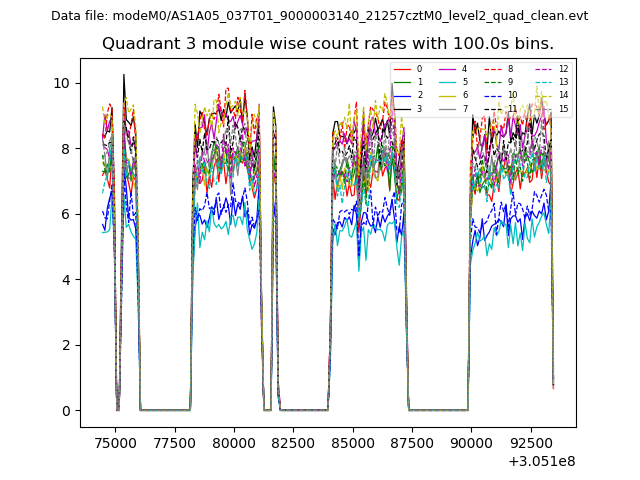
| Module-wise count rates for Quadrant A Data is divided into 100 sec bins |
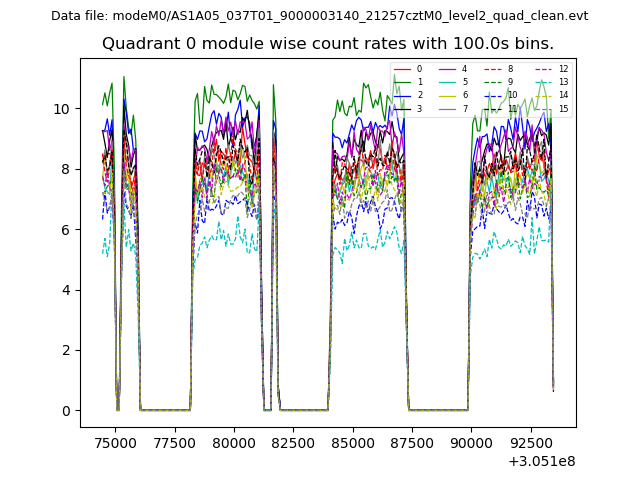 |
 |
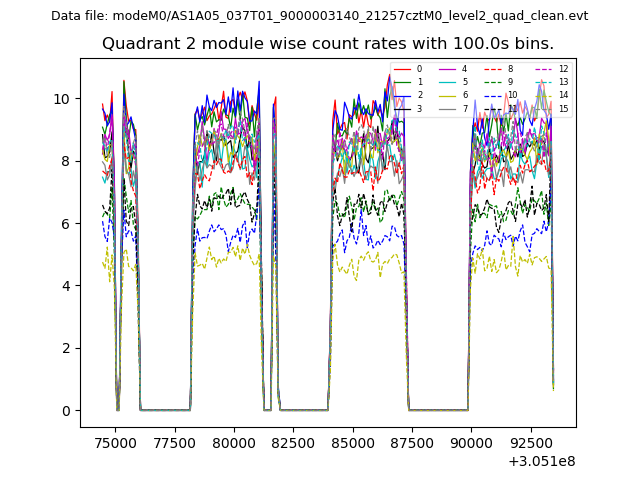
| Module-wise count rates for Quadrant B Data is divided into 100 sec bins |
 |
 |
| Module-wise count rates for Quadrant C Data is divided into 100 sec bins |
 |
 |
| Module-wise count rates for Quadrant D Data is divided into 100 sec bins |
 |
 |
| Parameter | Plot |
|---|---|
| CZT HV Monitor |  |
| D_VDD | 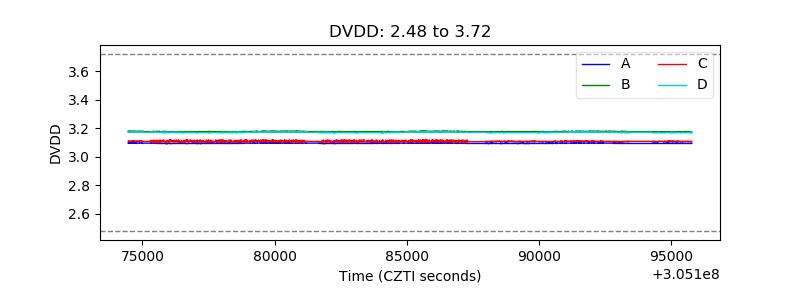 |
| Temperature 1 |  |
| Veto HV Monitor | 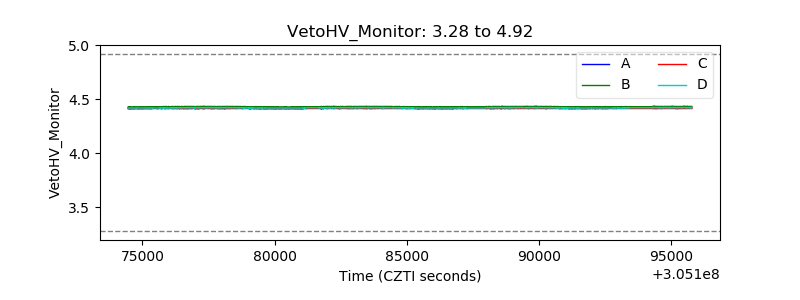 |
| Veto LLD | 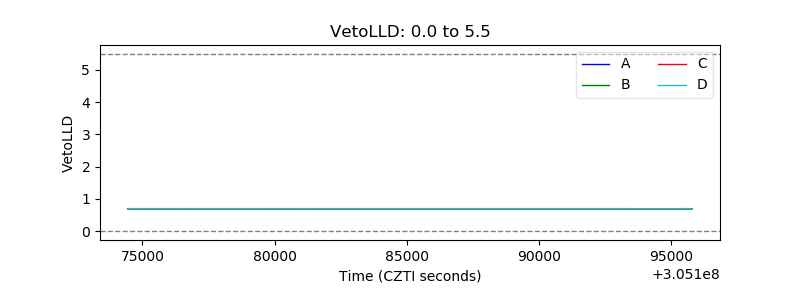 |
| Alpha Counter | 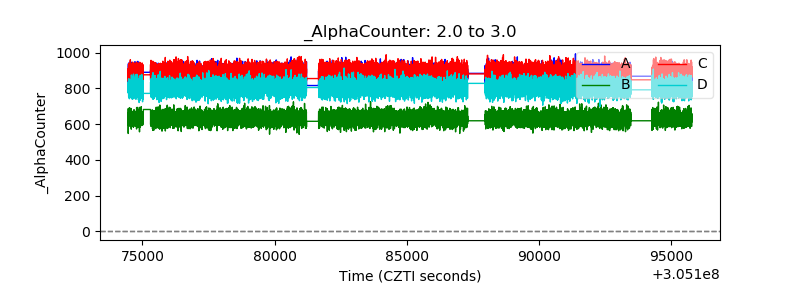 |
| _CPM_Rate | 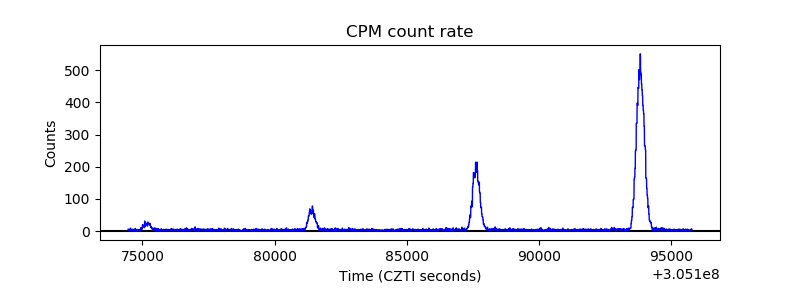 |
| CZT Counter | 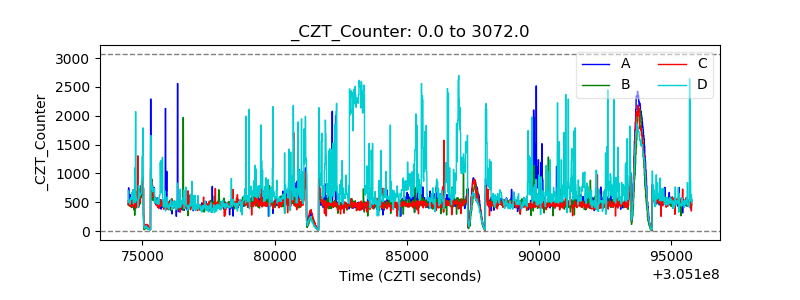 |
| +2.5 Volts monitor |  |
| +5 Volts monitor |  |
| _ROLL_ROT | 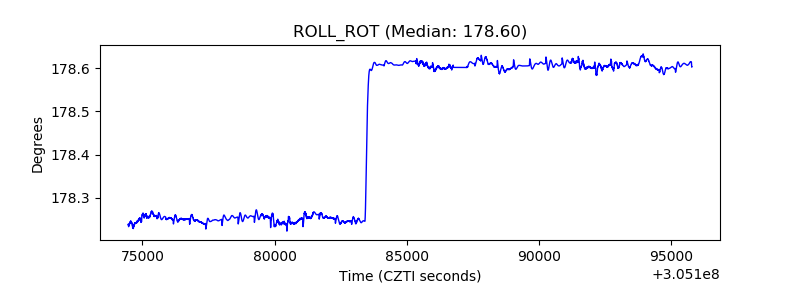 |
| _Roll_DEC | 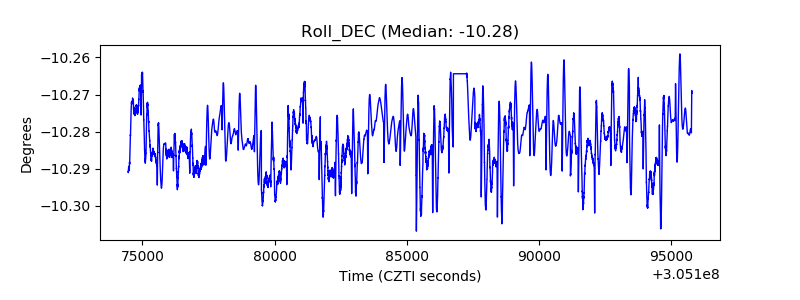 |
| _Roll_RA | 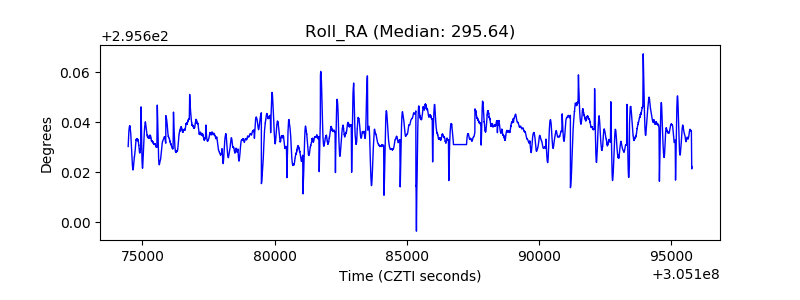 |
| Veto Counter | 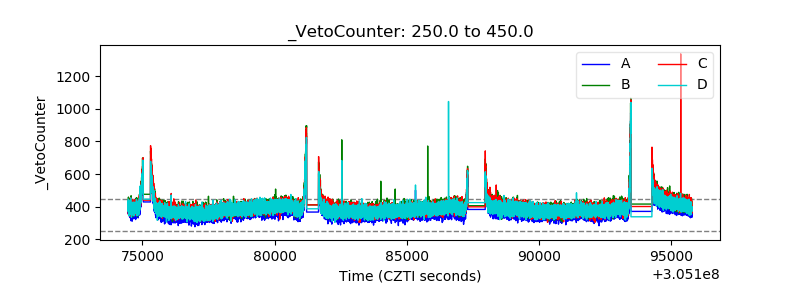 |