| Param | Original file | Final file |
|---|---|---|
| Filename | modeM0/AS1A05_037T01_9000003140_21260cztM0_level2.evt | modeM0/AS1A05_037T01_9000003140_21260cztM0_level2_quad_clean.evt |
| Size (bytes) | 560,139,840 | 88,188,480 |
| Size | 534.2 MB | 84.1 MB |
| Events in quadrant A | 4,244,621 | 563,210 |
| Events in quadrant B | 3,449,411 | 581,971 |
| Events in quadrant C | 3,298,510 | 562,686 |
| Events in quadrant D | 5,530,717 | 509,134 |
| Mode M9 | |||
|---|---|---|---|
| Quadrant | BADHDUFLAG | Total packets | Discarded packets |
| A | 0 | 14 | 0 |
| B | 0 | 15 | 0 |
| C | 0 | 15 | 0 |
| D | 0 | 15 | 0 |
| Mode M0 | |||
|---|---|---|---|
| Quadrant | BADHDUFLAG | Total packets | Discarded packets |
| A | 0 | 16933 | 2 |
| B | 0 | 14348 | 2 |
| C | 0 | 13929 | 2 |
| D | 0 | 20585 | 2 |
| Mode SS | |||
|---|---|---|---|
| Quadrant | BADHDUFLAG | Total packets | Discarded packets |
| A | 0 | 132 | 0 |
| B | 0 | 132 | 0 |
| C | 0 | 132 | 0 |
| D | 0 | 132 | 0 |
| Quadrant | Total seconds | Saturated seconds | Saturation percentage |
|---|---|---|---|
| A | 6500 | 207 | 3.184615% |
| B | 6500 | 85 | 1.307692% |
| C | 6499 | 99 | 1.523311% |
| D | 6499 | 820 | 12.617326% |
Noise dominated data is calculated using 1-second bins in cleaned event files. If a bin has >2000 counts, and if more than 50% of those come from <1% of pixels, then it is considered to be noise-dominated and hence unusable.
| Quadrant | # 1 sec bins | Bins with >0 counts | Bins with >2000 counts | High rate bins dominated by noise | Noise dominated (total time) | Noise dominated (detector-on time) | Marked lightcurve |
|---|---|---|---|---|---|---|---|
| A | 7605 | 6500 | 102 | 102 | 1.34% | 1.57% | 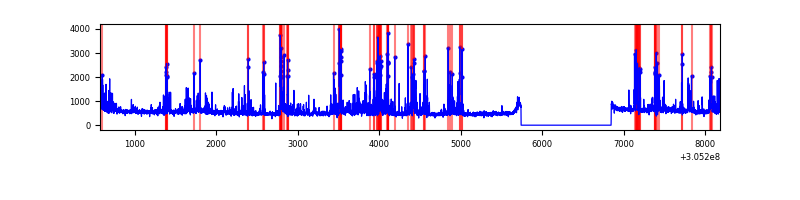 |
| B | 7605 | 6500 | 10 | 10 | 0.13% | 0.15% | 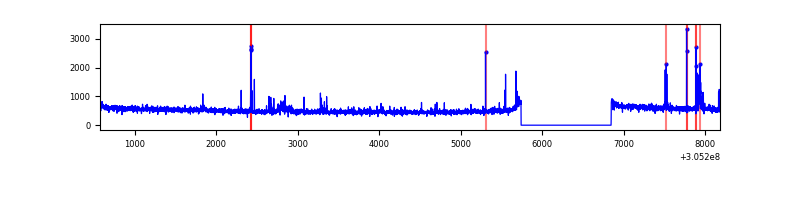 |
| C | 7604 | 6499 | 0 | 0 | 0.00% | 0.00% | 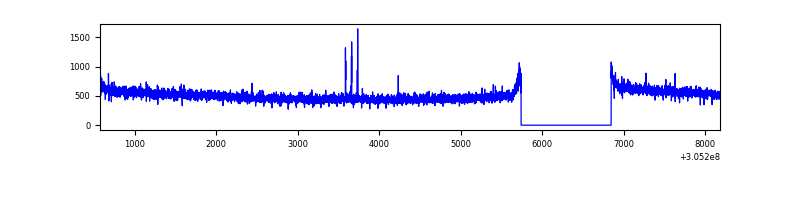 |
| D | 7603 | 6498 | 639 | 639 | 8.40% | 9.83% | 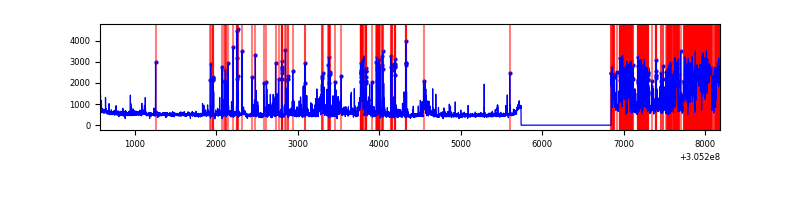 |
Top three noisy pixels from each quadrant. If the there are fewer than three noisy pixels in the level2.evt file, extra rows are filled as -1
| Pixel properties | Quadrant properties | ||||||
|---|---|---|---|---|---|---|---|
| Quadrant | DetID | PixID | Counts | Sigma | Mean | Median | Sigma |
| A | 5 | 16 | 941271 | 5508.63 | 849 | 832 | 170.7 |
| A | 12 | 96 | 15773 | 87.52 | 849 | 832 | 170.7 |
| A | 13 | 254 | 10407 | 56.09 | 849 | 832 | 170.7 |
| B | 0 | 197 | 61620 | 380.97 | 844 | 825 | 159.6 |
| B | 3 | 64 | 36436 | 223.16 | 844 | 825 | 159.6 |
| B | 0 | 245 | 32321 | 197.37 | 844 | 825 | 159.6 |
| C | 14 | 238 | 130059 | 686.94 | 808 | 815 | 188.1 |
| C | 0 | 207 | 11674 | 57.72 | 808 | 815 | 188.1 |
| C | 13 | 61 | 5647 | 25.68 | 808 | 815 | 188.1 |
| D | 13 | 174 | 1698080 | 8882.73 | 785 | 763 | 191.1 |
| D | 1 | 52 | 275401 | 1437.29 | 785 | 763 | 191.1 |
| D | 12 | 235 | 185705 | 967.87 | 785 | 763 | 191.1 |
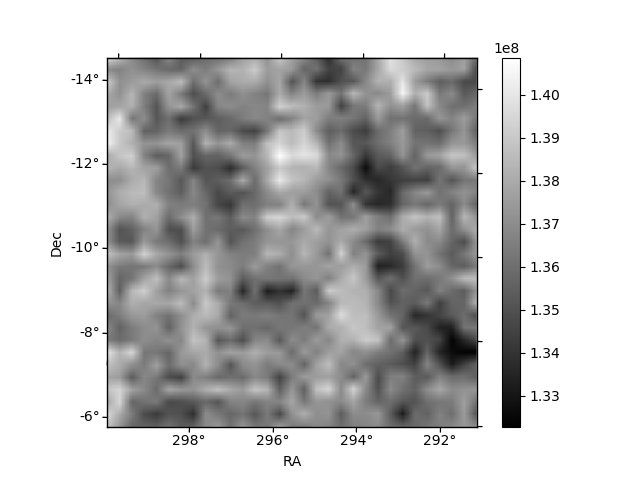
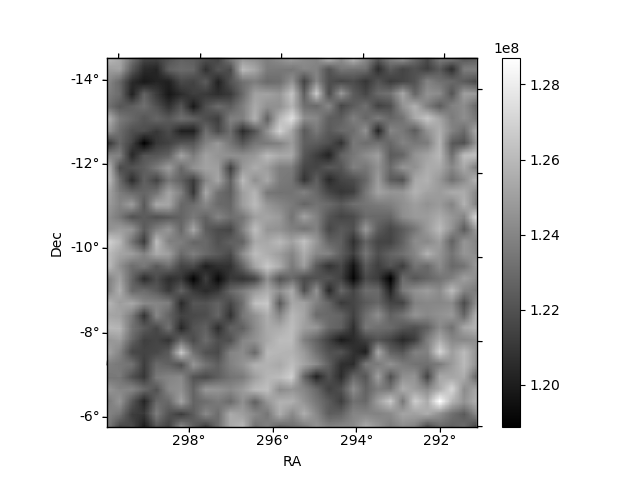
Histogram calculated using DETX and DETY for each event in the final _common_clean file
| Quadrant A |  |
 |
Quadrant B |
|---|---|---|---|
| Quadrant D |  |
 |
Quadrant C |
| Plot type | Count rate plots | Images |
|---|---|---|
| Comparison with Poisson distribution Blue bars denote a histogram of data divided into 1 sec bins. Red curve is a Poisson curve with rate = median count rate of data. |
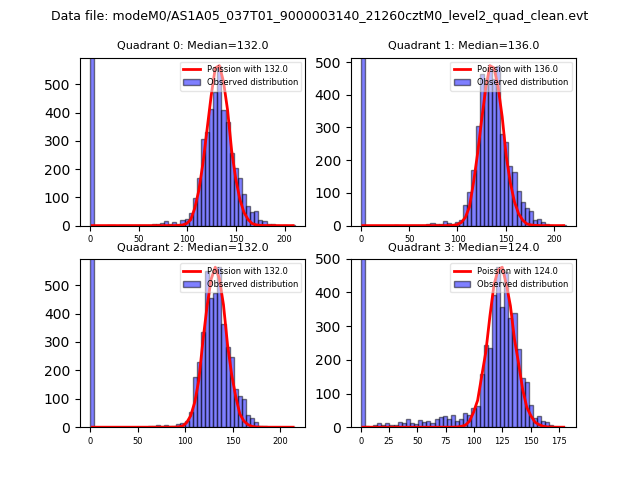 |
 |
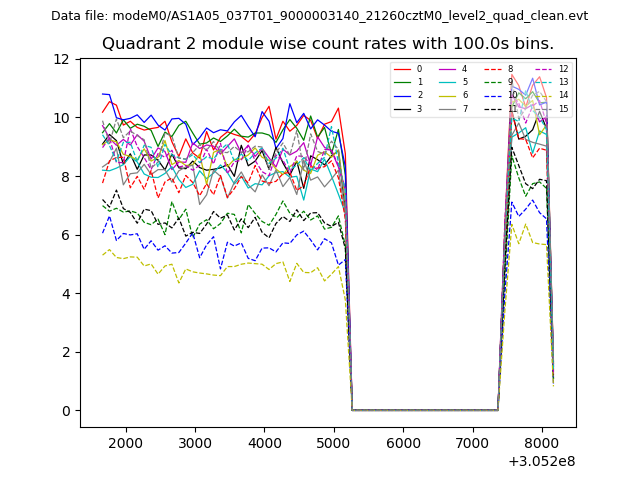
| Quadrant-wise count rates Data is divided into 100 sec bins |
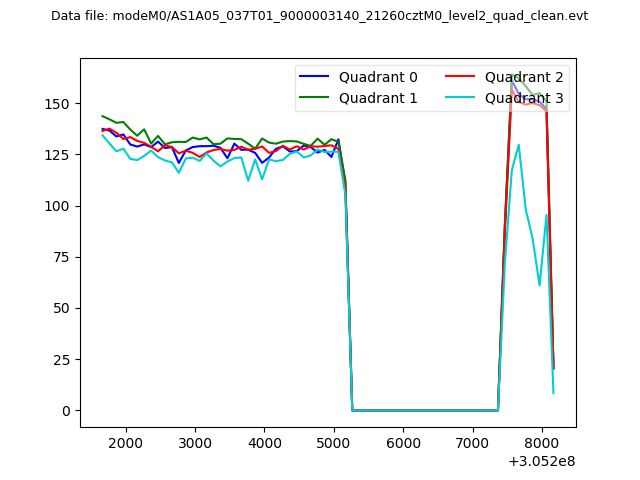 |
|
| Module-wise count rates for Quadrant A Data is divided into 100 sec bins |
 |
 |
| Module-wise count rates for Quadrant B Data is divided into 100 sec bins |
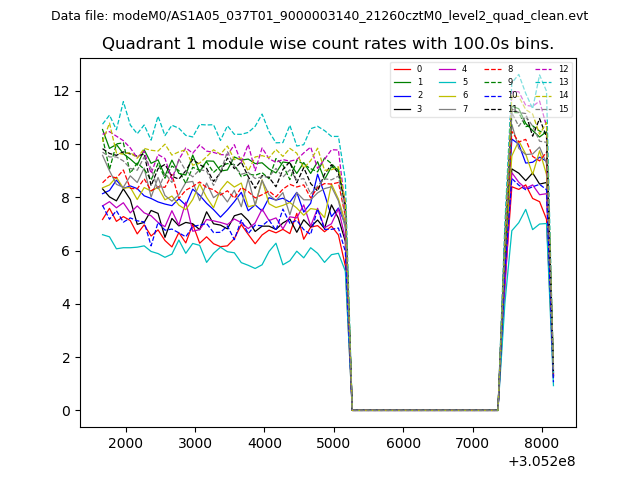 |
 |
| Module-wise count rates for Quadrant C Data is divided into 100 sec bins |
 |
 |
| Module-wise count rates for Quadrant D Data is divided into 100 sec bins |
 |
 |
| Parameter | Plot |
|---|---|
| CZT HV Monitor | 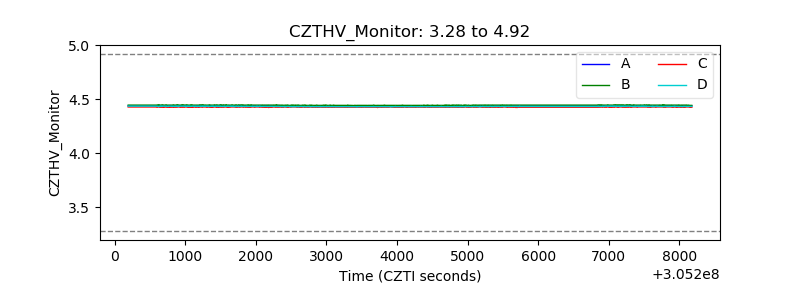 |
| D_VDD |  |
| Temperature 1 |  |
| Veto HV Monitor |  |
| Veto LLD |  |
| Alpha Counter | 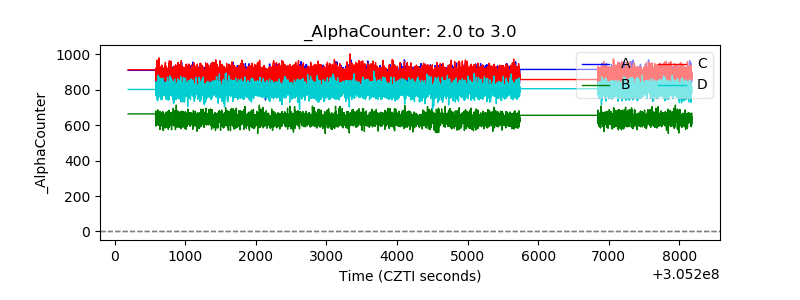 |
| _CPM_Rate | 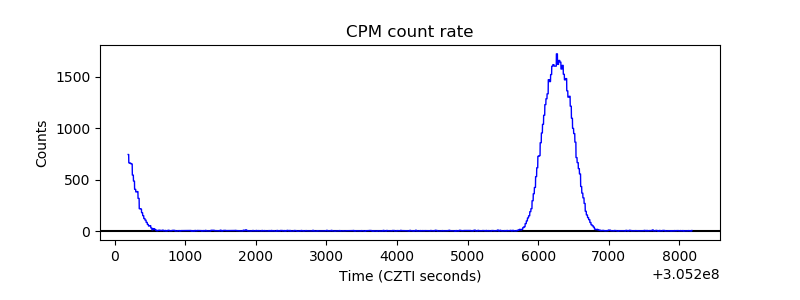 |
| CZT Counter |  |
| +2.5 Volts monitor |  |
| +5 Volts monitor |  |
| _ROLL_ROT |  |
| _Roll_DEC |  |
| _Roll_RA |  |
| Veto Counter |  |