| Param | Original file | Final file |
|---|---|---|
| Filename | modeM0/AS1A05_037T01_9000003140_21261cztM0_level2.evt | modeM0/AS1A05_037T01_9000003140_21261cztM0_level2_quad_clean.evt |
| Size (bytes) | 567,720,000 | 98,784,000 |
| Size | 541.4 MB | 94.2 MB |
| Events in quadrant A | 3,259,382 | 685,226 |
| Events in quadrant B | 3,131,665 | 693,358 |
| Events in quadrant C | 2,928,149 | 664,703 |
| Events in quadrant D | 7,489,620 | 550,896 |
| Mode M9 | |||
|---|---|---|---|
| Quadrant | BADHDUFLAG | Total packets | Discarded packets |
| A | 0 | 12 | 0 |
| B | 0 | 12 | 0 |
| C | 0 | 12 | 0 |
| D | 0 | 12 | 0 |
| Mode M0 | |||
|---|---|---|---|
| Quadrant | BADHDUFLAG | Total packets | Discarded packets |
| A | 0 | 13394 | 1 |
| B | 0 | 13023 | 1 |
| C | 0 | 12371 | 1 |
| D | 0 | 26235 | 1 |
| Mode SS | |||
|---|---|---|---|
| Quadrant | BADHDUFLAG | Total packets | Discarded packets |
| A | 0 | 116 | 0 |
| B | 0 | 116 | 0 |
| C | 0 | 116 | 0 |
| D | 0 | 116 | 0 |
| Quadrant | Total seconds | Saturated seconds | Saturation percentage |
|---|---|---|---|
| A | 5673 | 150 | 2.644104% |
| B | 5674 | 96 | 1.691928% |
| C | 5673 | 104 | 1.833245% |
| D | 5673 | 1601 | 28.221400% |
Noise dominated data is calculated using 1-second bins in cleaned event files. If a bin has >2000 counts, and if more than 50% of those come from <1% of pixels, then it is considered to be noise-dominated and hence unusable.
| Quadrant | # 1 sec bins | Bins with >0 counts | Bins with >2000 counts | High rate bins dominated by noise | Noise dominated (total time) | Noise dominated (detector-on time) | Marked lightcurve |
|---|---|---|---|---|---|---|---|
| A | 6893 | 5673 | 16 | 16 | 0.23% | 0.28% | 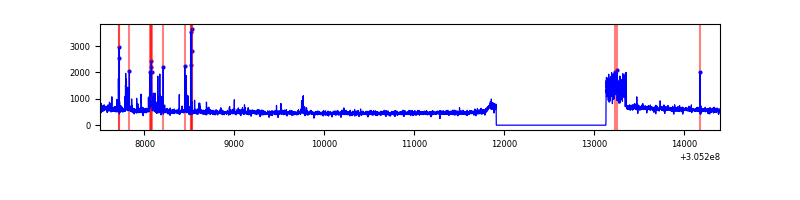 |
| B | 6894 | 5674 | 8 | 8 | 0.12% | 0.14% | 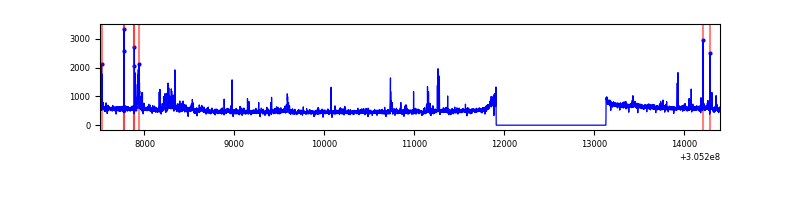 |
| C | 6893 | 5673 | 1 | 1 | 0.01% | 0.02% | 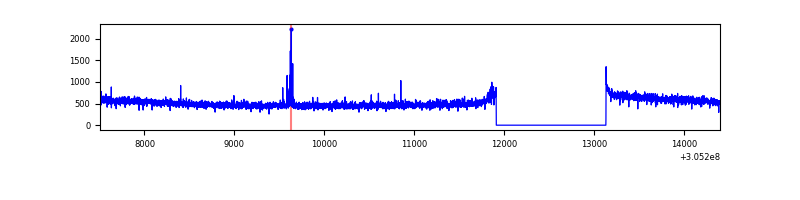 |
| D | 6893 | 5673 | 1463 | 1463 | 21.22% | 25.79% | 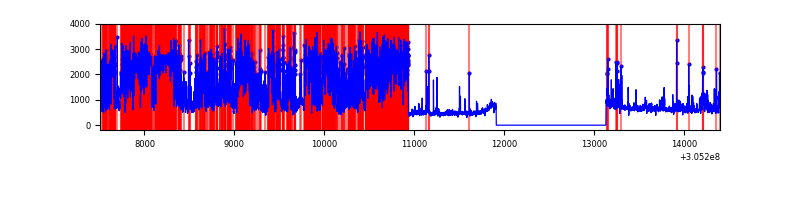 |
Top three noisy pixels from each quadrant. If the there are fewer than three noisy pixels in the level2.evt file, extra rows are filled as -1
| Pixel properties | Quadrant properties | ||||||
|---|---|---|---|---|---|---|---|
| Quadrant | DetID | PixID | Counts | Sigma | Mean | Median | Sigma |
| A | 15 | 236 | 171244 | 1112.44 | 760 | 747 | 153.3 |
| A | 5 | 16 | 134277 | 871.24 | 760 | 747 | 153.3 |
| A | 9 | 143 | 13888 | 85.74 | 760 | 747 | 153.3 |
| B | 0 | 197 | 104431 | 725.36 | 748 | 731 | 143.0 |
| B | 0 | 245 | 39068 | 268.16 | 748 | 731 | 143.0 |
| B | 3 | 64 | 27771 | 189.14 | 748 | 731 | 143.0 |
| C | 14 | 238 | 113729 | 683.34 | 717 | 723 | 165.4 |
| C | 0 | 207 | 17911 | 103.93 | 717 | 723 | 165.4 |
| C | 13 | 61 | 5016 | 25.96 | 717 | 723 | 165.4 |
| D | 13 | 174 | 3512359 | 21732.99 | 663 | 645 | 161.6 |
| D | 13 | 153 | 533094 | 3295.17 | 663 | 645 | 161.6 |
| D | 12 | 233 | 451072 | 2787.56 | 663 | 645 | 161.6 |
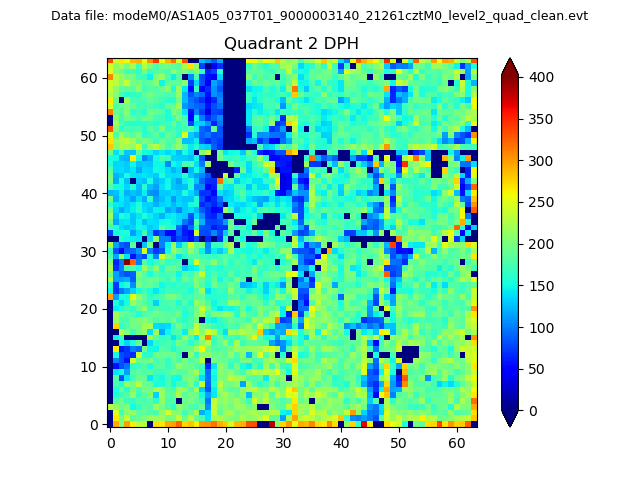
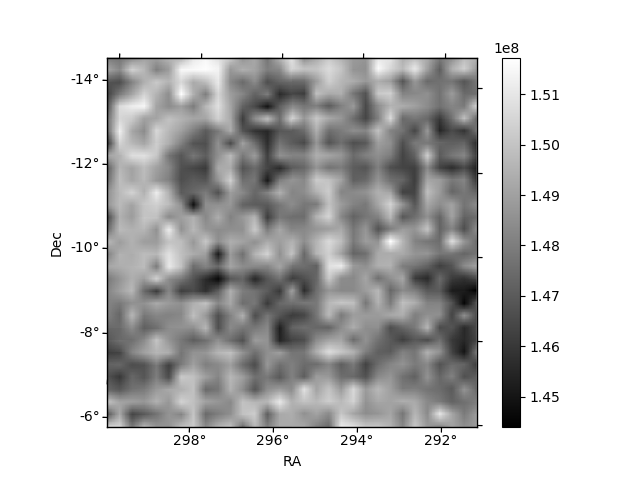
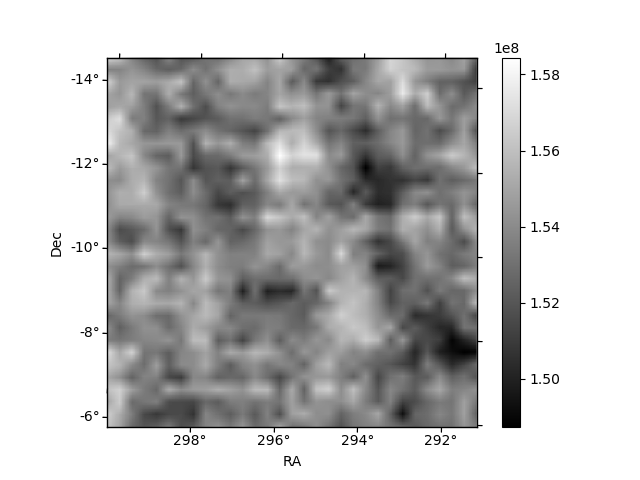
Histogram calculated using DETX and DETY for each event in the final _common_clean file
| Quadrant A | 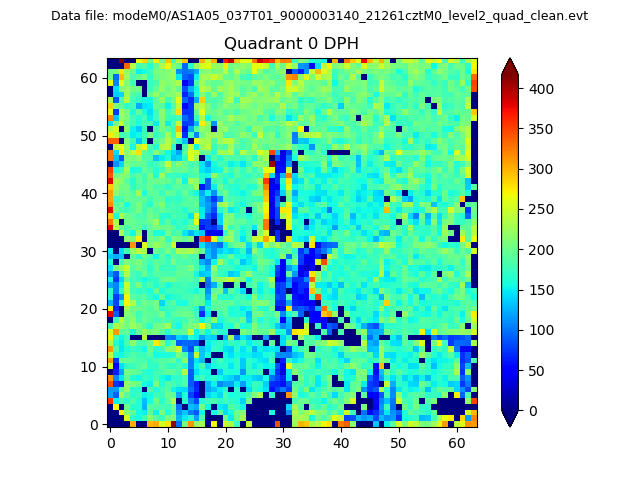 |
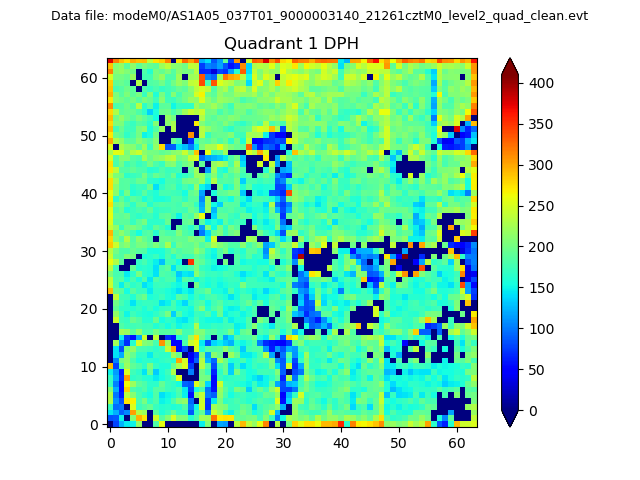 |
Quadrant B |
|---|---|---|---|
| Quadrant D | 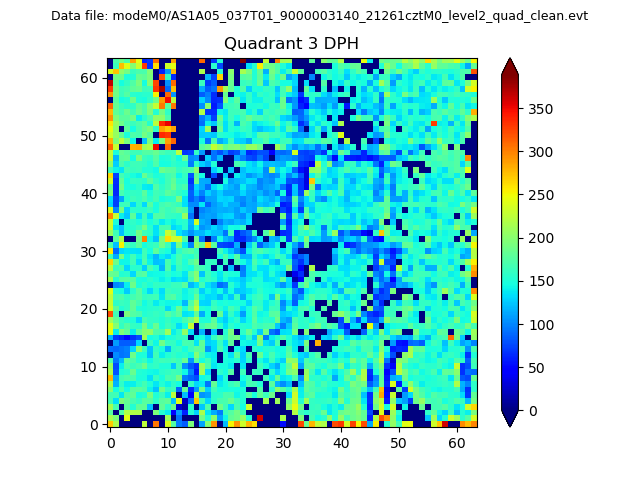 |
 |
Quadrant C |
| Plot type | Count rate plots | Images |
|---|---|---|
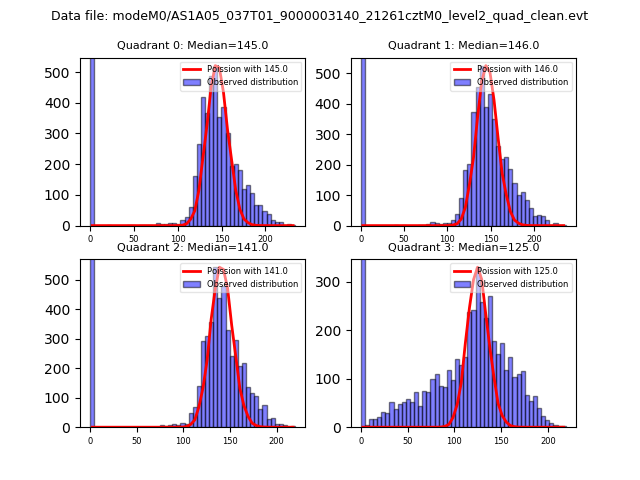
| Comparison with Poisson distribution Blue bars denote a histogram of data divided into 1 sec bins. Red curve is a Poisson curve with rate = median count rate of data. |
 |
 |
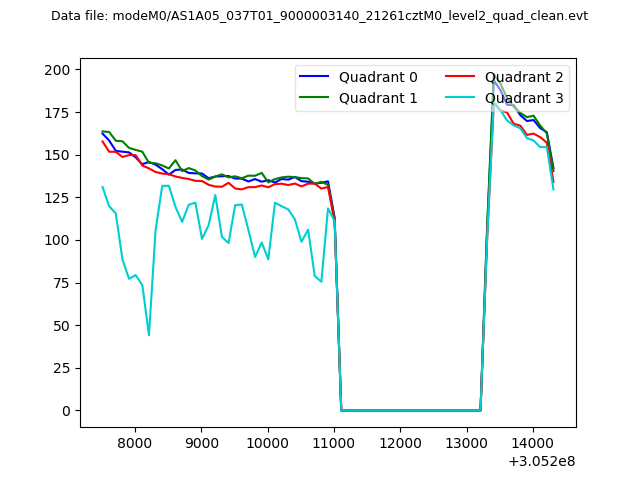
| Quadrant-wise count rates Data is divided into 100 sec bins |
 |
|
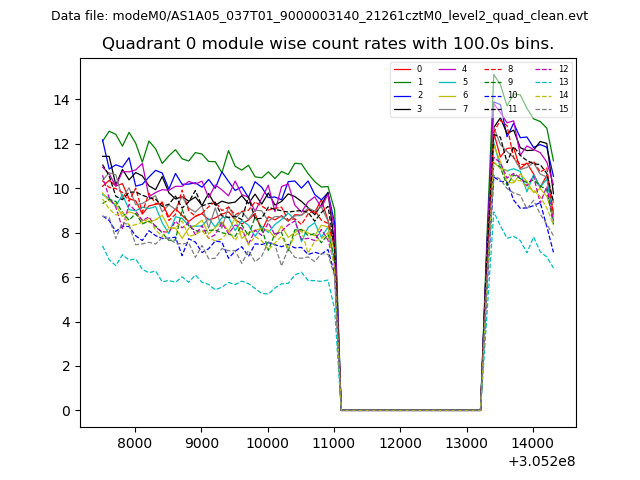
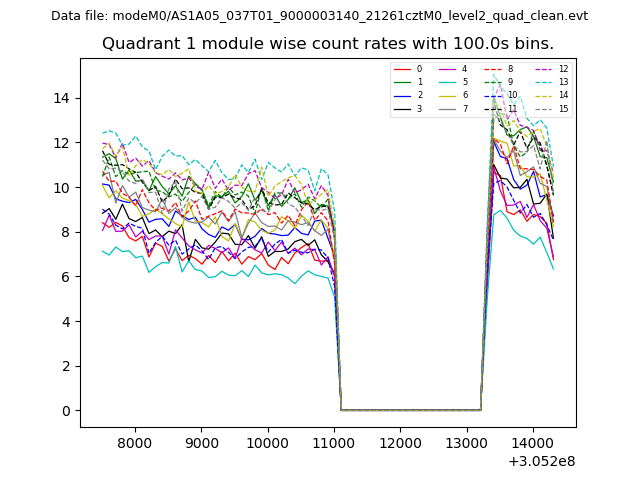
| Module-wise count rates for Quadrant A Data is divided into 100 sec bins |
 |
 |
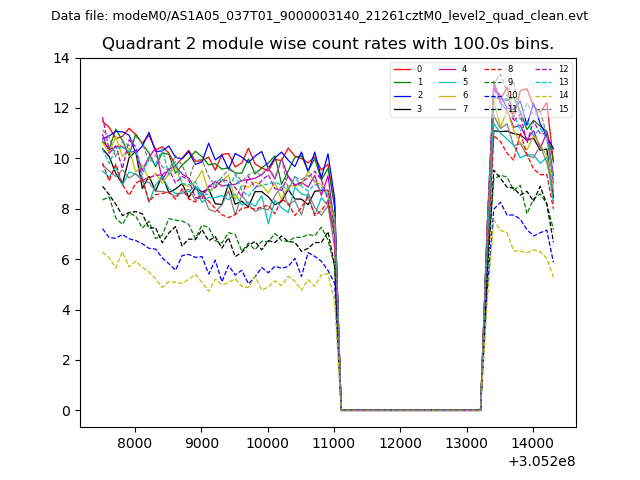
| Module-wise count rates for Quadrant B Data is divided into 100 sec bins |
 |
 |
| Module-wise count rates for Quadrant C Data is divided into 100 sec bins |
 |
 |
| Module-wise count rates for Quadrant D Data is divided into 100 sec bins |
 |
 |
| Parameter | Plot |
|---|---|
| CZT HV Monitor | 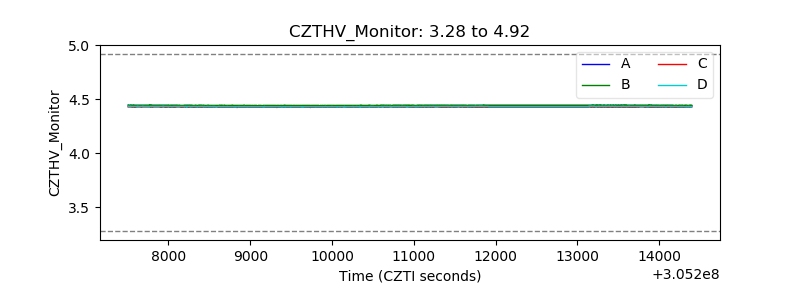 |
| D_VDD | 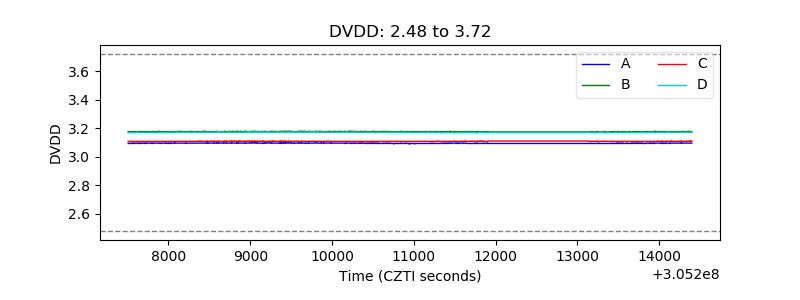 |
| Temperature 1 | 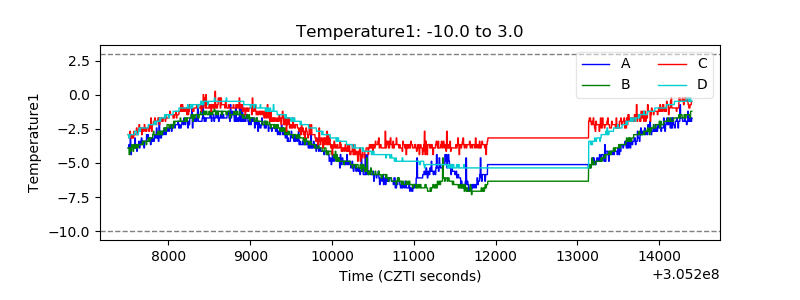 |
| Veto HV Monitor | 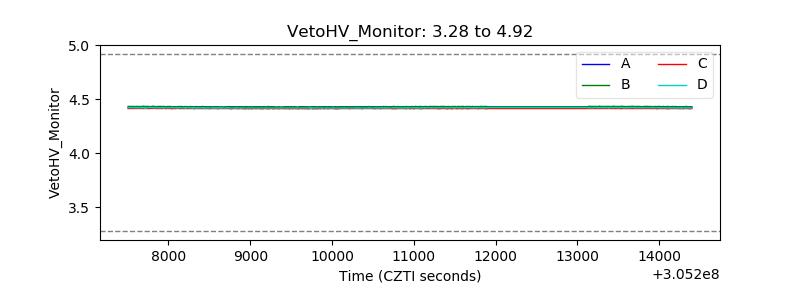 |
| Veto LLD | 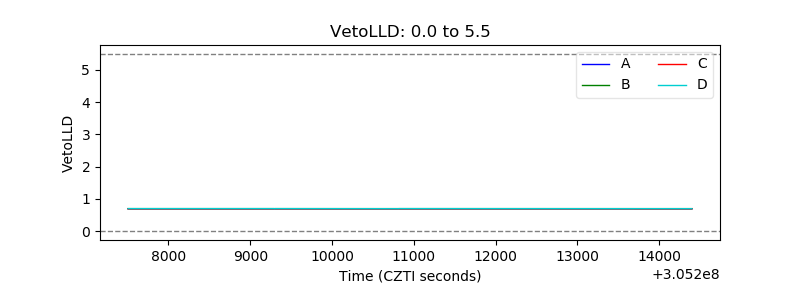 |
| Alpha Counter | 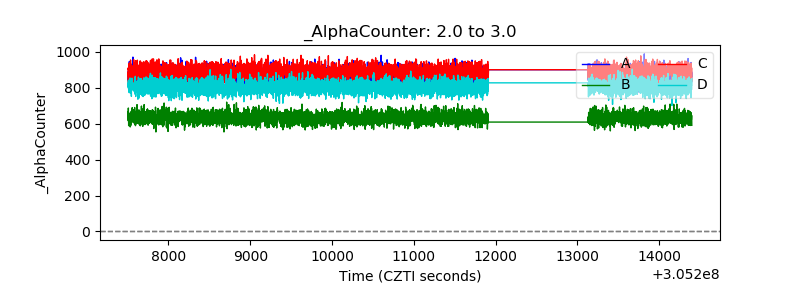 |
| _CPM_Rate |  |
| CZT Counter | 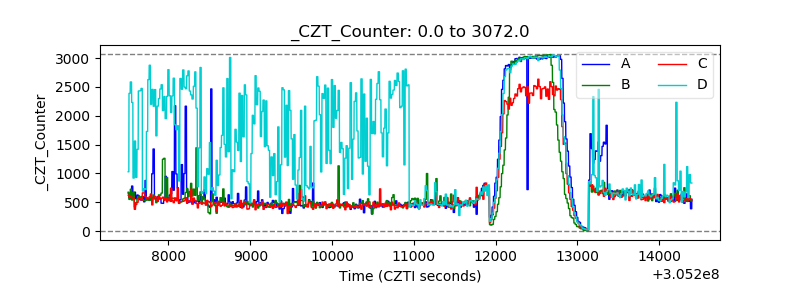 |
| +2.5 Volts monitor |  |
| +5 Volts monitor |  |
| _ROLL_ROT |  |
| _Roll_DEC | 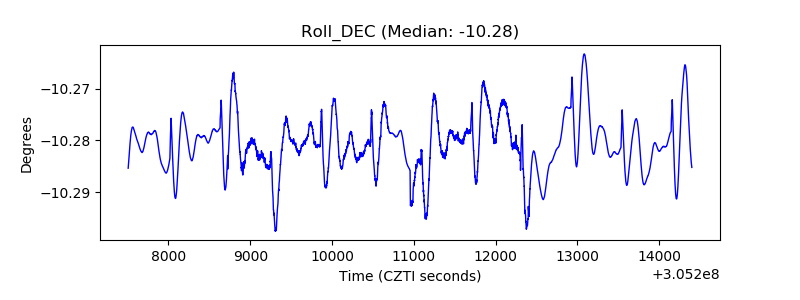 |
| _Roll_RA | 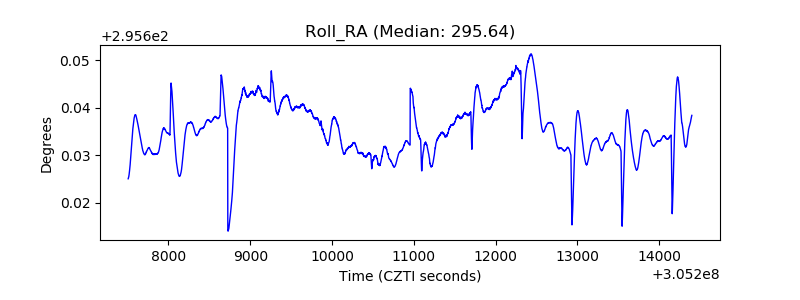 |
| Veto Counter |  |