| Param | Original file | Final file |
|---|---|---|
| Filename | modeM0/AS1A05_037T01_9000003140_21262cztM0_level2.evt | modeM0/AS1A05_037T01_9000003140_21262cztM0_level2_quad_clean.evt |
| Size (bytes) | 583,767,360 | 122,071,680 |
| Size | 556.7 MB | 116.4 MB |
| Events in quadrant A | 3,799,479 | 838,810 |
| Events in quadrant B | 3,798,513 | 842,745 |
| Events in quadrant C | 3,513,415 | 803,285 |
| Events in quadrant D | 6,124,031 | 755,163 |
| Mode M9 | |||
|---|---|---|---|
| Quadrant | BADHDUFLAG | Total packets | Discarded packets |
| A | 0 | 24 | 0 |
| B | 0 | 25 | 0 |
| C | 0 | 25 | 0 |
| D | 0 | 25 | 0 |
| Mode M0 | |||
|---|---|---|---|
| Quadrant | BADHDUFLAG | Total packets | Discarded packets |
| A | 0 | 15543 | 2 |
| B | 0 | 15623 | 2 |
| C | 0 | 14670 | 2 |
| D | 0 | 22686 | 6 |
| Mode SS | |||
|---|---|---|---|
| Quadrant | BADHDUFLAG | Total packets | Discarded packets |
| A | 0 | 134 | 0 |
| B | 0 | 134 | 0 |
| C | 0 | 134 | 0 |
| D | 0 | 134 | 0 |
| Quadrant | Total seconds | Saturated seconds | Saturation percentage |
|---|---|---|---|
| A | 6558 | 154 | 2.348277% |
| B | 6558 | 128 | 1.951815% |
| C | 6558 | 124 | 1.890820% |
| D | 6557 | 707 | 10.782370% |
Noise dominated data is calculated using 1-second bins in cleaned event files. If a bin has >2000 counts, and if more than 50% of those come from <1% of pixels, then it is considered to be noise-dominated and hence unusable.
| Quadrant | # 1 sec bins | Bins with >0 counts | Bins with >2000 counts | High rate bins dominated by noise | Noise dominated (total time) | Noise dominated (detector-on time) | Marked lightcurve |
|---|---|---|---|---|---|---|---|
| A | 7853 | 6558 | 7 | 7 | 0.09% | 0.11% | 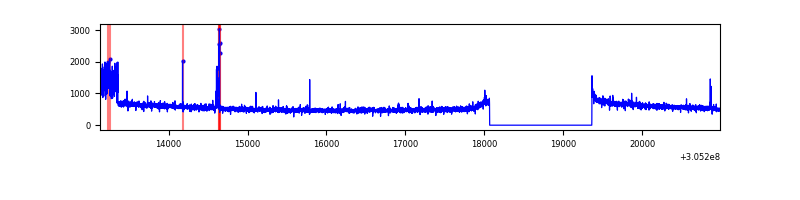 |
| B | 7853 | 6558 | 34 | 34 | 0.43% | 0.52% |  |
| C | 7853 | 6558 | 0 | 0 | 0.00% | 0.00% | 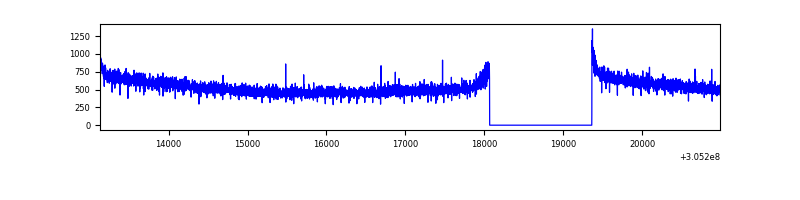 |
| D | 7851 | 6556 | 509 | 509 | 6.48% | 7.76% | 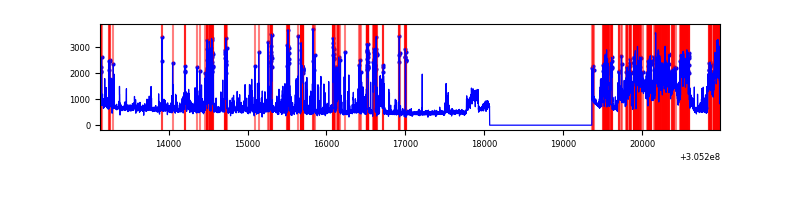 |
Top three noisy pixels from each quadrant. If the there are fewer than three noisy pixels in the level2.evt file, extra rows are filled as -1
| Pixel properties | Quadrant properties | ||||||
|---|---|---|---|---|---|---|---|
| Quadrant | DetID | PixID | Counts | Sigma | Mean | Median | Sigma |
| A | 15 | 236 | 177281 | 956.22 | 923 | 906 | 184.5 |
| A | 9 | 143 | 34205 | 180.53 | 923 | 906 | 184.5 |
| A | 13 | 252 | 19232 | 99.35 | 923 | 906 | 184.5 |
| B | 3 | 64 | 128385 | 747.13 | 903 | 883 | 170.7 |
| B | 4 | 216 | 32442 | 184.93 | 903 | 883 | 170.7 |
| B | 0 | 197 | 31377 | 178.69 | 903 | 883 | 170.7 |
| C | 14 | 238 | 140656 | 708.81 | 863 | 870 | 197.2 |
| C | 13 | 61 | 6178 | 26.92 | 863 | 870 | 197.2 |
| C | 0 | 10 | 5193 | 21.92 | 863 | 870 | 197.2 |
| D | 1 | 52 | 1070344 | 5117.12 | 869 | 849 | 209.0 |
| D | 13 | 174 | 959833 | 4588.37 | 869 | 849 | 209.0 |
| D | 12 | 233 | 314496 | 1500.68 | 869 | 849 | 209.0 |
Histogram calculated using DETX and DETY for each event in the final _common_clean file
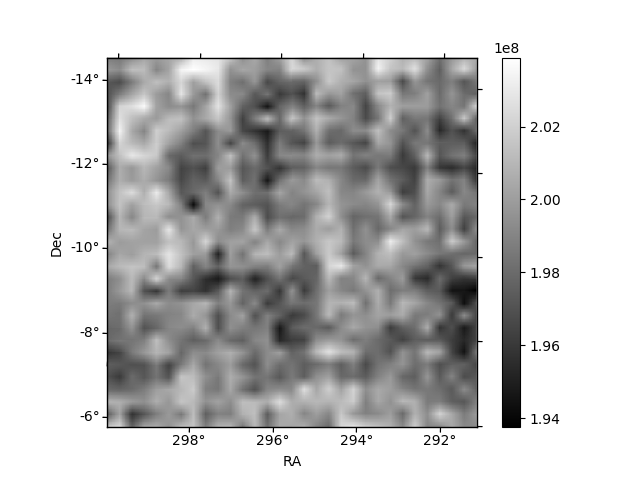
| Quadrant A | 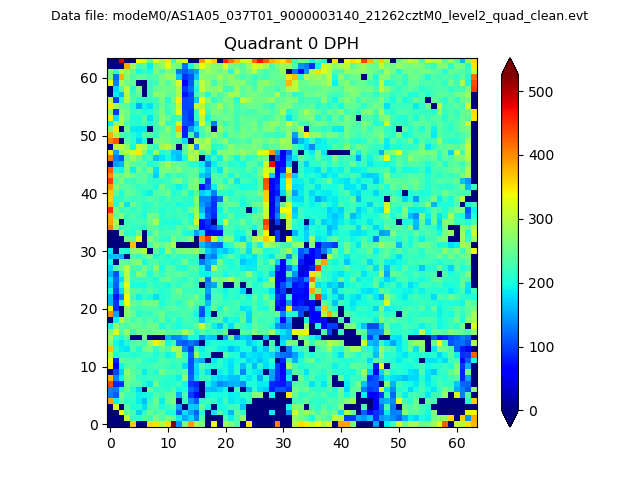 |
 |
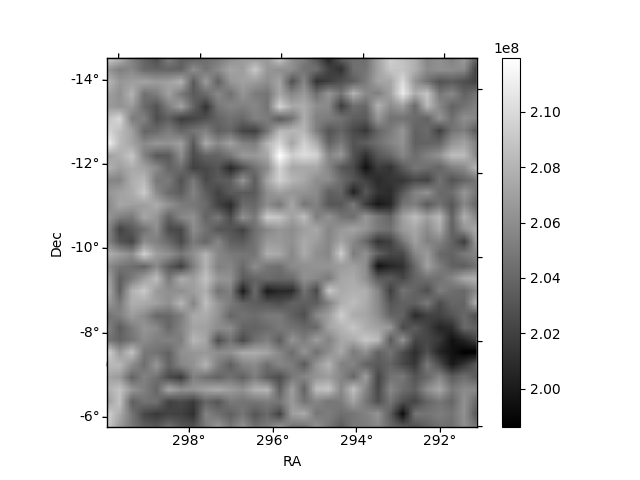
Quadrant B |
|---|---|---|---|
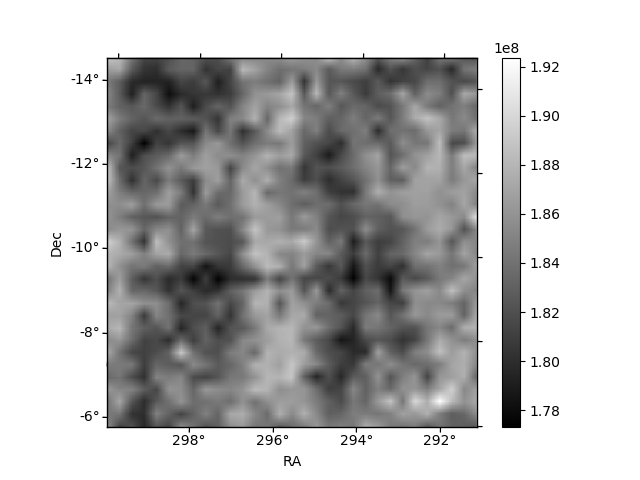
| Quadrant D |  |
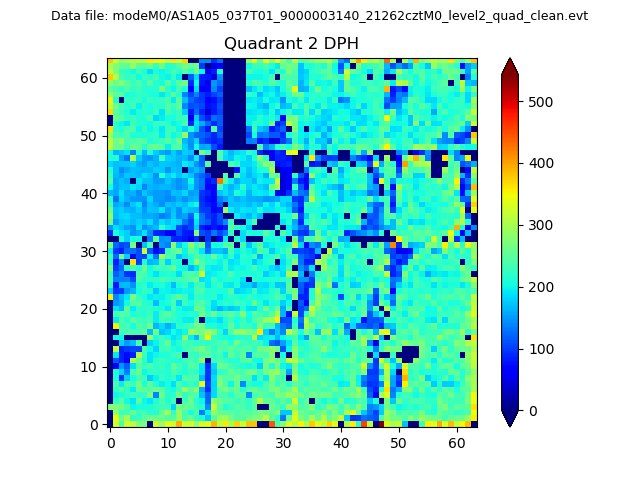 |
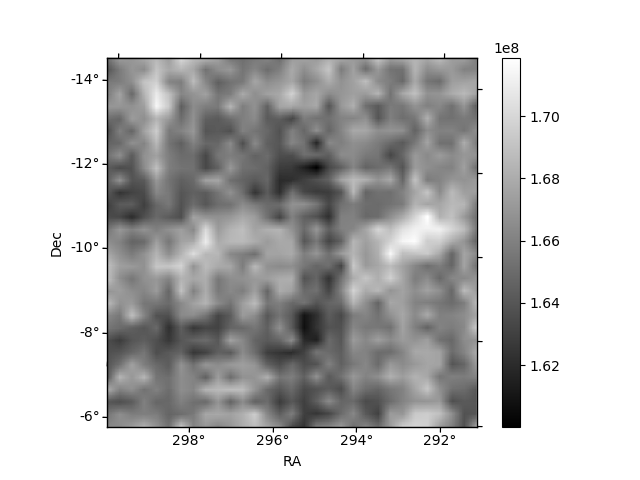
Quadrant C |
| Plot type | Count rate plots | Images |
|---|---|---|
| Comparison with Poisson distribution Blue bars denote a histogram of data divided into 1 sec bins. Red curve is a Poisson curve with rate = median count rate of data. |
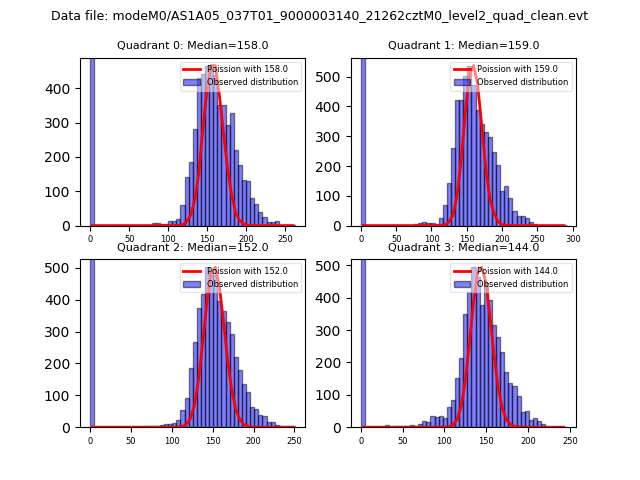 |
 |
| Quadrant-wise count rates Data is divided into 100 sec bins |
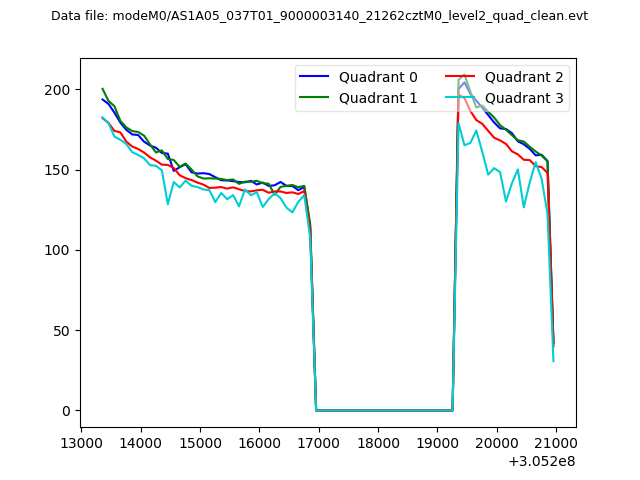 |
|
| Module-wise count rates for Quadrant A Data is divided into 100 sec bins |
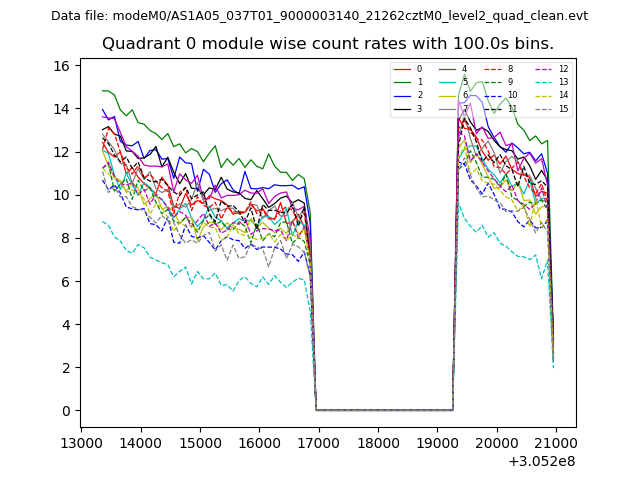 |
 |
| Module-wise count rates for Quadrant B Data is divided into 100 sec bins |
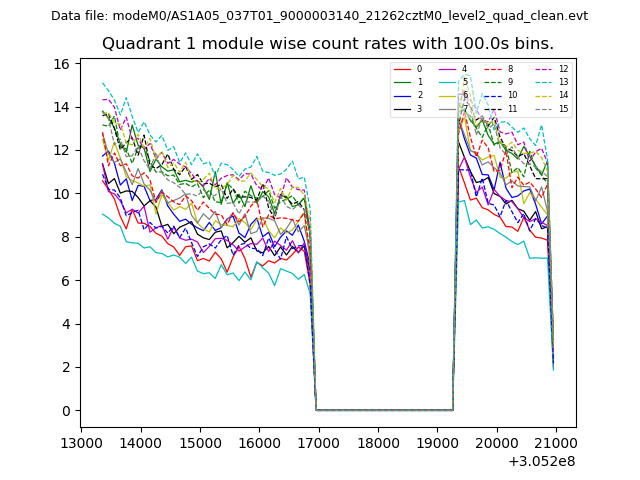 |
 |
| Module-wise count rates for Quadrant C Data is divided into 100 sec bins |
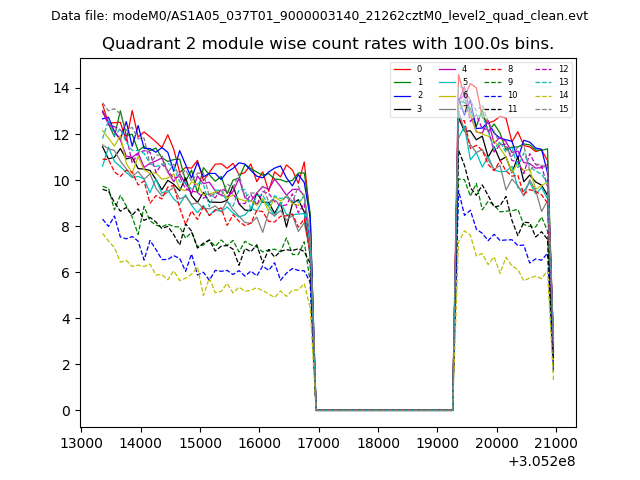 |
 |
| Module-wise count rates for Quadrant D Data is divided into 100 sec bins |
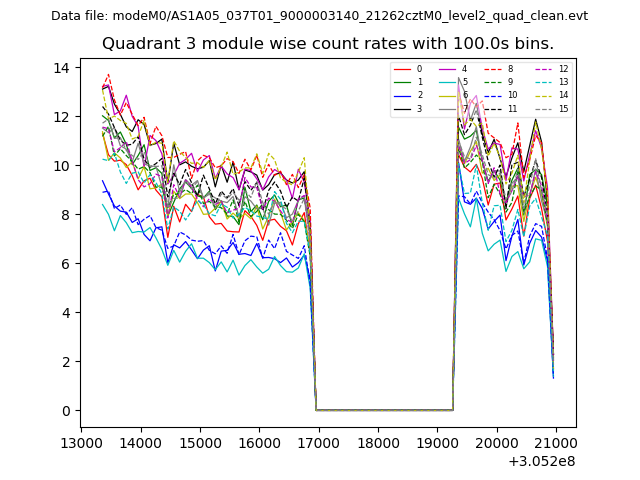 |
 |
| Parameter | Plot |
|---|---|
| CZT HV Monitor | 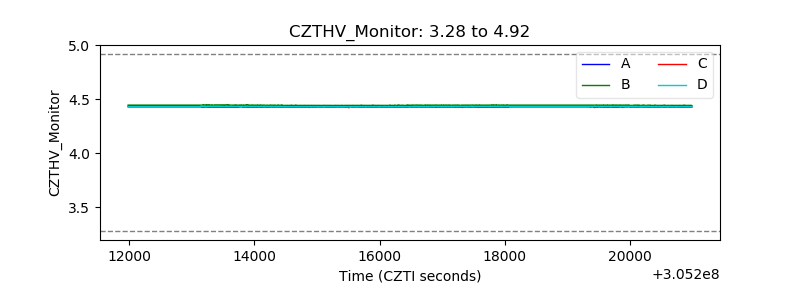 |
| D_VDD | 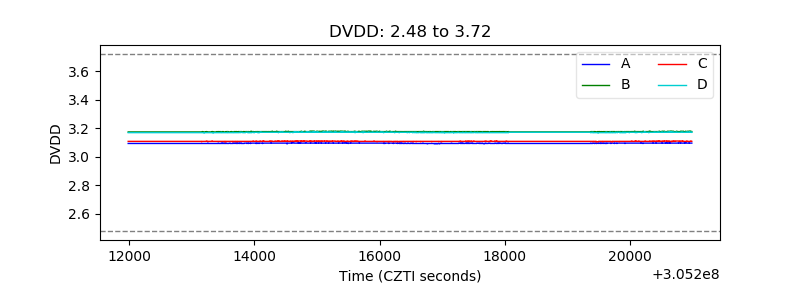 |
| Temperature 1 | 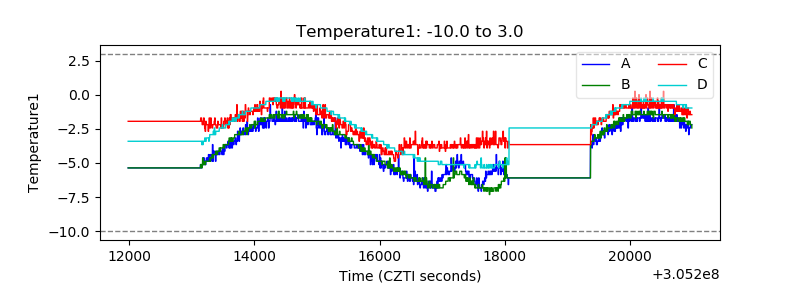 |
| Veto HV Monitor | 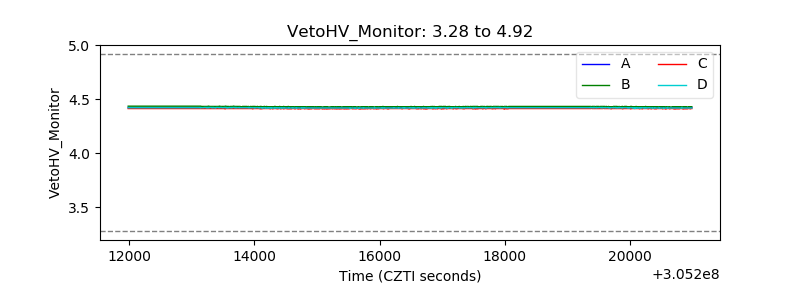 |
| Veto LLD | 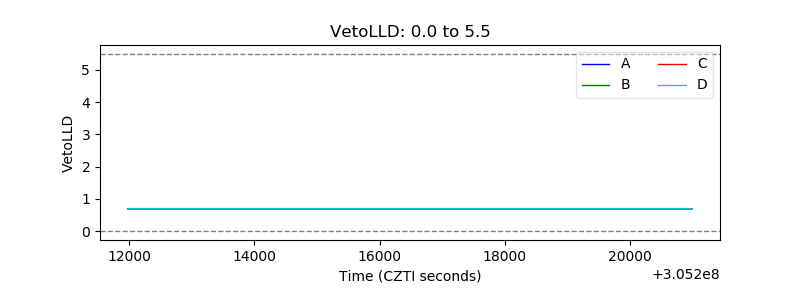 |
| Alpha Counter | 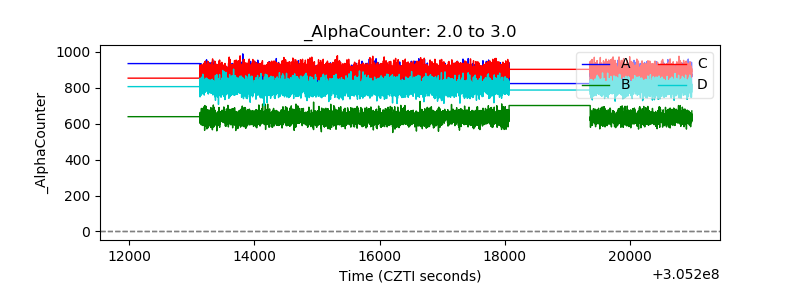 |
| _CPM_Rate | 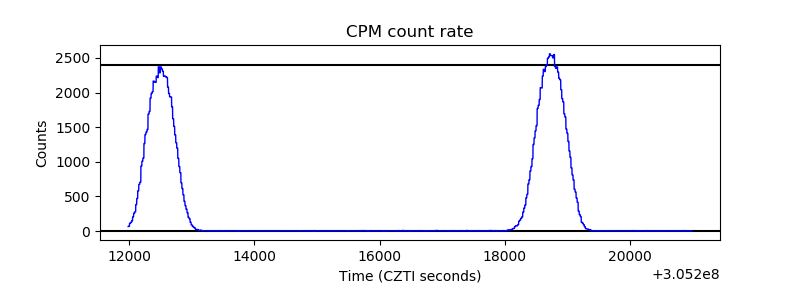 |
| CZT Counter | 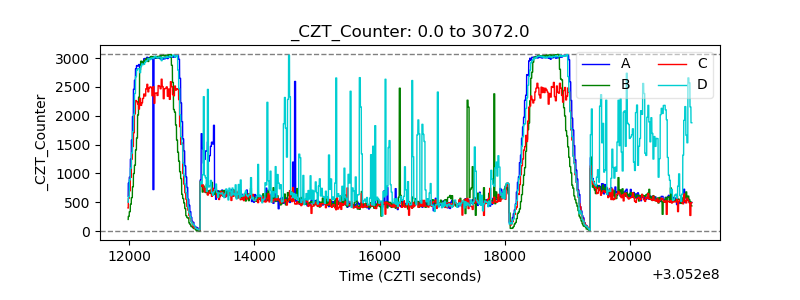 |
| +2.5 Volts monitor |  |
| +5 Volts monitor | 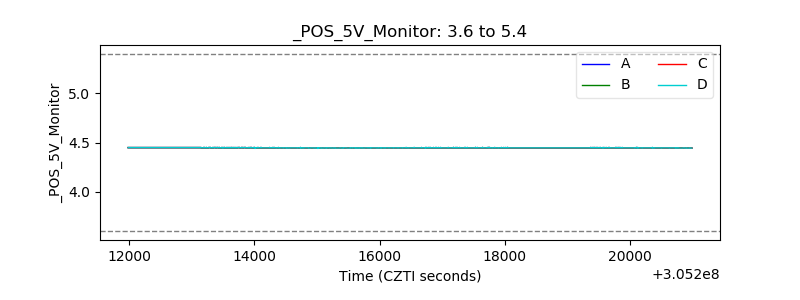 |
| _ROLL_ROT | 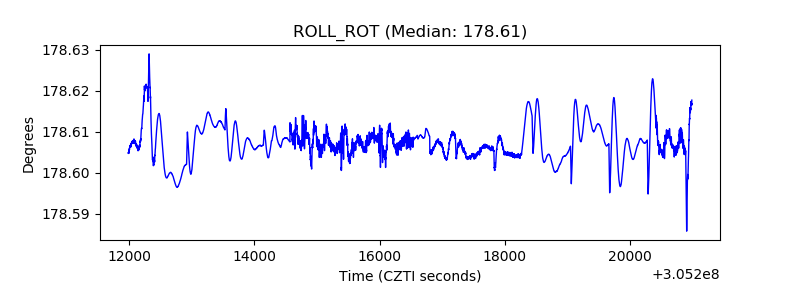 |
| _Roll_DEC | 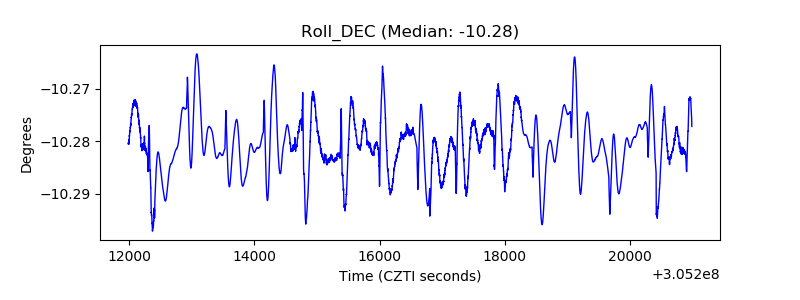 |
| _Roll_RA | 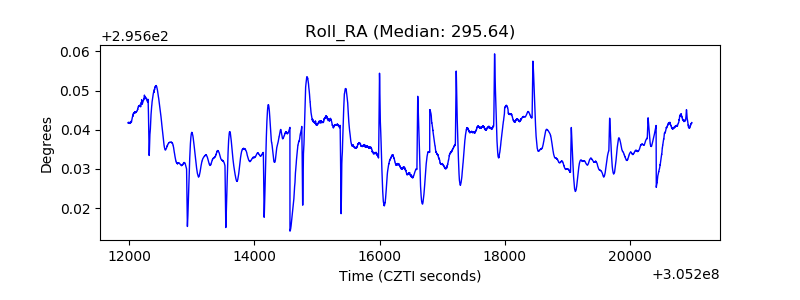 |
| Veto Counter | 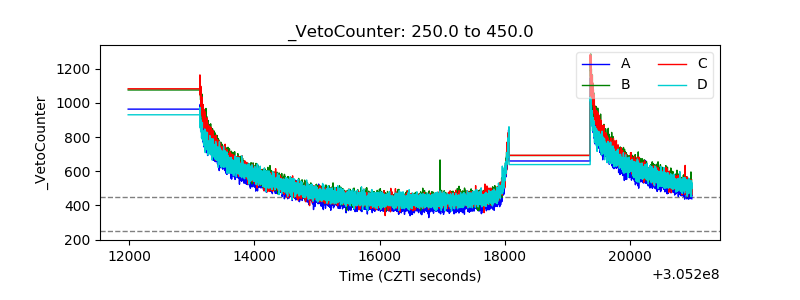 |