| Param | Original file | Final file |
|---|---|---|
| Filename | modeM0/AS1A05_037T01_9000003140_21266cztM0_level2.evt | modeM0/AS1A05_037T01_9000003140_21266cztM0_level2_quad_clean.evt |
| Size (bytes) | 483,350,400 | 98,556,480 |
| Size | 461.0 MB | 94.0 MB |
| Events in quadrant A | 3,340,959 | 633,420 |
| Events in quadrant B | 3,529,089 | 644,461 |
| Events in quadrant C | 3,356,962 | 623,395 |
| Events in quadrant D | 3,939,662 | 599,579 |
| Mode M9 | |||
|---|---|---|---|
| Quadrant | BADHDUFLAG | Total packets | Discarded packets |
| A | 0 | 18 | 0 |
| B | 0 | 19 | 0 |
| C | 0 | 19 | 0 |
| D | 0 | 19 | 0 |
| Mode M0 | |||
|---|---|---|---|
| Quadrant | BADHDUFLAG | Total packets | Discarded packets |
| A | 0 | 14475 | 2 |
| B | 0 | 14949 | 2 |
| C | 0 | 14460 | 2 |
| D | 0 | 16401 | 2 |
| Mode SS | |||
|---|---|---|---|
| Quadrant | BADHDUFLAG | Total packets | Discarded packets |
| A | 0 | 140 | 0 |
| B | 0 | 140 | 0 |
| C | 0 | 140 | 0 |
| D | 0 | 140 | 0 |
| Quadrant | Total seconds | Saturated seconds | Saturation percentage |
|---|---|---|---|
| A | 6947 | 44 | 0.633367% |
| B | 6947 | 75 | 1.079603% |
| C | 6947 | 69 | 0.993234% |
| D | 6947 | 163 | 2.346337% |
Noise dominated data is calculated using 1-second bins in cleaned event files. If a bin has >2000 counts, and if more than 50% of those come from <1% of pixels, then it is considered to be noise-dominated and hence unusable.
| Quadrant | # 1 sec bins | Bins with >0 counts | Bins with >2000 counts | High rate bins dominated by noise | Noise dominated (total time) | Noise dominated (detector-on time) | Marked lightcurve |
|---|---|---|---|---|---|---|---|
| A | 7702 | 6949 | 0 | 0 | 0.00% | 0.00% | 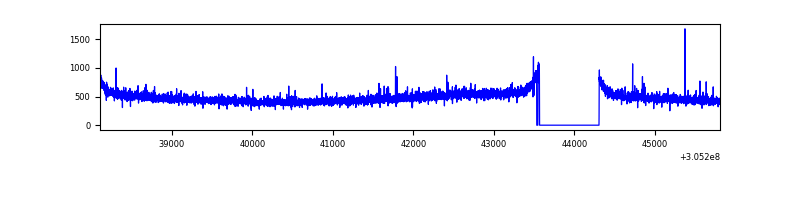 |
| B | 7702 | 6949 | 13 | 13 | 0.17% | 0.19% | 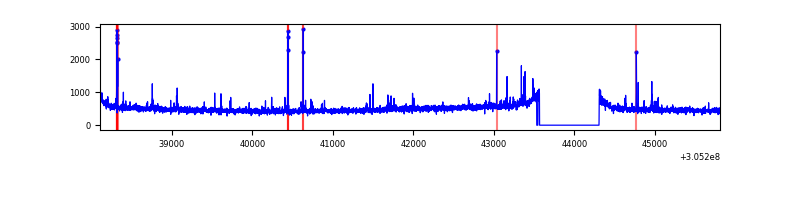 |
| C | 7702 | 6949 | 0 | 0 | 0.00% | 0.00% | 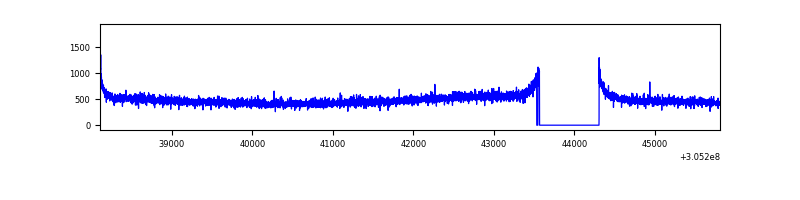 |
| D | 7702 | 6949 | 87 | 87 | 1.13% | 1.25% | 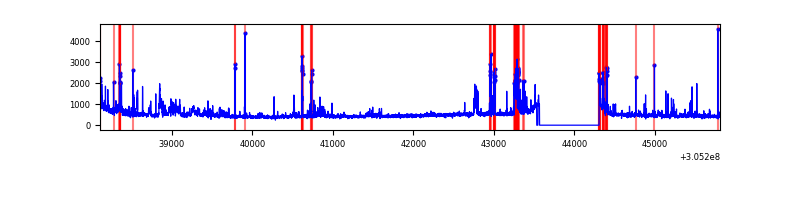 |
Top three noisy pixels from each quadrant. If the there are fewer than three noisy pixels in the level2.evt file, extra rows are filled as -1
| Pixel properties | Quadrant properties | ||||||
|---|---|---|---|---|---|---|---|
| Quadrant | DetID | PixID | Counts | Sigma | Mean | Median | Sigma |
| A | 9 | 143 | 13437 | 72.66 | 857 | 840 | 173.4 |
| A | 13 | 254 | 9889 | 52.19 | 857 | 840 | 173.4 |
| A | 12 | 96 | 8082 | 41.77 | 857 | 840 | 173.4 |
| B | 3 | 64 | 57889 | 344.84 | 856 | 834 | 165.5 |
| B | 0 | 230 | 49041 | 291.36 | 856 | 834 | 165.5 |
| B | 0 | 190 | 41209 | 244.03 | 856 | 834 | 165.5 |
| C | 14 | 238 | 126168 | 652.55 | 819 | 826 | 192.1 |
| C | 3 | 233 | 17960 | 89.2 | 819 | 826 | 192.1 |
| C | 0 | 10 | 13165 | 64.24 | 819 | 826 | 192.1 |
| D | 12 | 235 | 318674 | 1583.18 | 825 | 801 | 200.8 |
| D | 1 | 52 | 94758 | 467.96 | 825 | 801 | 200.8 |
| D | 13 | 174 | 82031 | 404.57 | 825 | 801 | 200.8 |
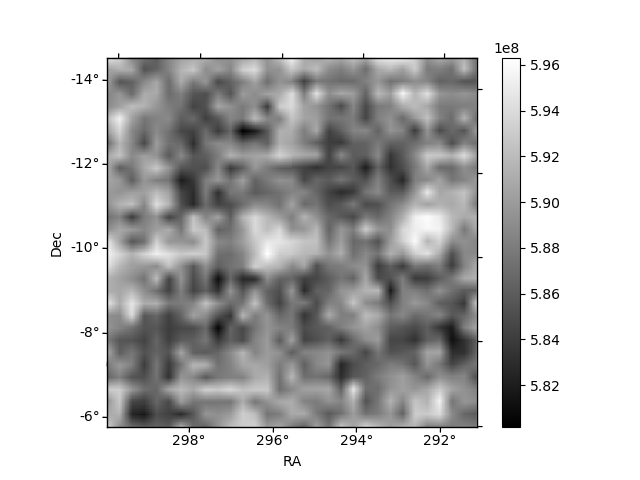
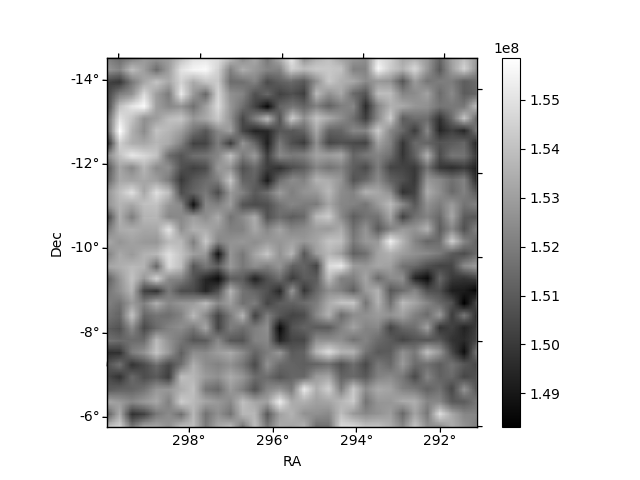
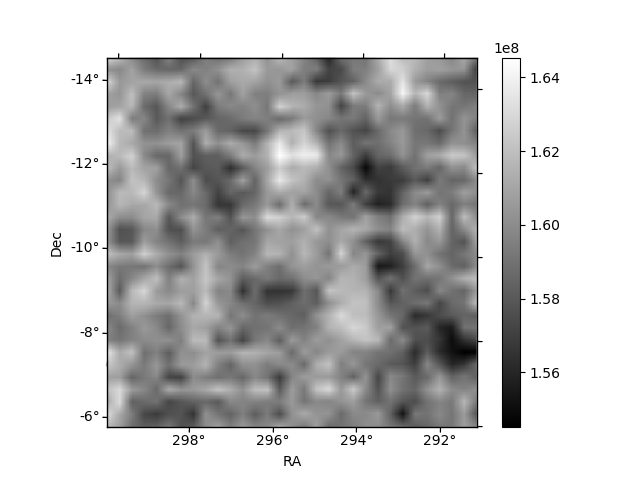
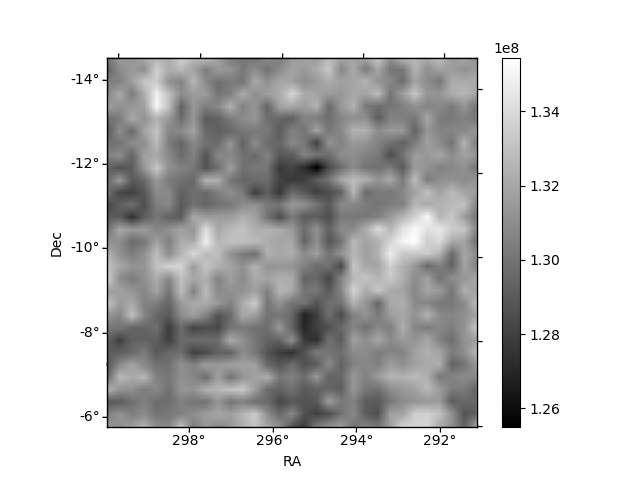
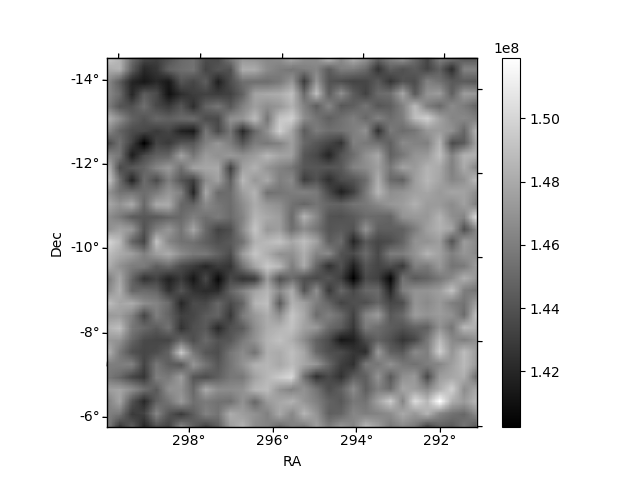
Histogram calculated using DETX and DETY for each event in the final _common_clean file
| Quadrant A | 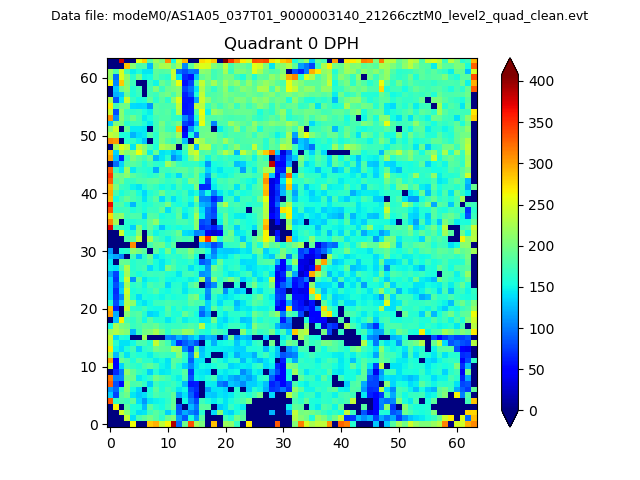 |
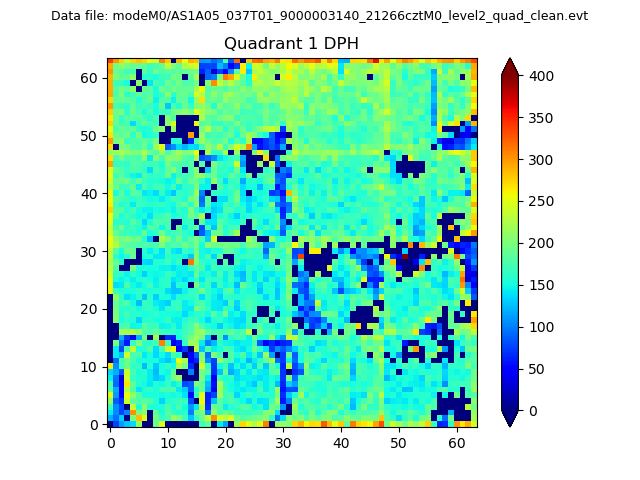 |
Quadrant B |
|---|---|---|---|
| Quadrant D |  |
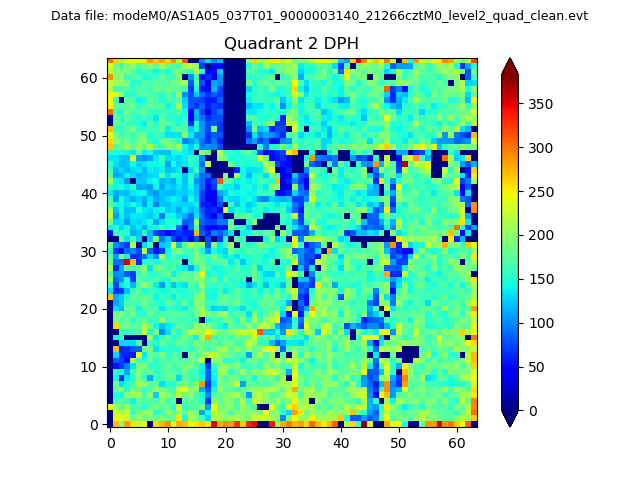 |
Quadrant C |
| Plot type | Count rate plots | Images |
|---|---|---|
| Comparison with Poisson distribution Blue bars denote a histogram of data divided into 1 sec bins. Red curve is a Poisson curve with rate = median count rate of data. |
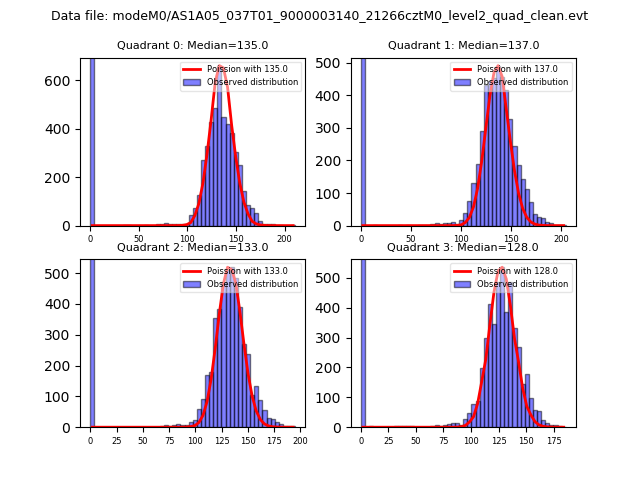 |
 |
| Quadrant-wise count rates Data is divided into 100 sec bins |
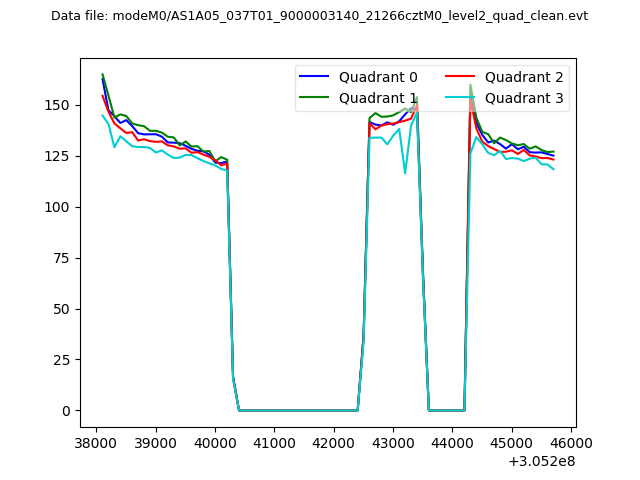 |
|
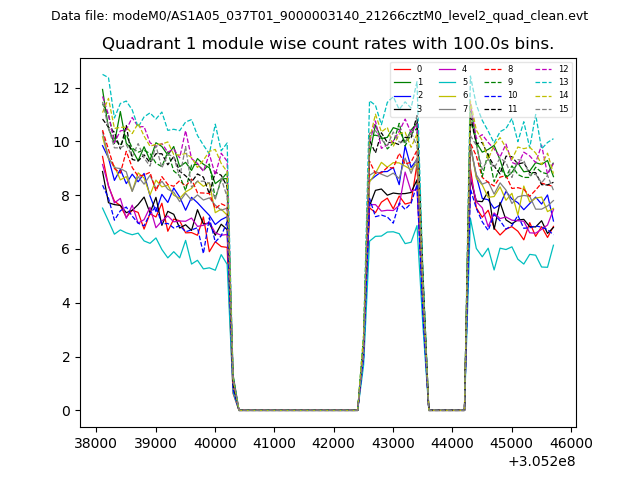
| Module-wise count rates for Quadrant A Data is divided into 100 sec bins |
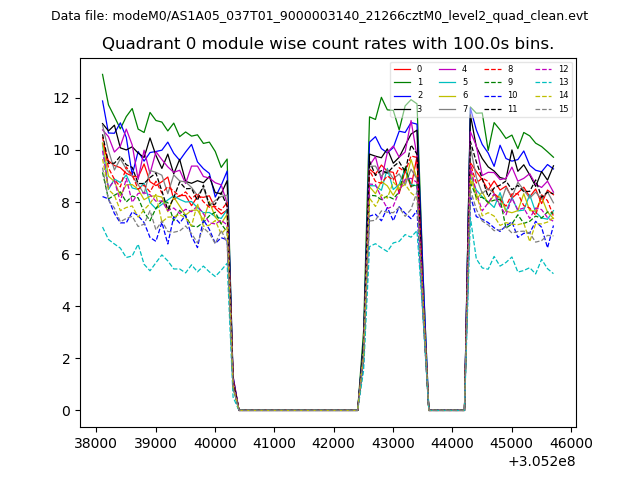 |
 |
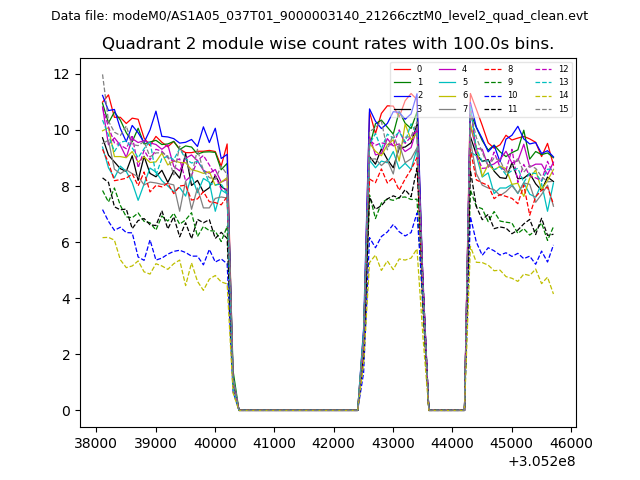
| Module-wise count rates for Quadrant B Data is divided into 100 sec bins |
 |
 |
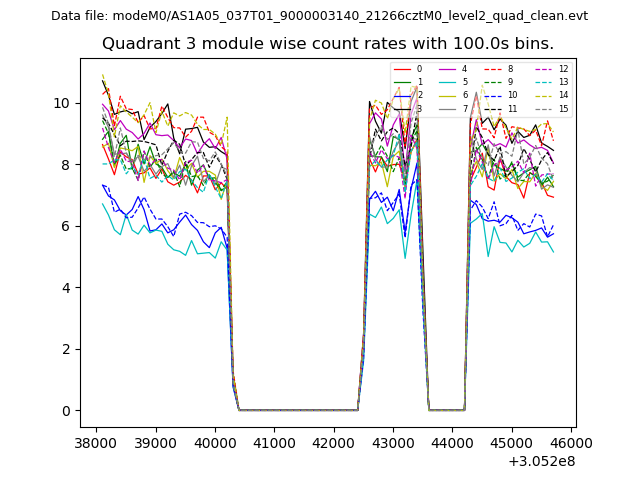
| Module-wise count rates for Quadrant C Data is divided into 100 sec bins |
 |
 |
| Module-wise count rates for Quadrant D Data is divided into 100 sec bins |
 |
 |
| Parameter | Plot |
|---|---|
| CZT HV Monitor | 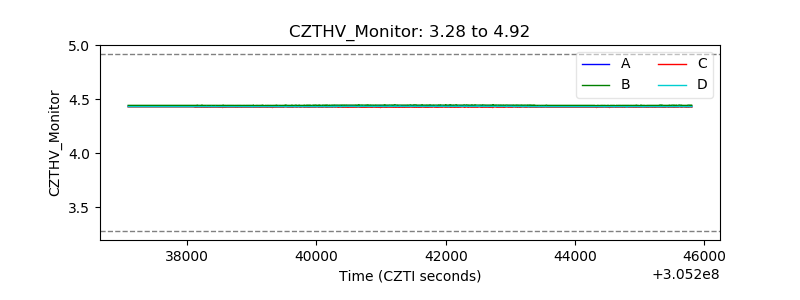 |
| D_VDD | 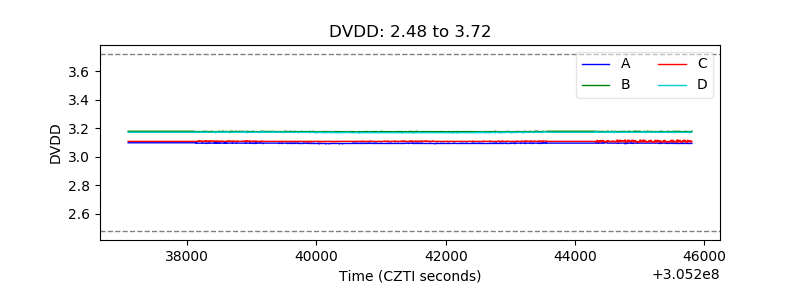 |
| Temperature 1 | 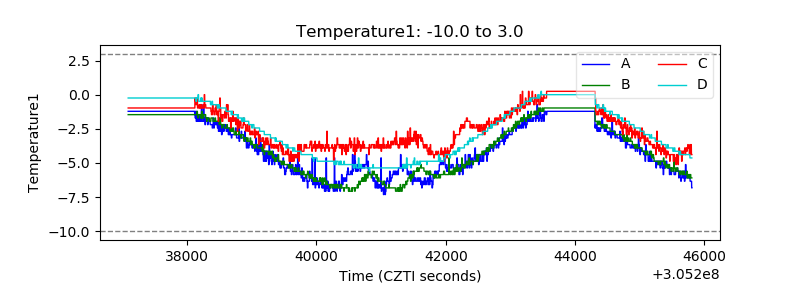 |
| Veto HV Monitor | 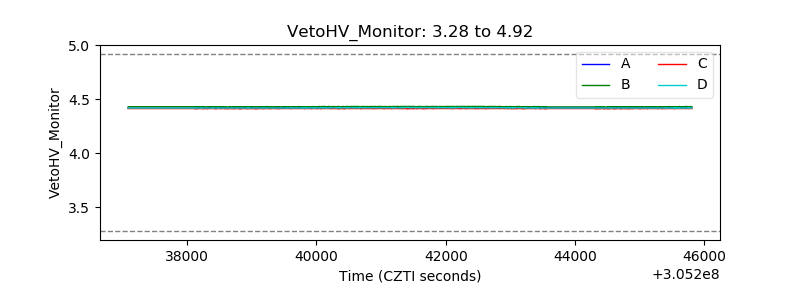 |
| Veto LLD | 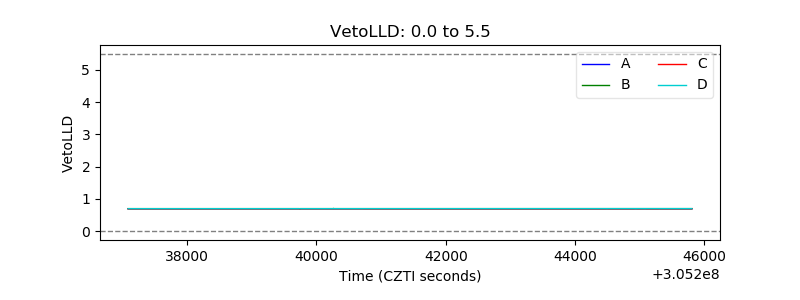 |
| Alpha Counter | 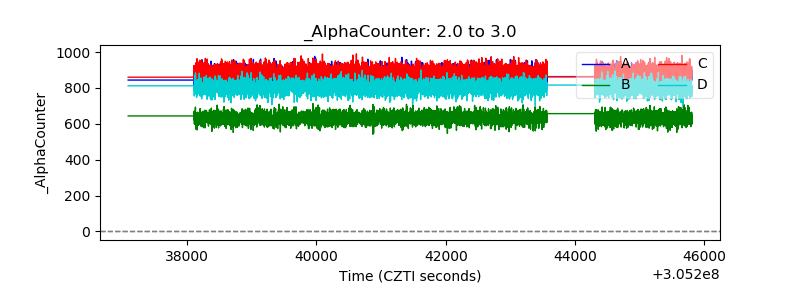 |
| _CPM_Rate | 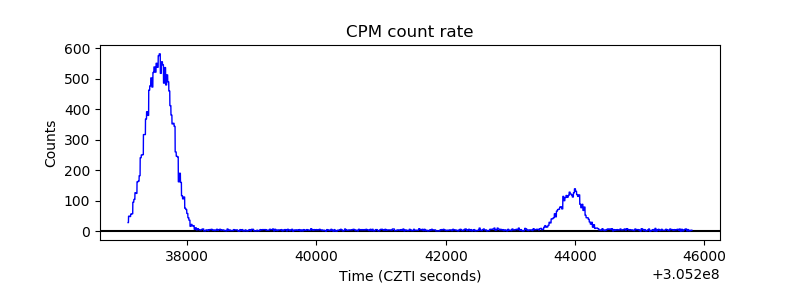 |
| CZT Counter | 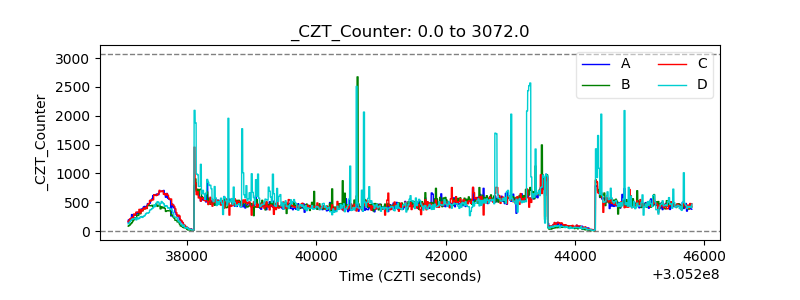 |
| +2.5 Volts monitor |  |
| +5 Volts monitor | 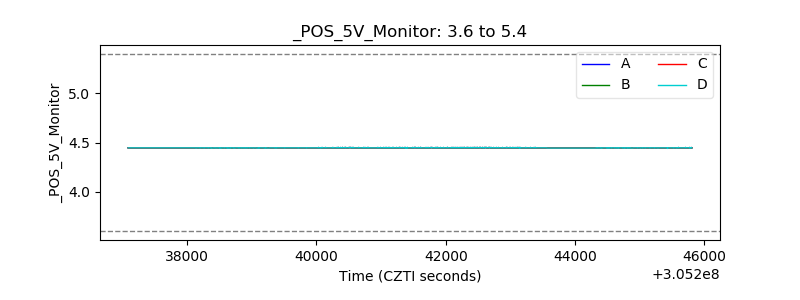 |
| _ROLL_ROT | 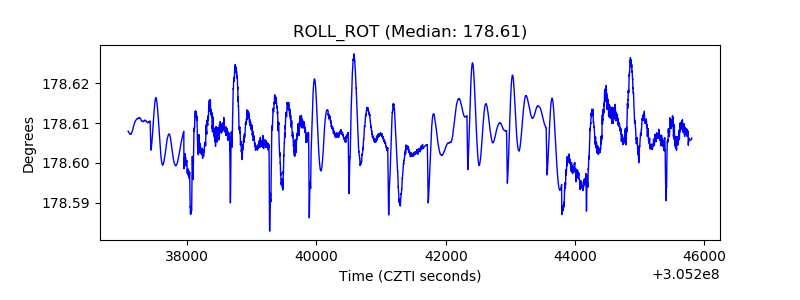 |
| _Roll_DEC | 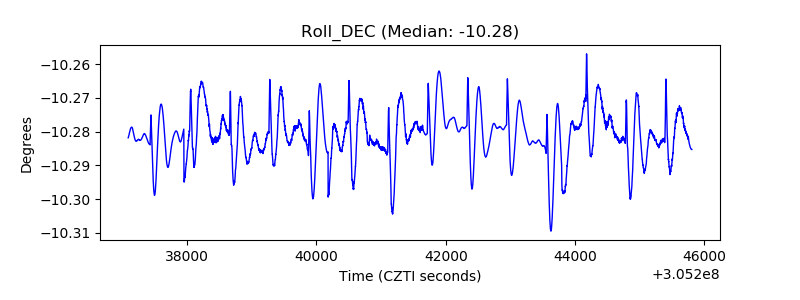 |
| _Roll_RA | 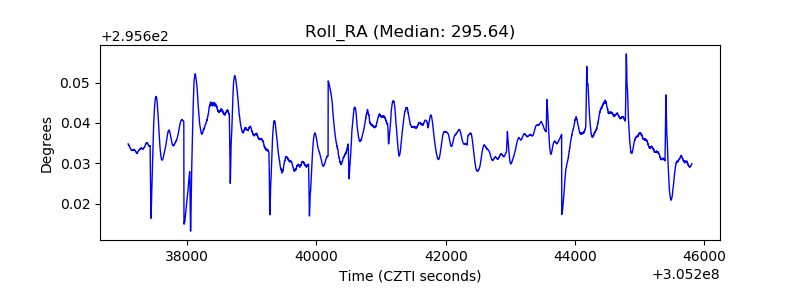 |
| Veto Counter | 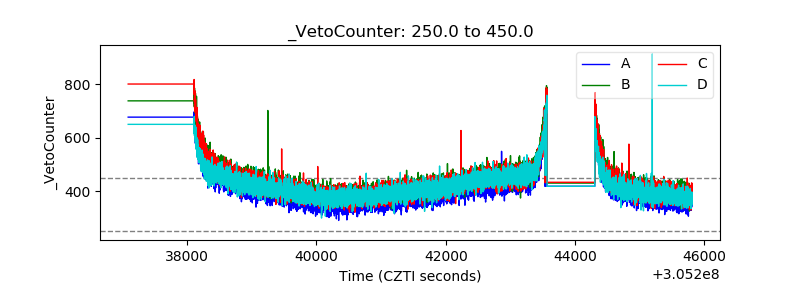 |