| Param | Original file | Final file |
|---|---|---|
| Filename | modeM0/AS1A05_037T01_9000003140_21269cztM0_level2.evt | modeM0/AS1A05_037T01_9000003140_21269cztM0_level2_quad_clean.evt |
| Size (bytes) | 705,859,200 | 98,161,920 |
| Size | 673.2 MB | 93.6 MB |
| Events in quadrant A | 3,794,015 | 618,119 |
| Events in quadrant B | 3,996,498 | 628,717 |
| Events in quadrant C | 3,825,549 | 612,438 |
| Events in quadrant D | 9,215,860 | 553,315 |
| Mode M9 | |||
|---|---|---|---|
| Quadrant | BADHDUFLAG | Total packets | Discarded packets |
| A | 0 | 7 | 0 |
| B | 0 | 7 | 0 |
| C | 0 | 7 | 0 |
| D | 0 | 7 | 0 |
| Mode M0 | |||
|---|---|---|---|
| Quadrant | BADHDUFLAG | Total packets | Discarded packets |
| A | 0 | 16641 | 2 |
| B | 0 | 17075 | 2 |
| C | 0 | 16635 | 2 |
| D | 0 | 32958 | 2 |
| Mode SS | |||
|---|---|---|---|
| Quadrant | BADHDUFLAG | Total packets | Discarded packets |
| A | 0 | 164 | 0 |
| B | 0 | 164 | 0 |
| C | 0 | 164 | 0 |
| D | 0 | 164 | 0 |
| Quadrant | Total seconds | Saturated seconds | Saturation percentage |
|---|---|---|---|
| A | 8056 | 83 | 1.030288% |
| B | 8057 | 124 | 1.539034% |
| C | 8057 | 125 | 1.551446% |
| D | 8057 | 1354 | 16.805263% |
Noise dominated data is calculated using 1-second bins in cleaned event files. If a bin has >2000 counts, and if more than 50% of those come from <1% of pixels, then it is considered to be noise-dominated and hence unusable.
| Quadrant | # 1 sec bins | Bins with >0 counts | Bins with >2000 counts | High rate bins dominated by noise | Noise dominated (total time) | Noise dominated (detector-on time) | Marked lightcurve |
|---|---|---|---|---|---|---|---|
| A | 8681 | 8058 | 0 | 0 | 0.00% | 0.00% | 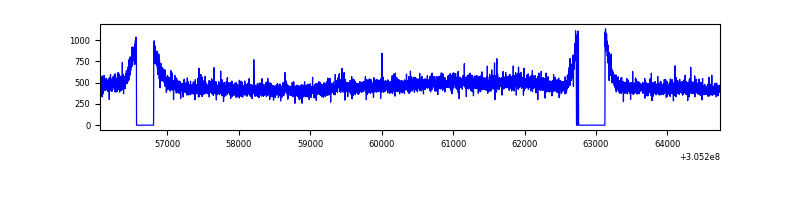 |
| B | 8682 | 8059 | 11 | 11 | 0.13% | 0.14% | 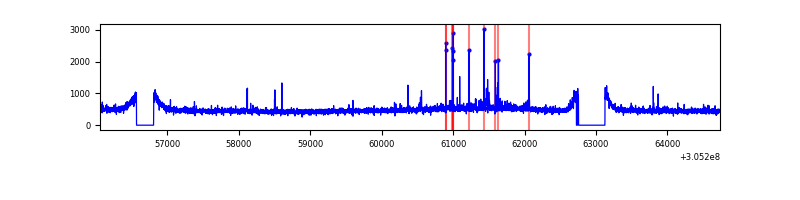 |
| C | 8682 | 8060 | 1 | 1 | 0.01% | 0.01% |  |
| D | 8682 | 8060 | 1453 | 1453 | 16.74% | 18.03% | 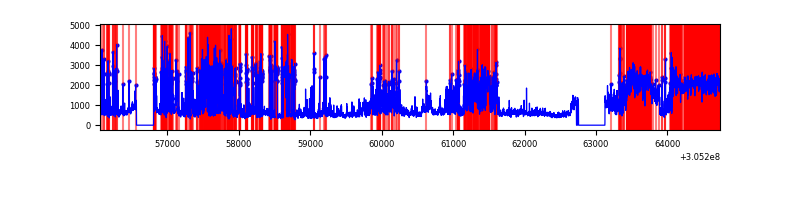 |
Top three noisy pixels from each quadrant. If the there are fewer than three noisy pixels in the level2.evt file, extra rows are filled as -1
| Pixel properties | Quadrant properties | ||||||
|---|---|---|---|---|---|---|---|
| Quadrant | DetID | PixID | Counts | Sigma | Mean | Median | Sigma |
| A | 13 | 254 | 11952 | 54.76 | 980 | 955 | 200.8 |
| A | 13 | 252 | 11106 | 50.55 | 980 | 955 | 200.8 |
| A | 0 | 226 | 8466 | 37.4 | 980 | 955 | 200.8 |
| B | 0 | 197 | 36422 | 185.15 | 982 | 956 | 191.6 |
| B | 3 | 64 | 33892 | 171.94 | 982 | 956 | 191.6 |
| B | 12 | 111 | 22854 | 114.32 | 982 | 956 | 191.6 |
| C | 14 | 238 | 144530 | 645.25 | 941 | 945 | 222.5 |
| C | 0 | 207 | 7073 | 27.54 | 941 | 945 | 222.5 |
| C | 13 | 61 | 6541 | 25.15 | 941 | 945 | 222.5 |
| D | 13 | 174 | 3220743 | 14583.11 | 901 | 874 | 220.8 |
| D | 1 | 52 | 2004083 | 9072.74 | 901 | 874 | 220.8 |
| D | 1 | 20 | 317581 | 1434.4 | 901 | 874 | 220.8 |
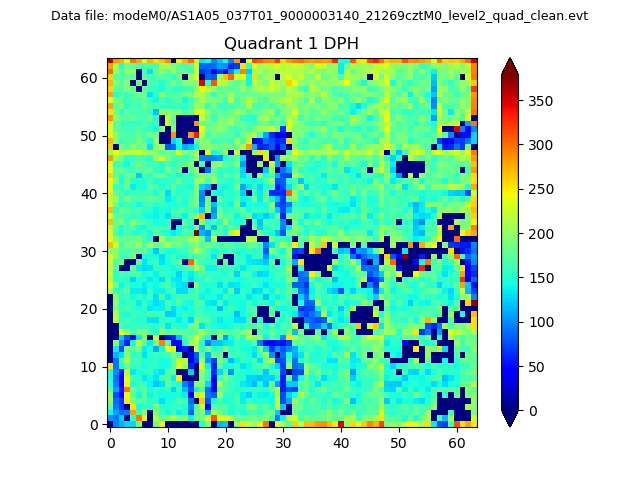
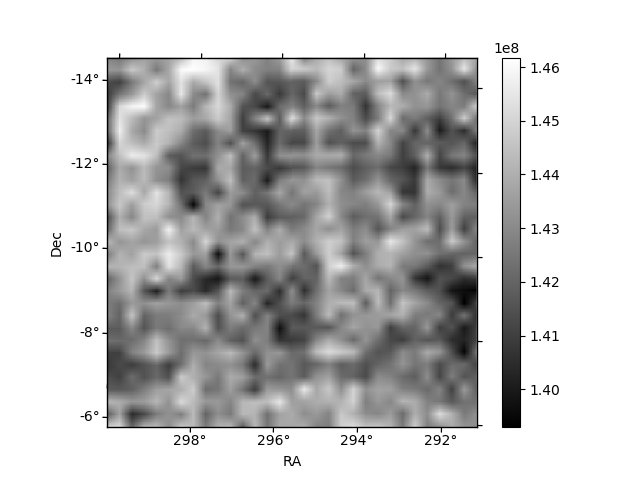
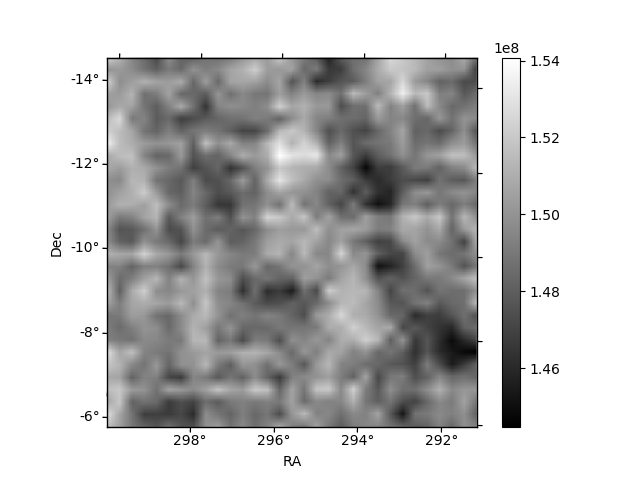
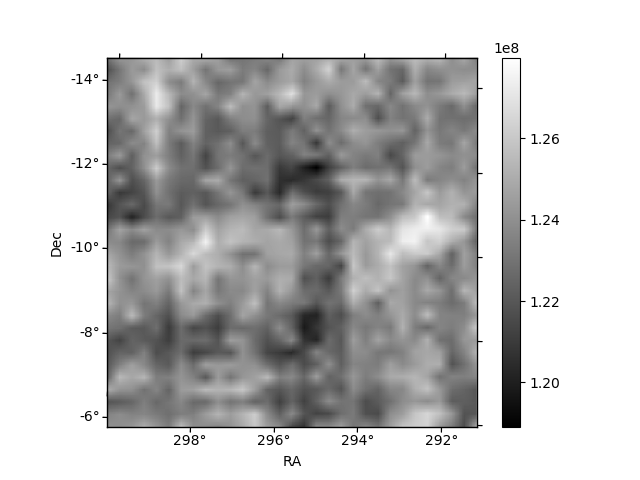
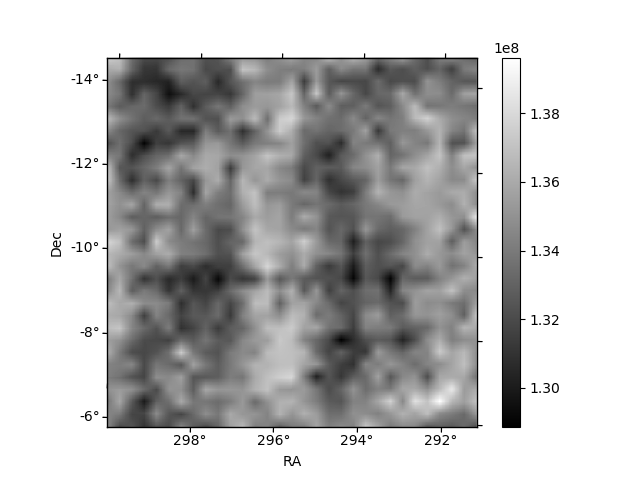
Histogram calculated using DETX and DETY for each event in the final _common_clean file
| Quadrant A | 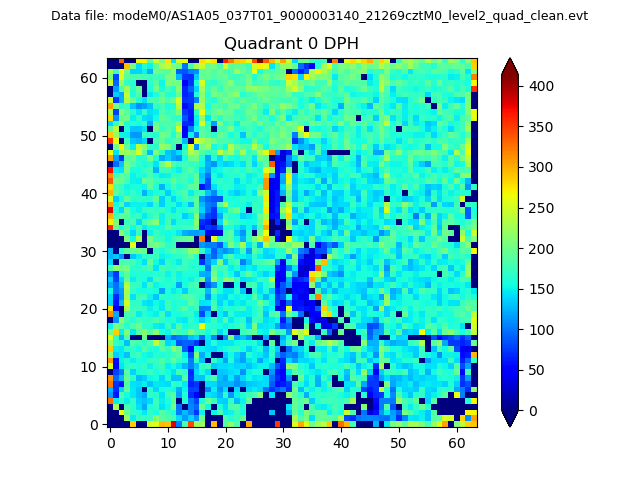 |
 |
Quadrant B |
|---|---|---|---|
| Quadrant D | 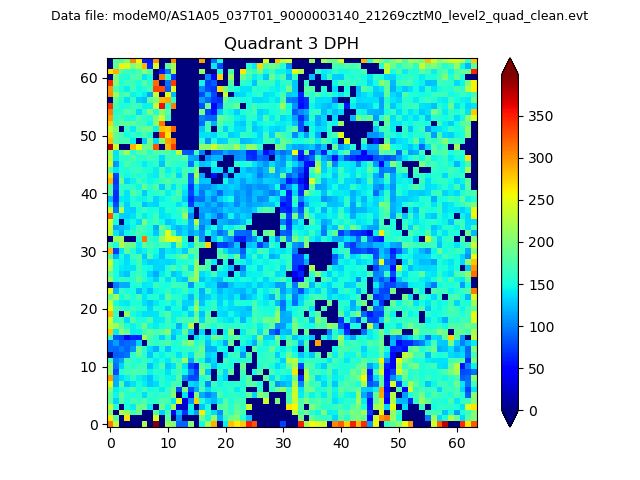 |
 |
Quadrant C |
| Plot type | Count rate plots | Images |
|---|---|---|
| Comparison with Poisson distribution Blue bars denote a histogram of data divided into 1 sec bins. Red curve is a Poisson curve with rate = median count rate of data. |
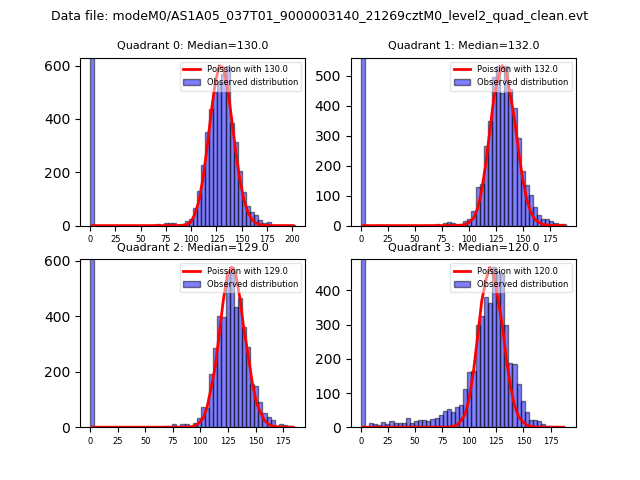 |
 |
| Quadrant-wise count rates Data is divided into 100 sec bins |
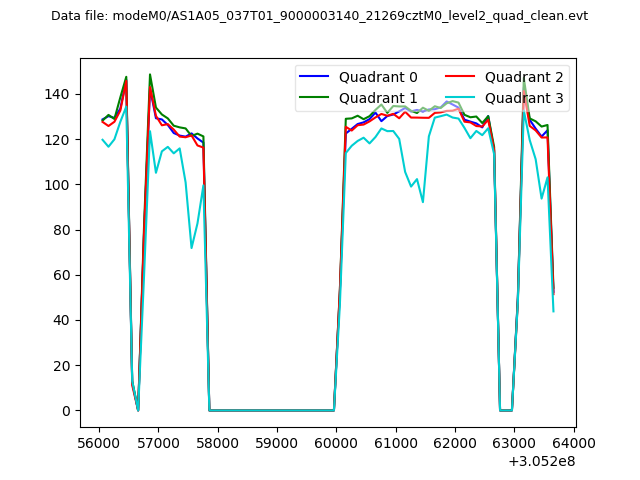 |
|
| Module-wise count rates for Quadrant A Data is divided into 100 sec bins |
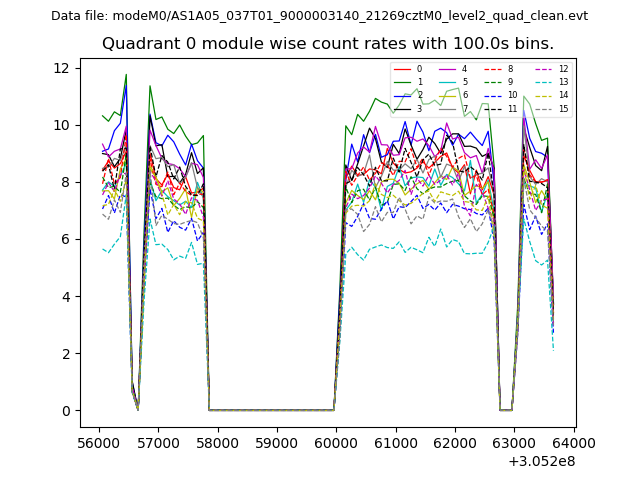 |
 |
| Module-wise count rates for Quadrant B Data is divided into 100 sec bins |
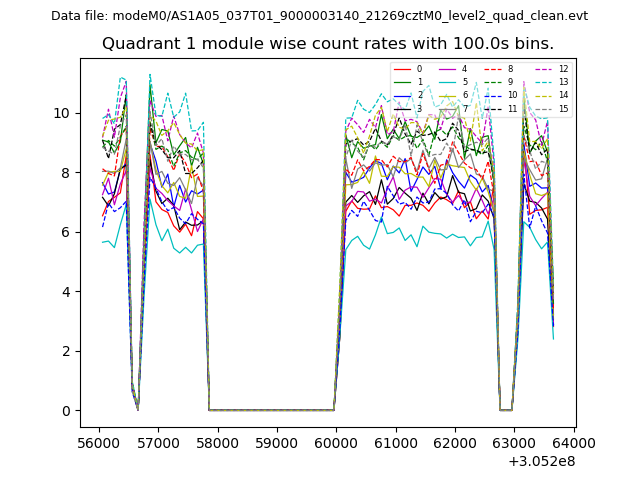 |
 |
| Module-wise count rates for Quadrant C Data is divided into 100 sec bins |
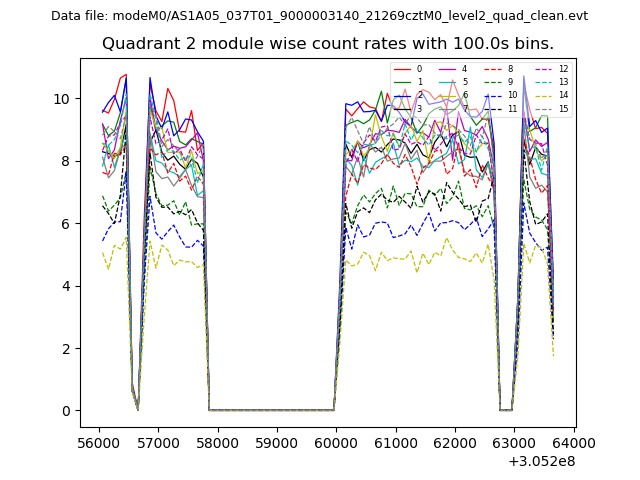 |
 |
| Module-wise count rates for Quadrant D Data is divided into 100 sec bins |
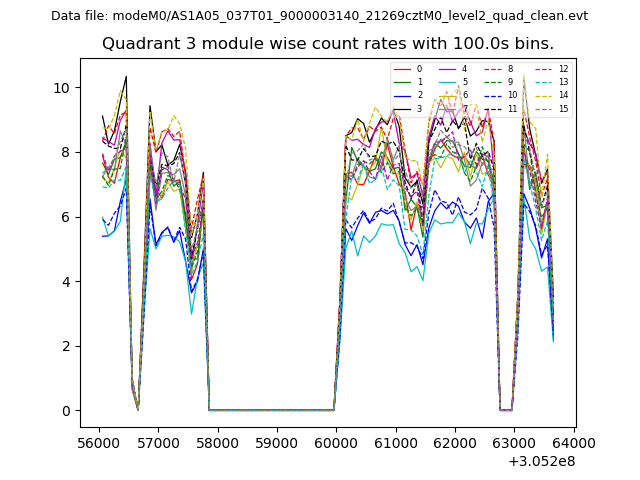 |
 |
| Parameter | Plot |
|---|---|
| CZT HV Monitor | 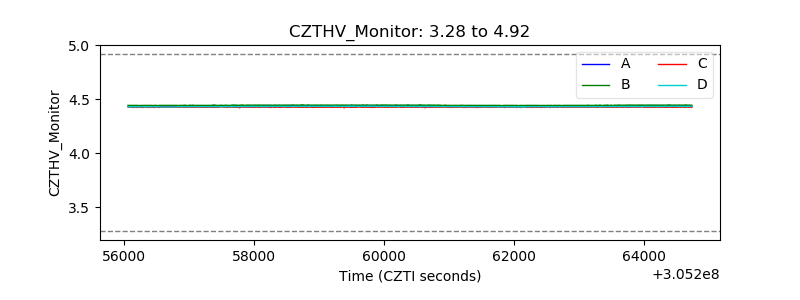 |
| D_VDD | 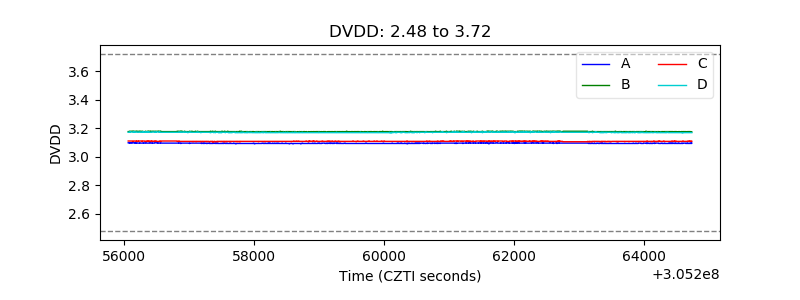 |
| Temperature 1 |  |
| Veto HV Monitor | 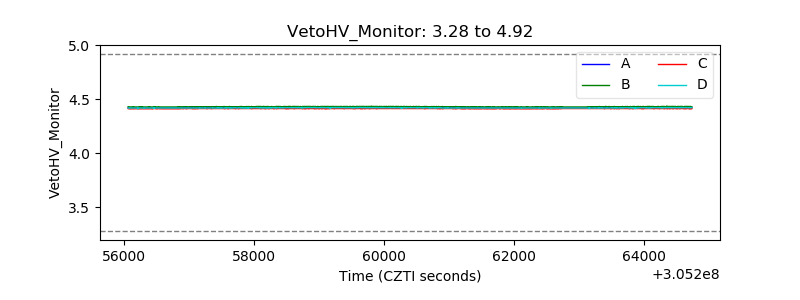 |
| Veto LLD | 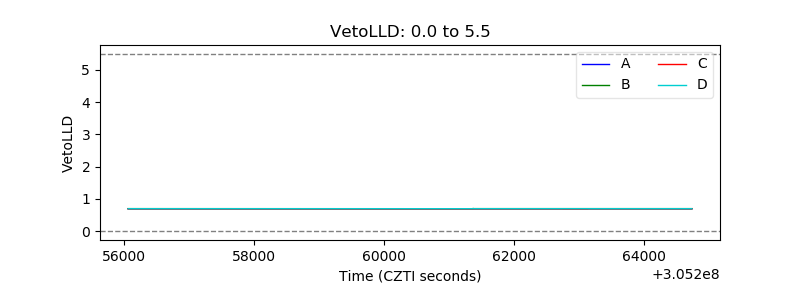 |
| Alpha Counter | 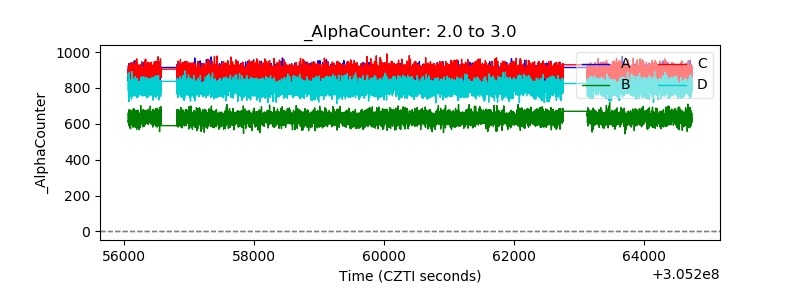 |
| _CPM_Rate | 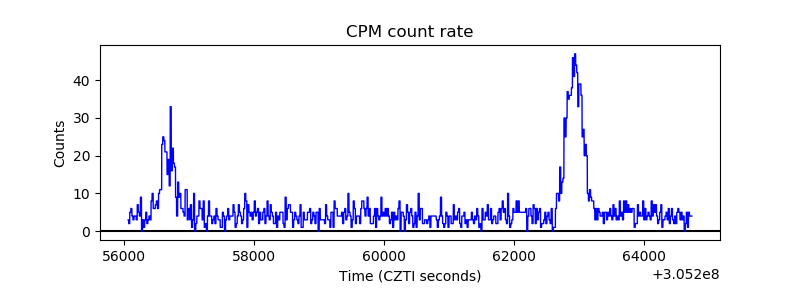 |
| CZT Counter |  |
| +2.5 Volts monitor |  |
| +5 Volts monitor | 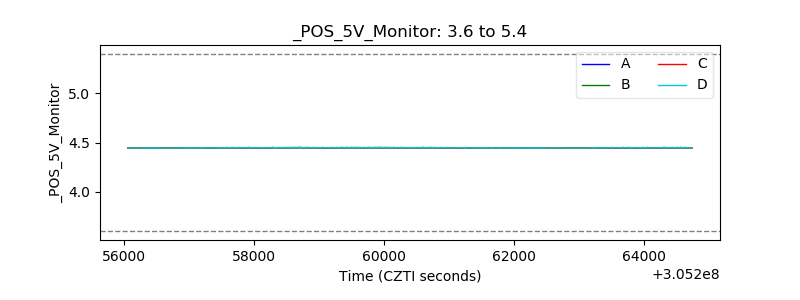 |
| _ROLL_ROT | 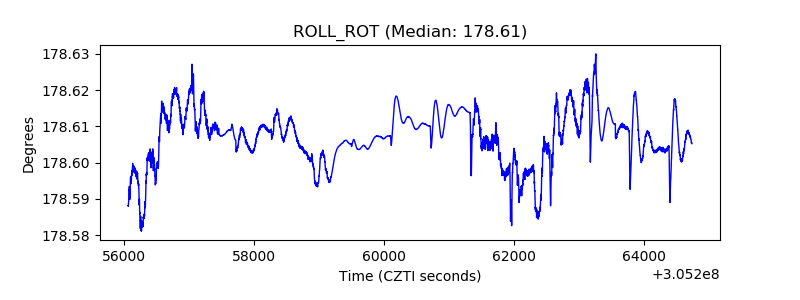 |
| _Roll_DEC | 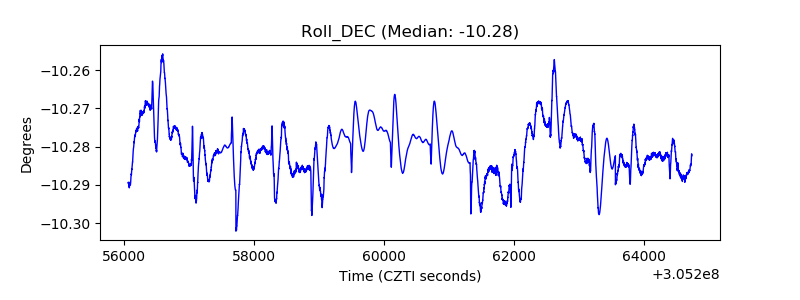 |
| _Roll_RA |  |
| Veto Counter | 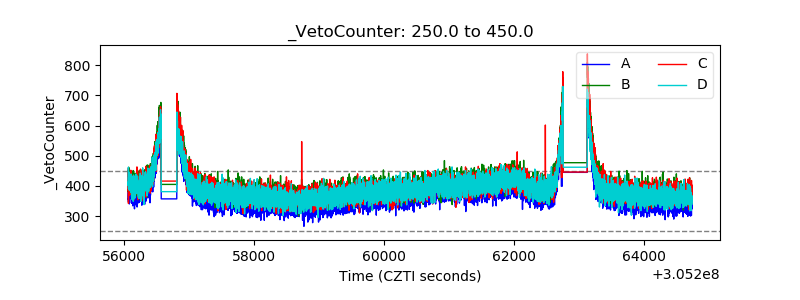 |