| Param | Original file | Final file |
|---|---|---|
| Filename | modeM0/AS1A05_037T01_9000003140_21271cztM0_level2.evt | modeM0/AS1A05_037T01_9000003140_21271cztM0_level2_quad_clean.evt |
| Size (bytes) | 1,226,767,680 | 143,490,240 |
| Size | 1.1 GB | 136.8 MB |
| Events in quadrant A | 6,130,718 | 883,206 |
| Events in quadrant B | 6,427,230 | 897,739 |
| Events in quadrant C | 6,245,402 | 877,159 |
| Events in quadrant D | 17,470,924 | 786,135 |
| Mode M9 | |||
|---|---|---|---|
| Quadrant | BADHDUFLAG | Total packets | Discarded packets |
| A | 0 | 17 | 0 |
| B | 0 | 17 | 0 |
| C | 0 | 17 | 0 |
| D | 0 | 17 | 0 |
| Mode M0 | |||
|---|---|---|---|
| Quadrant | BADHDUFLAG | Total packets | Discarded packets |
| A | 0 | 26708 | 3 |
| B | 0 | 27205 | 3 |
| C | 0 | 26883 | 3 |
| D | 0 | 60864 | 3 |
| Mode SS | |||
|---|---|---|---|
| Quadrant | BADHDUFLAG | Total packets | Discarded packets |
| A | 0 | 266 | 0 |
| B | 0 | 266 | 0 |
| C | 0 | 266 | 0 |
| D | 0 | 266 | 0 |
| Quadrant | Total seconds | Saturated seconds | Saturation percentage |
|---|---|---|---|
| A | 13032 | 106 | 0.813382% |
| B | 13033 | 162 | 1.242999% |
| C | 13032 | 173 | 1.327502% |
| D | 13032 | 2736 | 20.994475% |
Noise dominated data is calculated using 1-second bins in cleaned event files. If a bin has >2000 counts, and if more than 50% of those come from <1% of pixels, then it is considered to be noise-dominated and hence unusable.
| Quadrant | # 1 sec bins | Bins with >0 counts | Bins with >2000 counts | High rate bins dominated by noise | Noise dominated (total time) | Noise dominated (detector-on time) | Marked lightcurve |
|---|---|---|---|---|---|---|---|
| A | 14707 | 13034 | 0 | 0 | 0.00% | 0.00% | 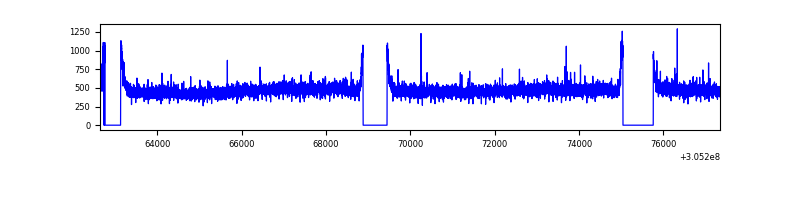 |
| B | 14708 | 13035 | 19 | 19 | 0.13% | 0.15% | 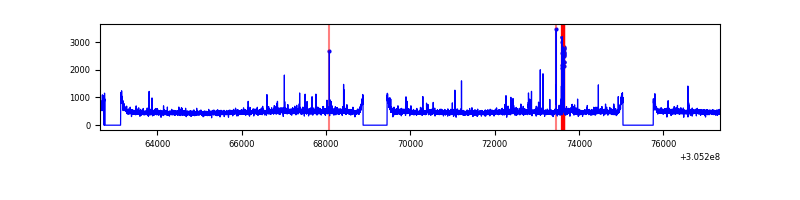 |
| C | 14707 | 13035 | 4 | 4 | 0.03% | 0.03% | 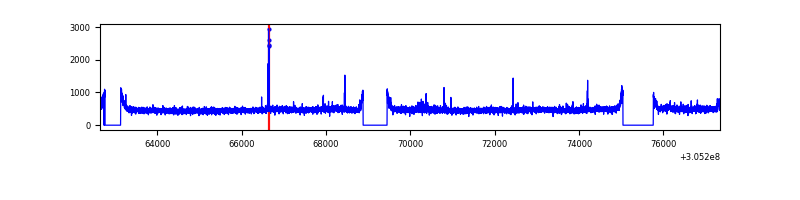 |
| D | 14707 | 13034 | 2808 | 2808 | 19.09% | 21.54% | 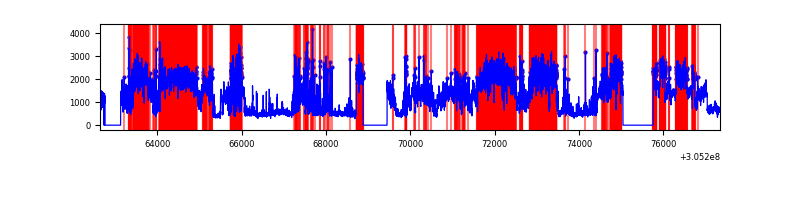 |
Top three noisy pixels from each quadrant. If the there are fewer than three noisy pixels in the level2.evt file, extra rows are filled as -1
| Pixel properties | Quadrant properties | ||||||
|---|---|---|---|---|---|---|---|
| Quadrant | DetID | PixID | Counts | Sigma | Mean | Median | Sigma |
| A | 13 | 254 | 20686 | 60.16 | 1578 | 1544 | 318.2 |
| A | 0 | 226 | 13599 | 37.89 | 1578 | 1544 | 318.2 |
| A | 3 | 137 | 13471 | 37.49 | 1578 | 1544 | 318.2 |
| B | 0 | 190 | 113484 | 367.04 | 1581 | 1539 | 305.0 |
| B | 0 | 230 | 37661 | 118.43 | 1581 | 1539 | 305.0 |
| B | 12 | 111 | 37485 | 117.86 | 1581 | 1539 | 305.0 |
| C | 14 | 238 | 232211 | 647.17 | 1514 | 1523 | 356.5 |
| C | 3 | 233 | 75583 | 207.77 | 1514 | 1523 | 356.5 |
| C | 0 | 207 | 37973 | 102.26 | 1514 | 1523 | 356.5 |
| D | 13 | 174 | 10175052 | 28893.82 | 1453 | 1412 | 352.1 |
| D | 1 | 52 | 928416 | 2632.75 | 1453 | 1412 | 352.1 |
| D | 2 | 16 | 449212 | 1271.78 | 1453 | 1412 | 352.1 |
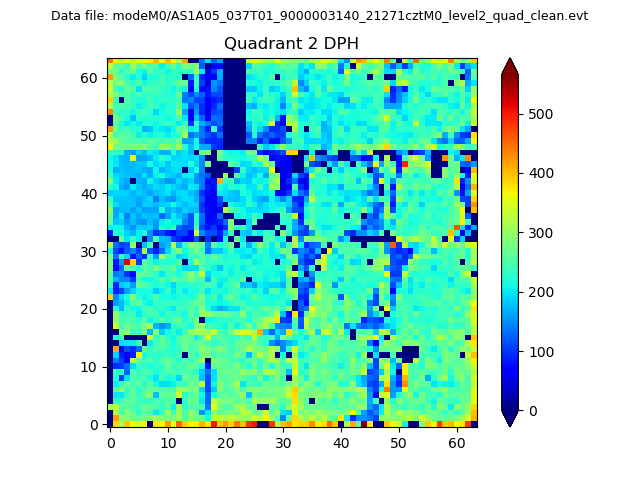
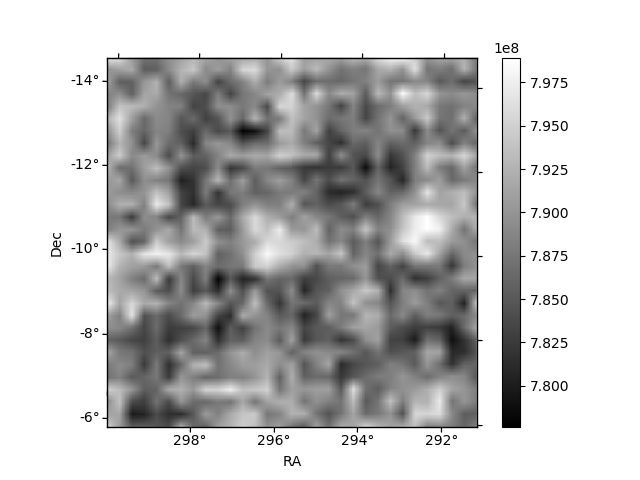
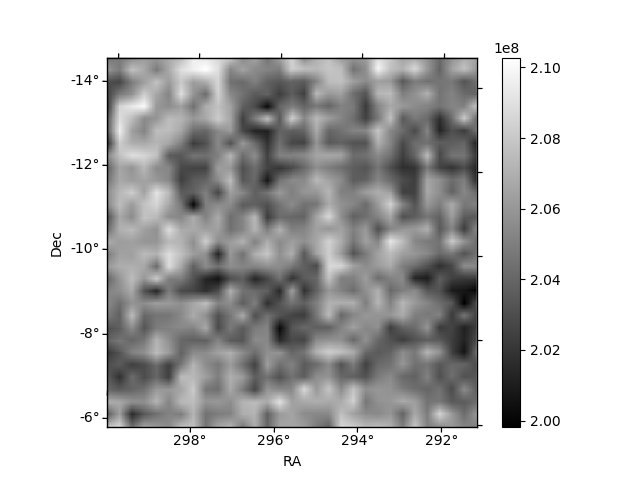
Histogram calculated using DETX and DETY for each event in the final _common_clean file
| Quadrant A | 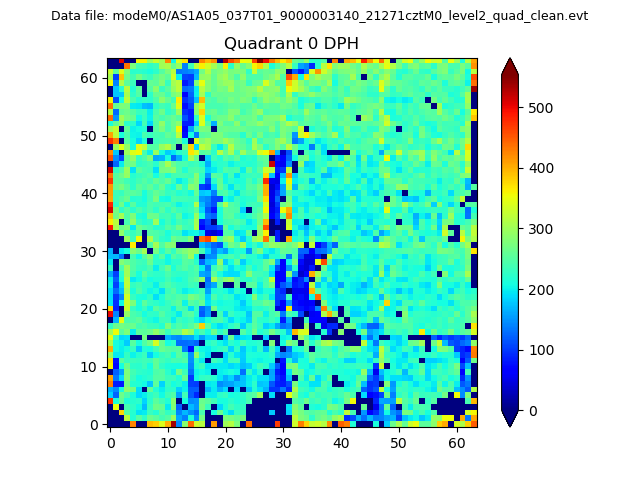 |
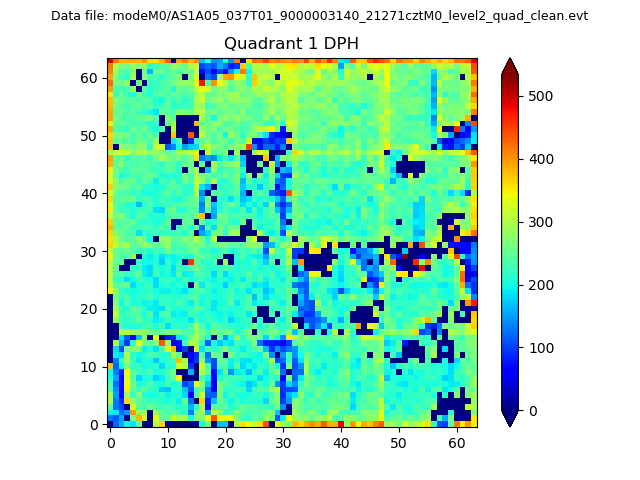 |
Quadrant B |
|---|---|---|---|
| Quadrant D | 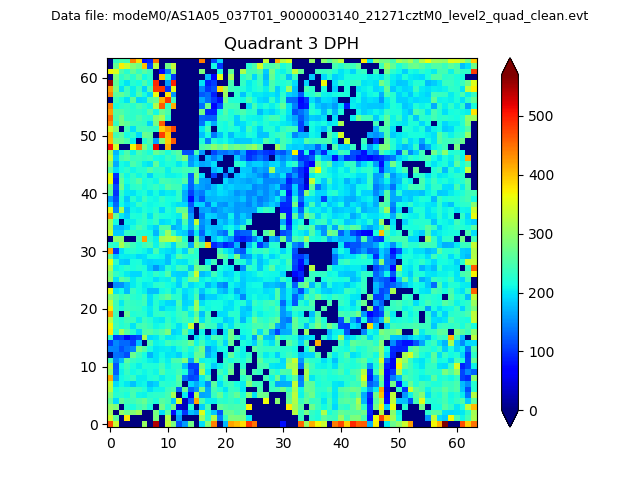 |
 |
Quadrant C |
| Plot type | Count rate plots | Images |
|---|---|---|
| Comparison with Poisson distribution Blue bars denote a histogram of data divided into 1 sec bins. Red curve is a Poisson curve with rate = median count rate of data. |
 |
 |
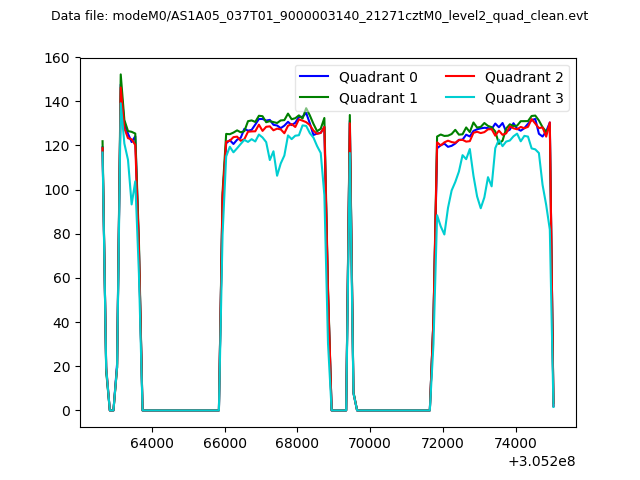
| Quadrant-wise count rates Data is divided into 100 sec bins |
 |
|
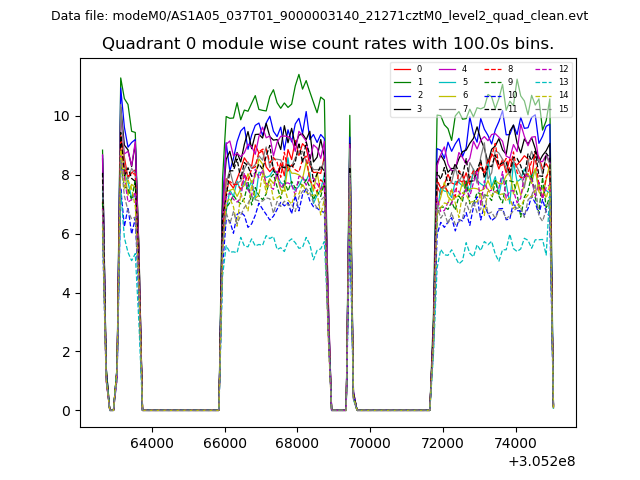
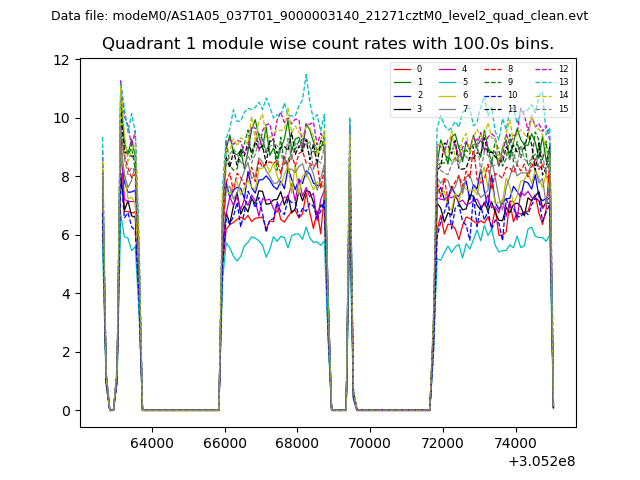
| Module-wise count rates for Quadrant A Data is divided into 100 sec bins |
 |
 |
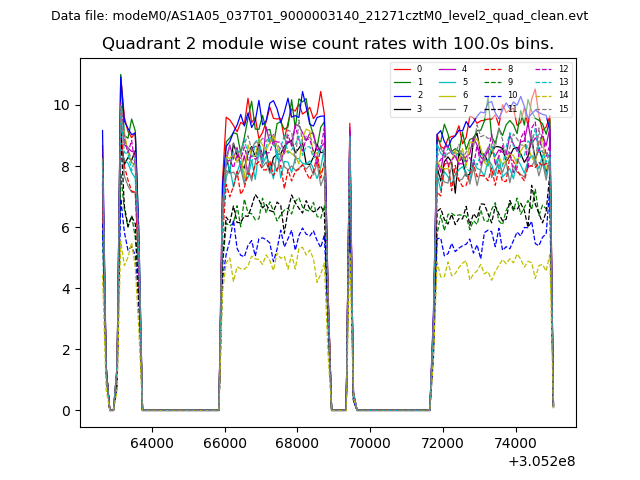
| Module-wise count rates for Quadrant B Data is divided into 100 sec bins |
 |
 |
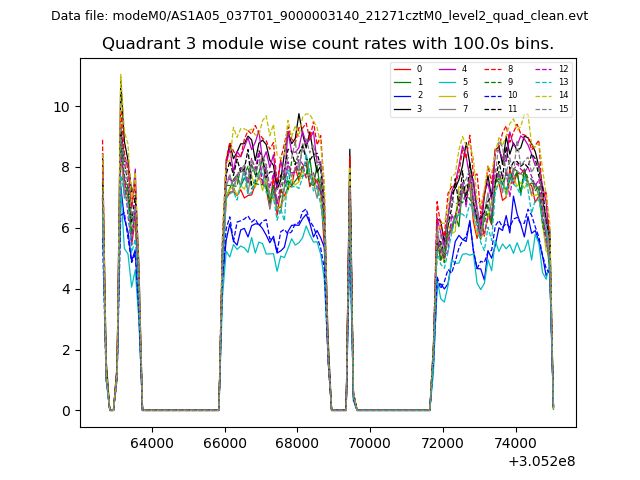
| Module-wise count rates for Quadrant C Data is divided into 100 sec bins |
 |
 |
| Module-wise count rates for Quadrant D Data is divided into 100 sec bins |
 |
 |
| Parameter | Plot |
|---|---|
| CZT HV Monitor |  |
| D_VDD | 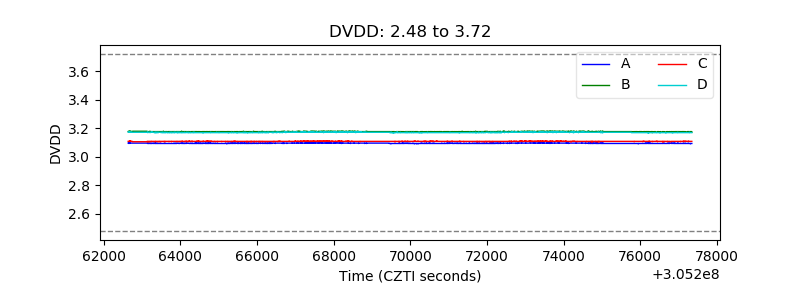 |
| Temperature 1 | 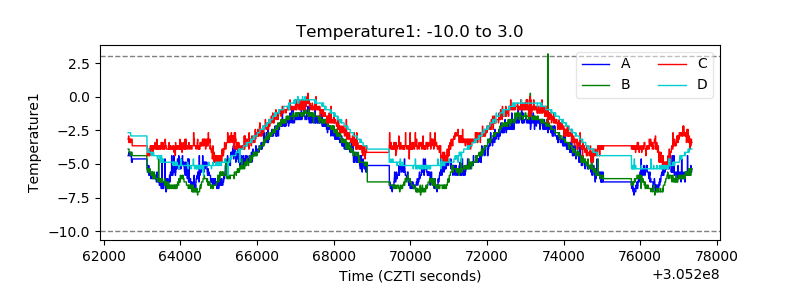 |
| Veto HV Monitor | 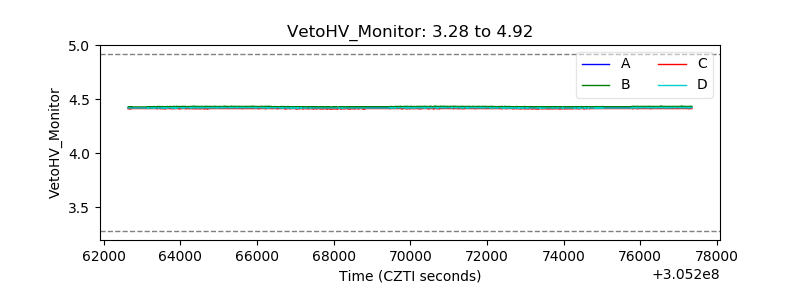 |
| Veto LLD | 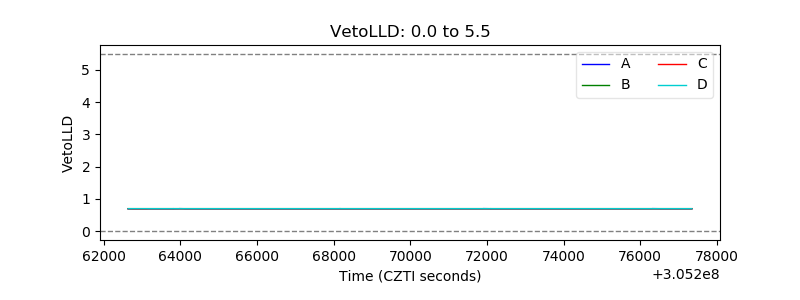 |
| Alpha Counter | 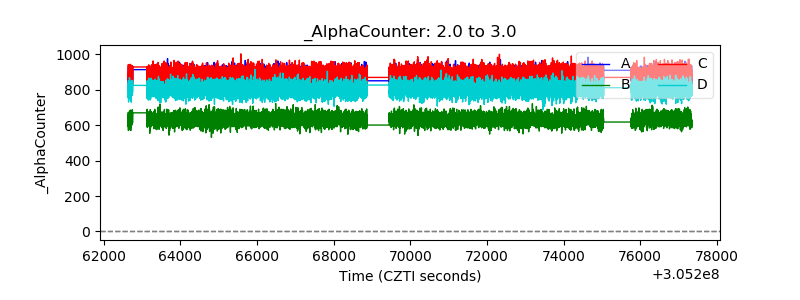 |
| _CPM_Rate | 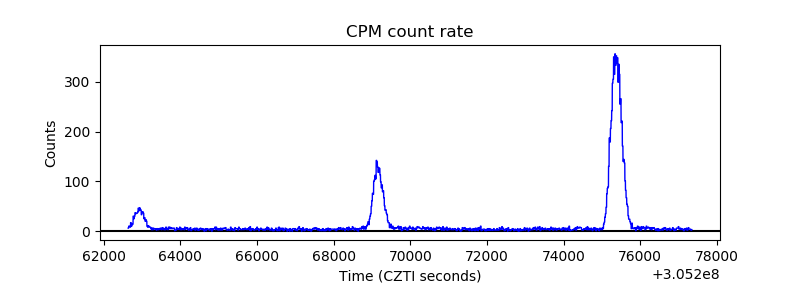 |
| CZT Counter | 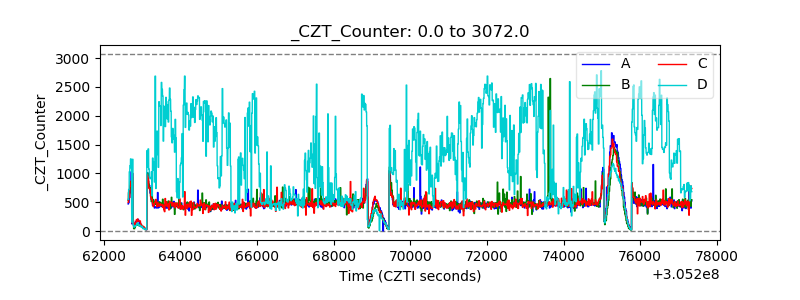 |
| +2.5 Volts monitor |  |
| +5 Volts monitor |  |
| _ROLL_ROT | 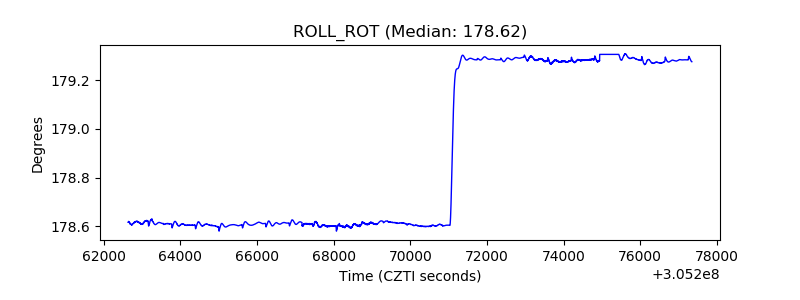 |
| _Roll_DEC | 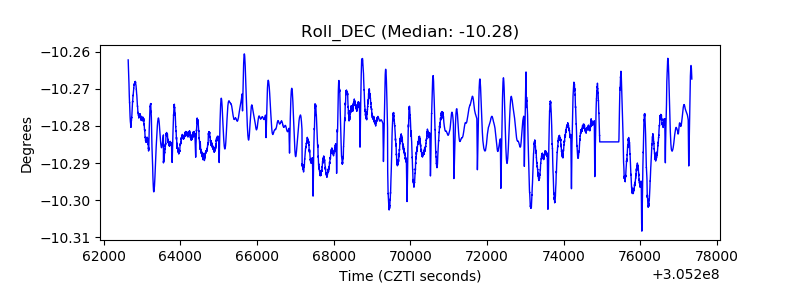 |
| _Roll_RA | 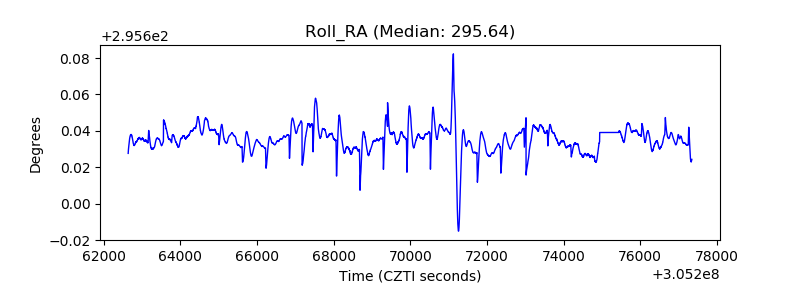 |
| Veto Counter | 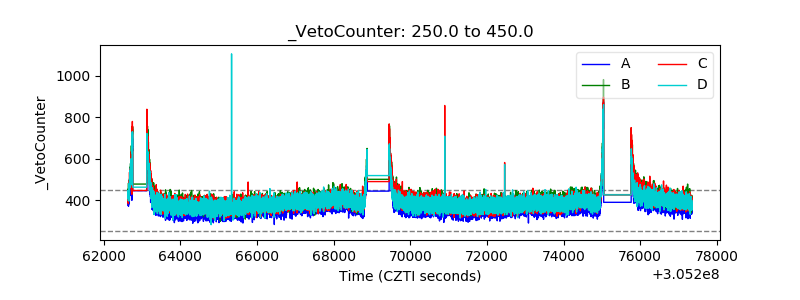 |