| Param | Original file | Final file |
|---|---|---|
| Filename | modeM0/AS1A05_037T01_9000003140_21275cztM0_level2.evt | modeM0/AS1A05_037T01_9000003140_21275cztM0_level2_quad_clean.evt |
| Size (bytes) | 590,123,520 | 91,284,480 |
| Size | 562.8 MB | 87.1 MB |
| Events in quadrant A | 3,514,127 | 605,902 |
| Events in quadrant B | 3,558,614 | 613,784 |
| Events in quadrant C | 3,581,711 | 590,008 |
| Events in quadrant D | 6,771,394 | 495,512 |
| Mode M9 | |||
|---|---|---|---|
| Quadrant | BADHDUFLAG | Total packets | Discarded packets |
| A | 0 | 22 | 0 |
| B | 0 | 22 | 0 |
| C | 0 | 22 | 0 |
| D | 0 | 22 | 0 |
| Mode M0 | |||
|---|---|---|---|
| Quadrant | BADHDUFLAG | Total packets | Discarded packets |
| A | 0 | 14671 | 2 |
| B | 0 | 14717 | 2 |
| C | 0 | 14836 | 2 |
| D | 0 | 24471 | 2 |
| Mode SS | |||
|---|---|---|---|
| Quadrant | BADHDUFLAG | Total packets | Discarded packets |
| A | 0 | 136 | 0 |
| B | 0 | 136 | 0 |
| C | 0 | 136 | 0 |
| D | 0 | 136 | 0 |
| Quadrant | Total seconds | Saturated seconds | Saturation percentage |
|---|---|---|---|
| A | 6577 | 129 | 1.961381% |
| B | 6578 | 141 | 2.143509% |
| C | 6578 | 179 | 2.721192% |
| D | 6578 | 1309 | 19.899666% |
Noise dominated data is calculated using 1-second bins in cleaned event files. If a bin has >2000 counts, and if more than 50% of those come from <1% of pixels, then it is considered to be noise-dominated and hence unusable.
| Quadrant | # 1 sec bins | Bins with >0 counts | Bins with >2000 counts | High rate bins dominated by noise | Noise dominated (total time) | Noise dominated (detector-on time) | Marked lightcurve |
|---|---|---|---|---|---|---|---|
| A | 8772 | 6577 | 5 | 5 | 0.06% | 0.08% | 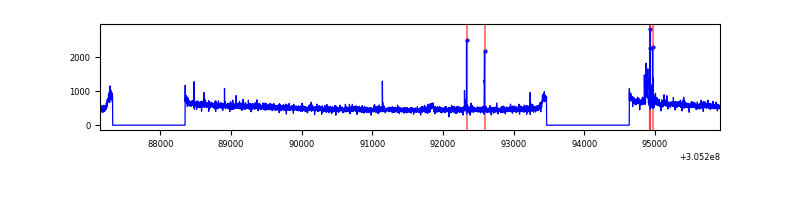 |
| B | 8773 | 6578 | 9 | 9 | 0.10% | 0.14% | 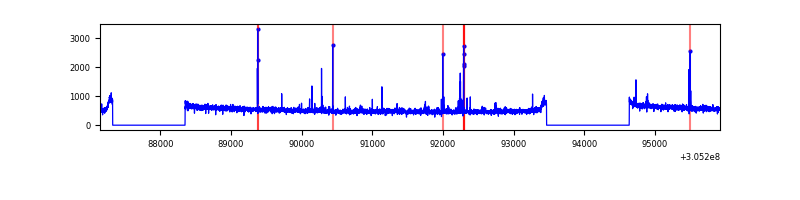 |
| C | 8773 | 6578 | 3 | 3 | 0.03% | 0.05% | 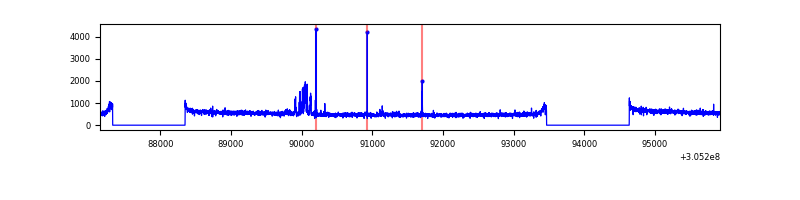 |
| D | 8773 | 6578 | 1144 | 1144 | 13.04% | 17.39% | 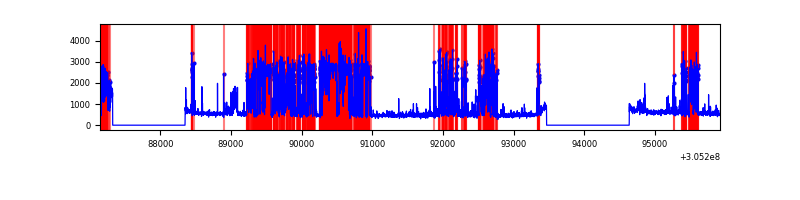 |
Top three noisy pixels from each quadrant. If the there are fewer than three noisy pixels in the level2.evt file, extra rows are filled as -1
| Pixel properties | Quadrant properties | ||||||
|---|---|---|---|---|---|---|---|
| Quadrant | DetID | PixID | Counts | Sigma | Mean | Median | Sigma |
| A | 15 | 236 | 68453 | 378.06 | 893 | 878 | 178.7 |
| A | 13 | 254 | 10208 | 52.2 | 893 | 878 | 178.7 |
| A | 0 | 226 | 7843 | 38.97 | 893 | 878 | 178.7 |
| B | 3 | 64 | 52352 | 308.27 | 879 | 859 | 167.0 |
| B | 12 | 111 | 19810 | 113.45 | 879 | 859 | 167.0 |
| B | 11 | 111 | 17183 | 97.73 | 879 | 859 | 167.0 |
| C | 14 | 238 | 133448 | 681.41 | 841 | 849 | 194.6 |
| C | 0 | 207 | 122540 | 625.35 | 841 | 849 | 194.6 |
| C | 3 | 233 | 42015 | 211.55 | 841 | 849 | 194.6 |
| D | 13 | 174 | 3270092 | 17043.03 | 795 | 771 | 191.8 |
| D | 1 | 52 | 267831 | 1392.19 | 795 | 771 | 191.8 |
| D | 13 | 104 | 49002 | 251.43 | 795 | 771 | 191.8 |
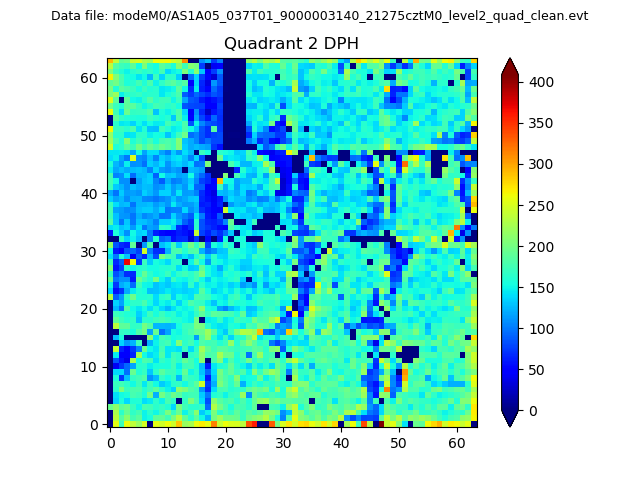
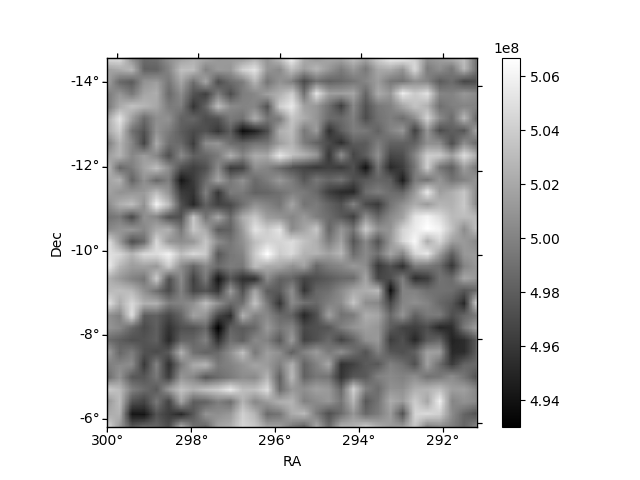
Histogram calculated using DETX and DETY for each event in the final _common_clean file
| Quadrant A | 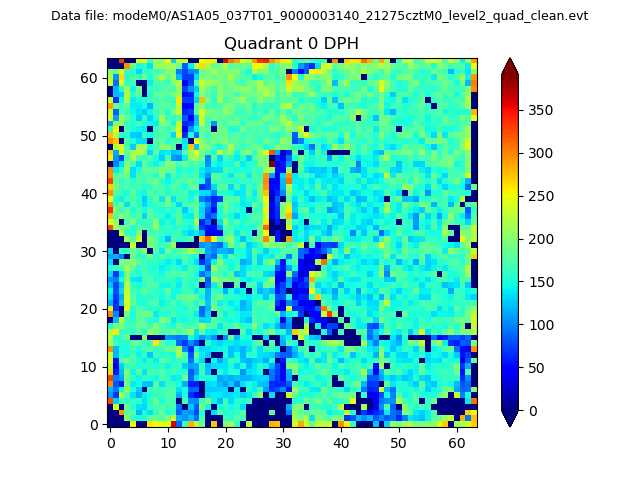 |
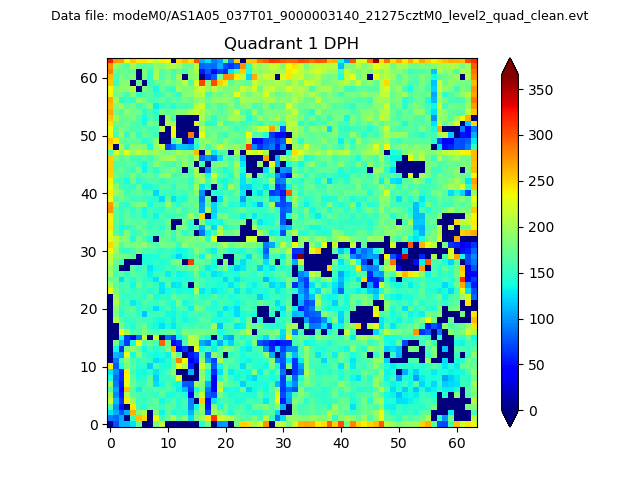 |
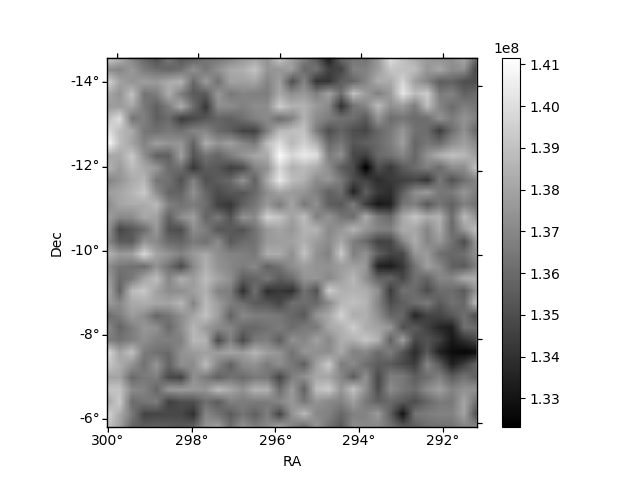
Quadrant B |
|---|---|---|---|
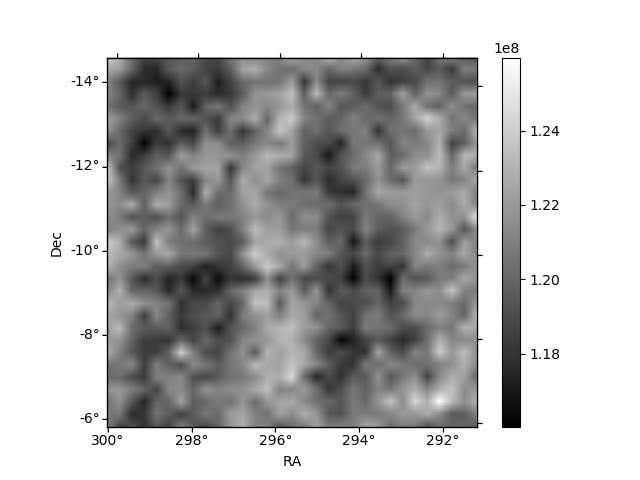
| Quadrant D | 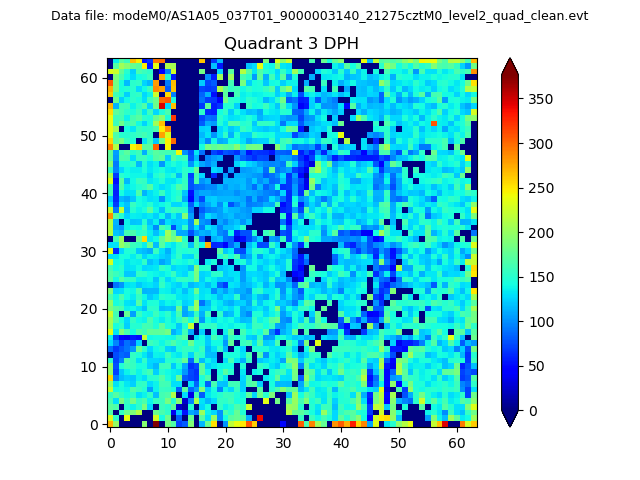 |
 |
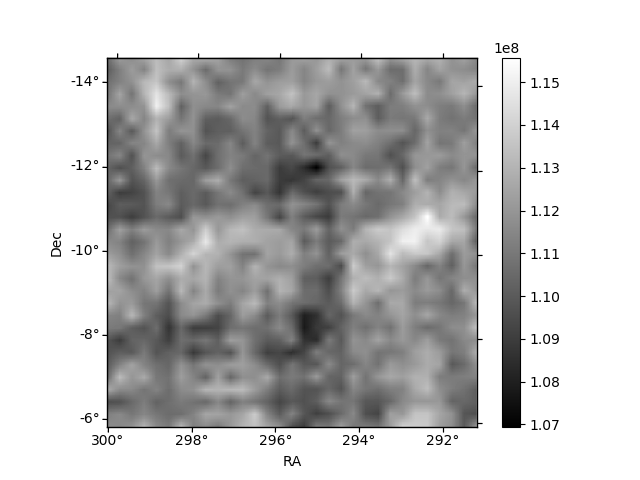
Quadrant C |
| Plot type | Count rate plots | Images |
|---|---|---|
| Comparison with Poisson distribution Blue bars denote a histogram of data divided into 1 sec bins. Red curve is a Poisson curve with rate = median count rate of data. |
 |
 |
| Quadrant-wise count rates Data is divided into 100 sec bins |
 |
|
| Module-wise count rates for Quadrant A Data is divided into 100 sec bins |
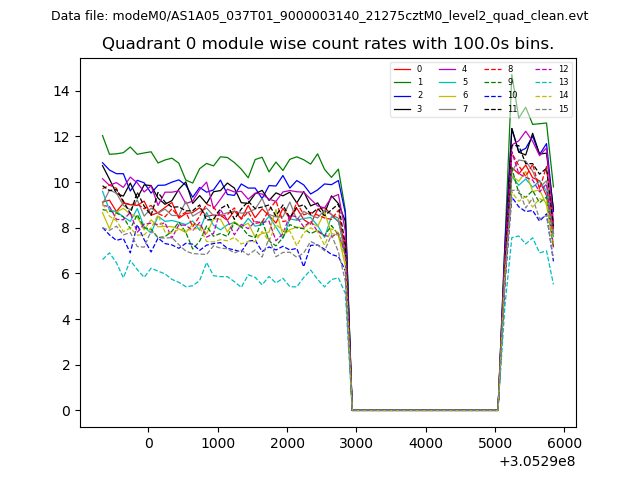 |
 |
| Module-wise count rates for Quadrant B Data is divided into 100 sec bins |
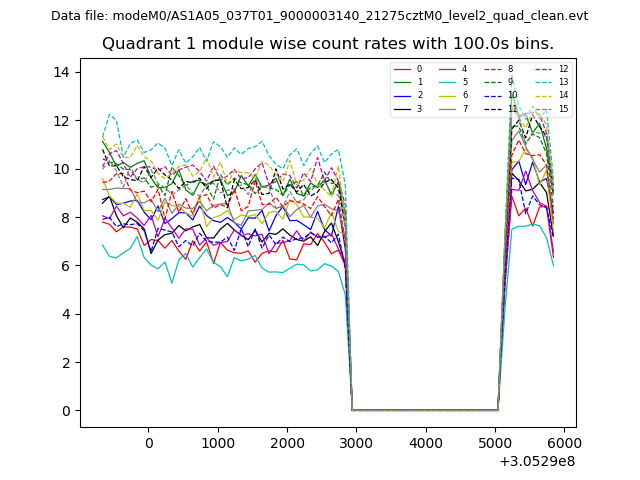 |
 |
| Module-wise count rates for Quadrant C Data is divided into 100 sec bins |
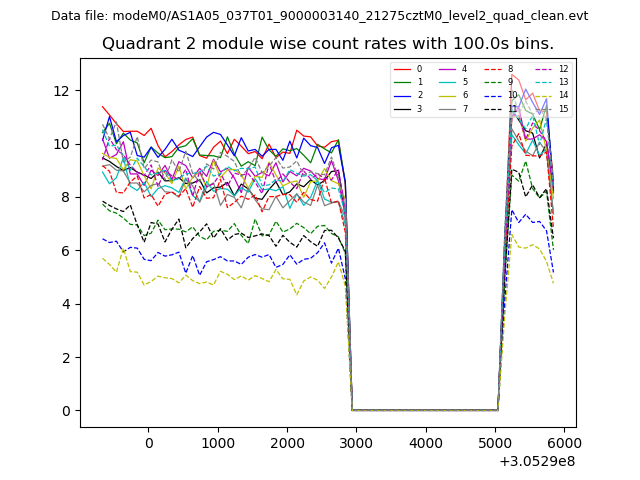 |
 |
| Module-wise count rates for Quadrant D Data is divided into 100 sec bins |
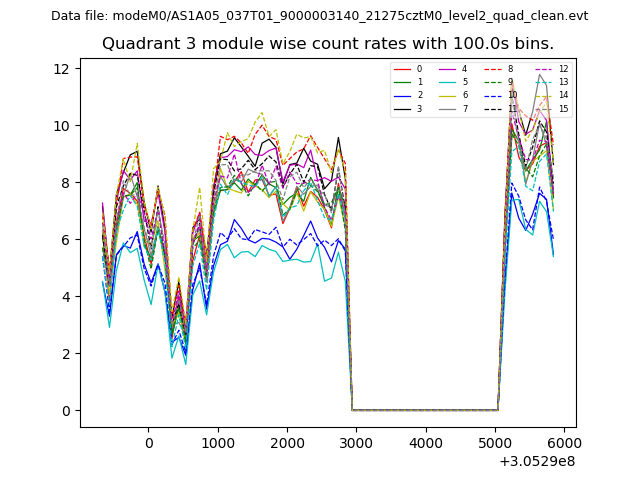 |
 |
| Parameter | Plot |
|---|---|
| CZT HV Monitor | 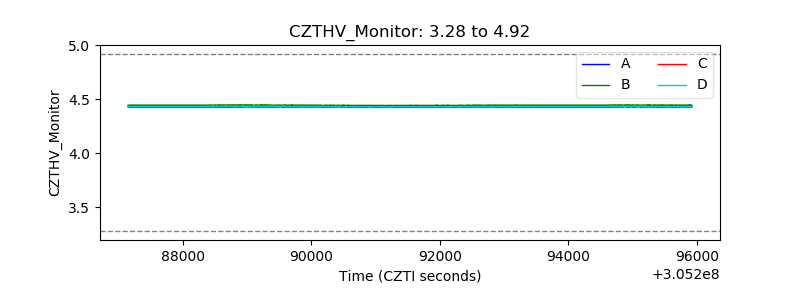 |
| D_VDD |  |
| Temperature 1 | 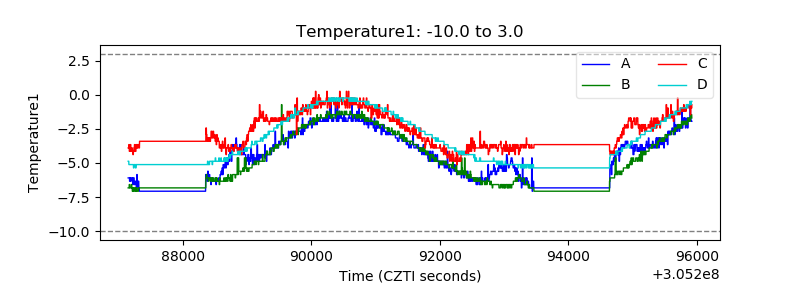 |
| Veto HV Monitor | 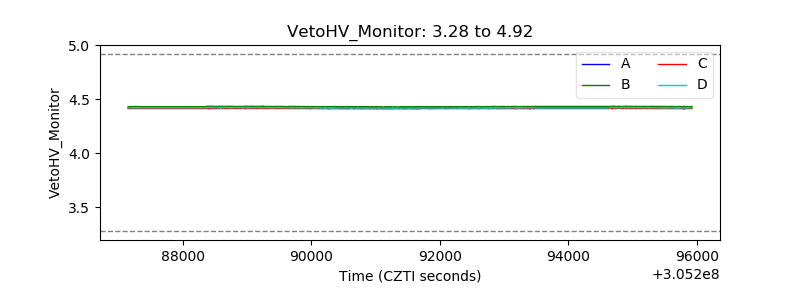 |
| Veto LLD | 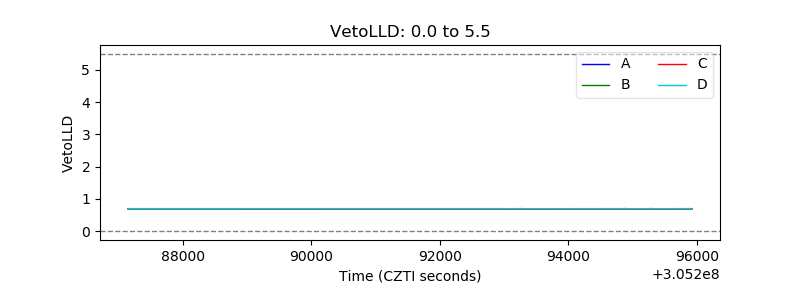 |
| Alpha Counter |  |
| _CPM_Rate | 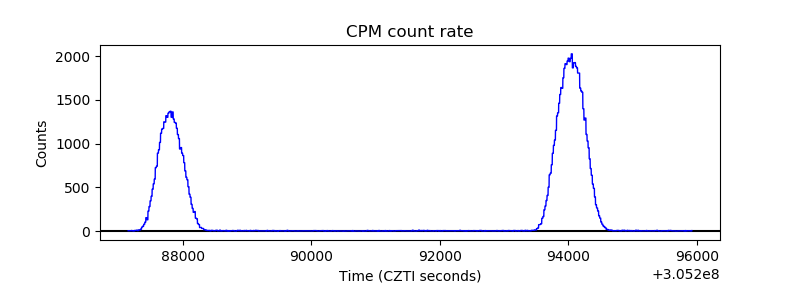 |
| CZT Counter | 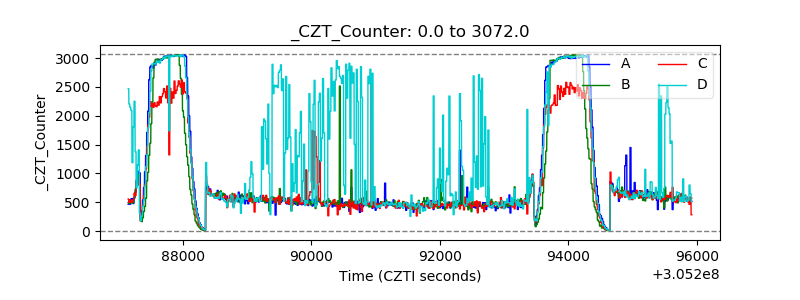 |
| +2.5 Volts monitor |  |
| +5 Volts monitor |  |
| _ROLL_ROT | 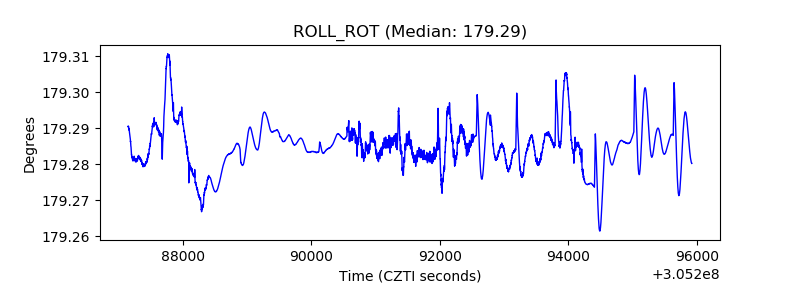 |
| _Roll_DEC | 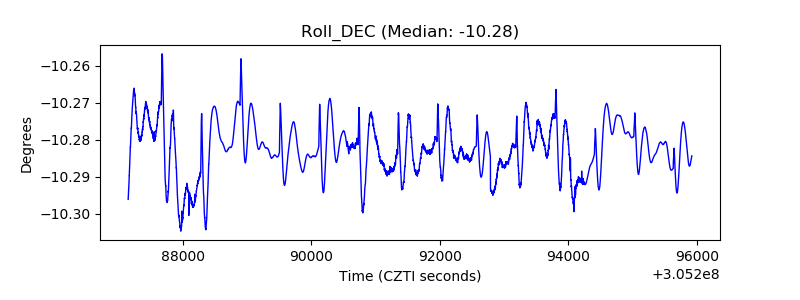 |
| _Roll_RA | 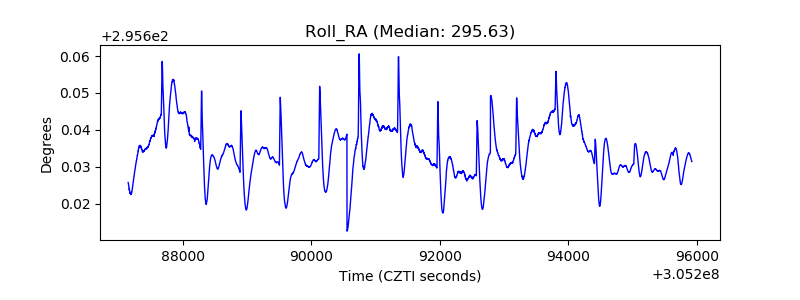 |
| Veto Counter | 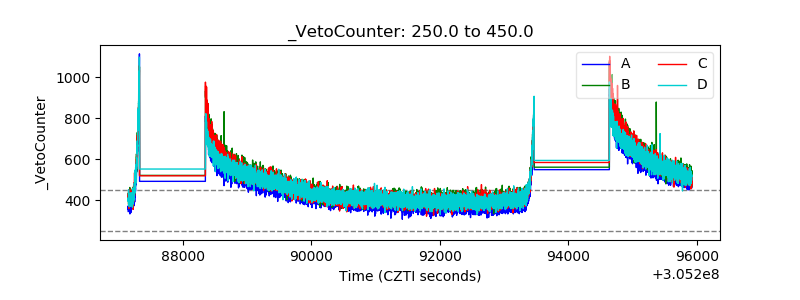 |