| Param | Original file | Final file |
|---|---|---|
| Filename | modeM0/AS1A05_037T01_9000003140_21276cztM0_level2.evt | modeM0/AS1A05_037T01_9000003140_21276cztM0_level2_quad_clean.evt |
| Size (bytes) | 512,170,560 | 108,270,720 |
| Size | 488.4 MB | 103.3 MB |
| Events in quadrant A | 3,458,835 | 730,008 |
| Events in quadrant B | 3,762,471 | 731,541 |
| Events in quadrant C | 3,537,623 | 698,351 |
| Events in quadrant D | 4,326,811 | 681,677 |
| Mode M9 | |||
|---|---|---|---|
| Quadrant | BADHDUFLAG | Total packets | Discarded packets |
| A | 0 | 16 | 0 |
| B | 0 | 17 | 0 |
| C | 0 | 17 | 0 |
| D | 0 | 17 | 0 |
| Mode M0 | |||
|---|---|---|---|
| Quadrant | BADHDUFLAG | Total packets | Discarded packets |
| A | 0 | 14454 | 2 |
| B | 0 | 15416 | 2 |
| C | 0 | 14615 | 3 |
| D | 0 | 17021 | 2 |
| Mode SS | |||
|---|---|---|---|
| Quadrant | BADHDUFLAG | Total packets | Discarded packets |
| A | 0 | 126 | 0 |
| B | 0 | 126 | 0 |
| C | 0 | 126 | 0 |
| D | 0 | 126 | 0 |
| Quadrant | Total seconds | Saturated seconds | Saturation percentage |
|---|---|---|---|
| A | 6275 | 94 | 1.498008% |
| B | 6275 | 136 | 2.167331% |
| C | 6274 | 163 | 2.598024% |
| D | 6274 | 305 | 4.861332% |
Noise dominated data is calculated using 1-second bins in cleaned event files. If a bin has >2000 counts, and if more than 50% of those come from <1% of pixels, then it is considered to be noise-dominated and hence unusable.
| Quadrant | # 1 sec bins | Bins with >0 counts | Bins with >2000 counts | High rate bins dominated by noise | Noise dominated (total time) | Noise dominated (detector-on time) | Marked lightcurve |
|---|---|---|---|---|---|---|---|
| A | 7525 | 6275 | 5 | 5 | 0.07% | 0.08% | 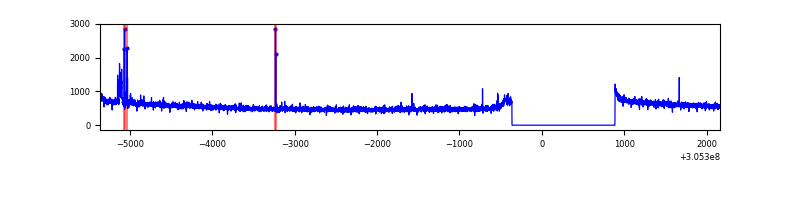 |
| B | 7525 | 6275 | 32 | 32 | 0.43% | 0.51% | 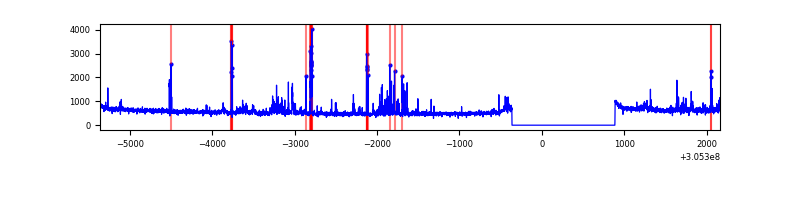 |
| C | 7524 | 6274 | 16 | 16 | 0.21% | 0.26% | 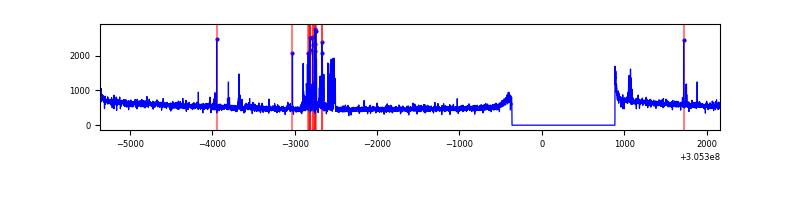 |
| D | 7524 | 6274 | 203 | 203 | 2.70% | 3.24% | 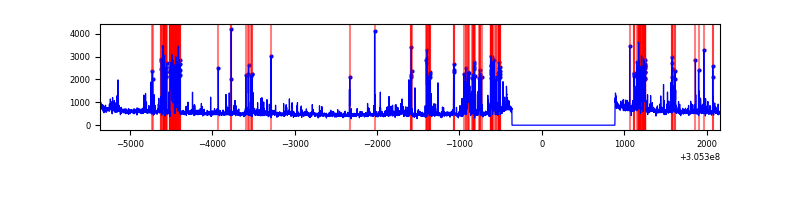 |
Top three noisy pixels from each quadrant. If the there are fewer than three noisy pixels in the level2.evt file, extra rows are filled as -1
| Pixel properties | Quadrant properties | ||||||
|---|---|---|---|---|---|---|---|
| Quadrant | DetID | PixID | Counts | Sigma | Mean | Median | Sigma |
| A | 15 | 236 | 52632 | 298.41 | 881 | 867 | 173.5 |
| A | 9 | 143 | 9952 | 52.37 | 881 | 867 | 173.5 |
| A | 13 | 254 | 9661 | 50.7 | 881 | 867 | 173.5 |
| B | 0 | 189 | 137074 | 844.51 | 861 | 844 | 161.3 |
| B | 0 | 245 | 76031 | 466.09 | 861 | 844 | 161.3 |
| B | 0 | 190 | 67362 | 412.35 | 861 | 844 | 161.3 |
| C | 0 | 207 | 150807 | 789.97 | 824 | 831 | 189.9 |
| C | 14 | 238 | 131682 | 689.23 | 824 | 831 | 189.9 |
| C | 3 | 233 | 29826 | 152.72 | 824 | 831 | 189.9 |
| D | 13 | 174 | 615148 | 3025.48 | 843 | 820 | 203.1 |
| D | 1 | 52 | 295550 | 1451.51 | 843 | 820 | 203.1 |
| D | 13 | 153 | 53684 | 260.35 | 843 | 820 | 203.1 |
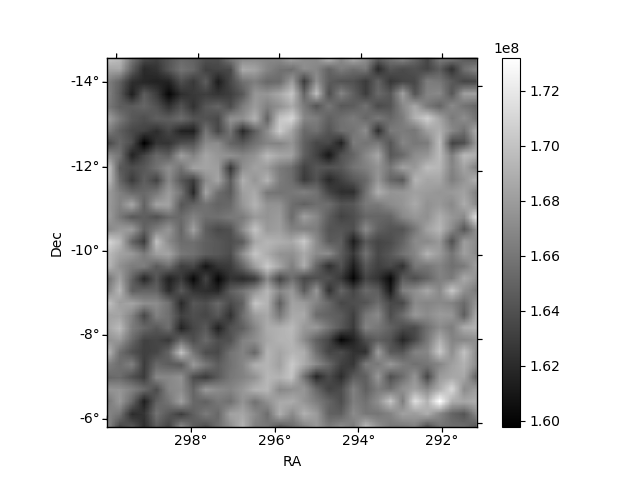
Histogram calculated using DETX and DETY for each event in the final _common_clean file
| Quadrant A | 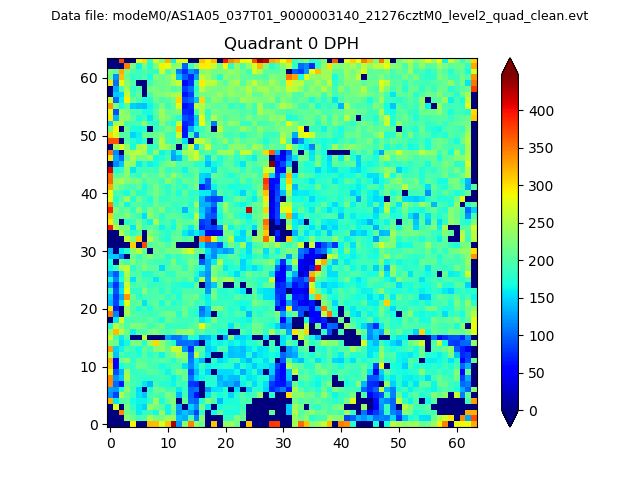 |
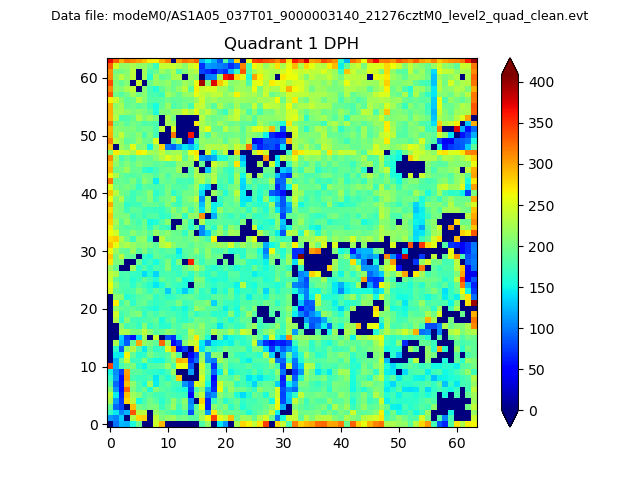 |
Quadrant B |
|---|---|---|---|
| Quadrant D |  |
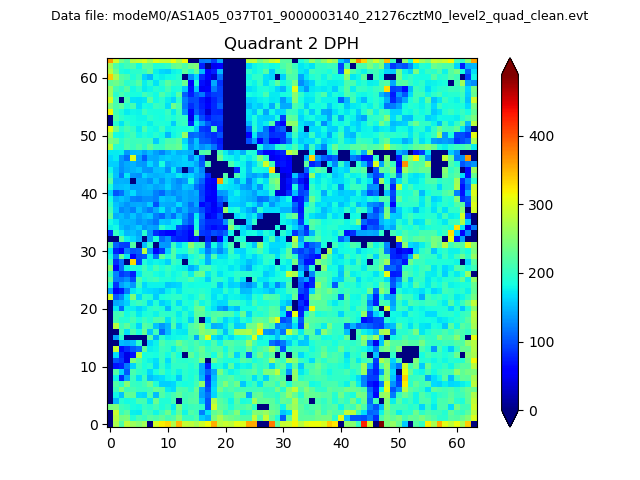 |
Quadrant C |
| Plot type | Count rate plots | Images |
|---|---|---|
| Comparison with Poisson distribution Blue bars denote a histogram of data divided into 1 sec bins. Red curve is a Poisson curve with rate = median count rate of data. |
 |
 |
| Quadrant-wise count rates Data is divided into 100 sec bins |
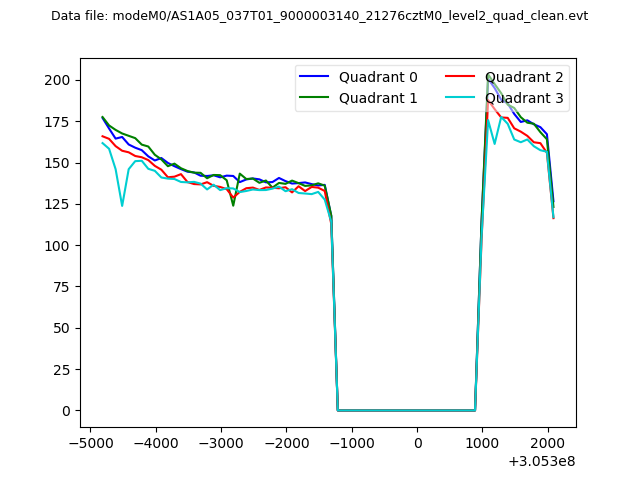 |
|
| Module-wise count rates for Quadrant A Data is divided into 100 sec bins |
 |
 |
| Module-wise count rates for Quadrant B Data is divided into 100 sec bins |
 |
 |
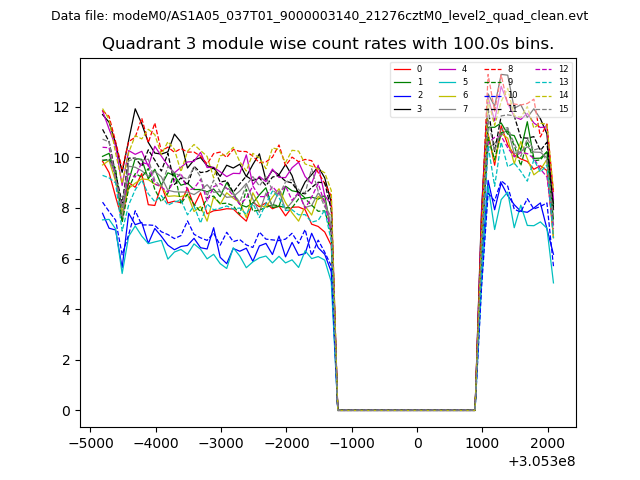
| Module-wise count rates for Quadrant C Data is divided into 100 sec bins |
 |
 |
| Module-wise count rates for Quadrant D Data is divided into 100 sec bins |
 |
 |
| Parameter | Plot |
|---|---|
| CZT HV Monitor |  |
| D_VDD | 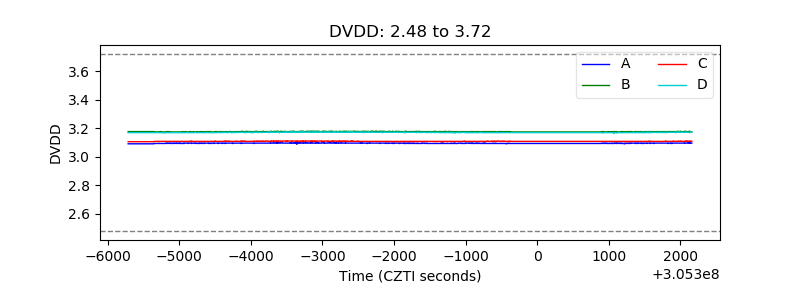 |
| Temperature 1 | 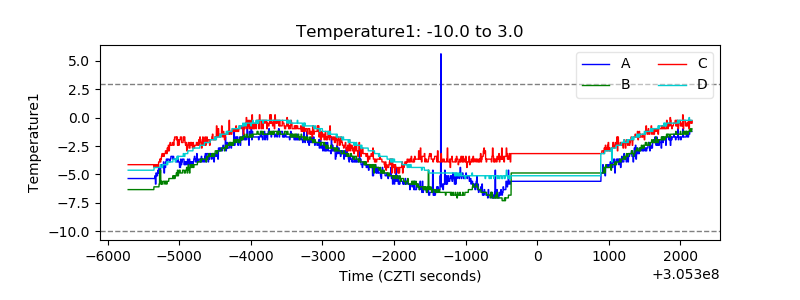 |
| Veto HV Monitor | 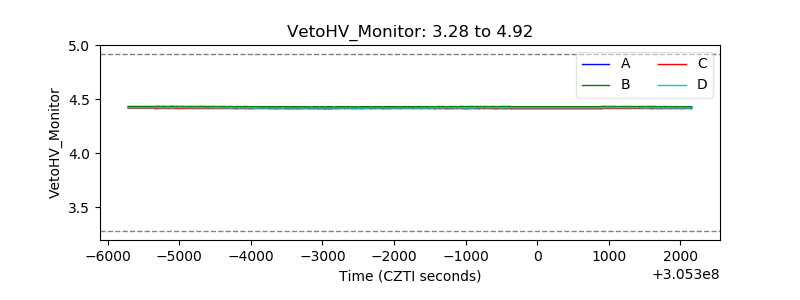 |
| Veto LLD | 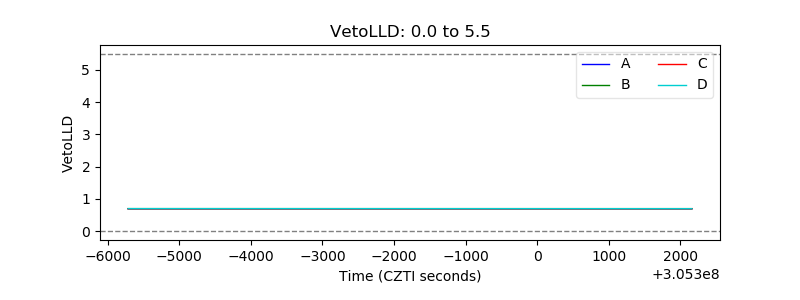 |
| Alpha Counter | 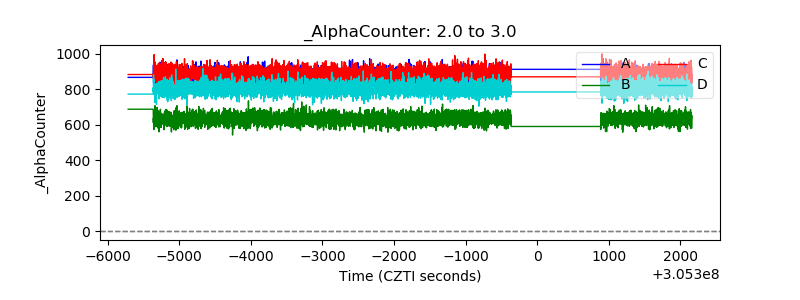 |
| _CPM_Rate | 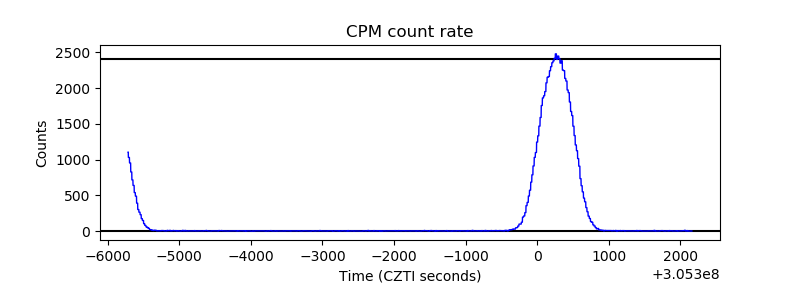 |
| CZT Counter | 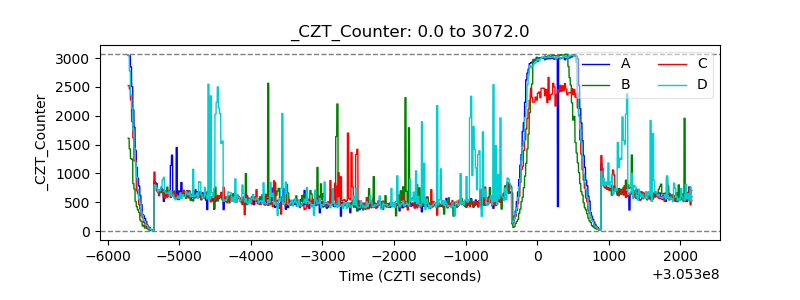 |
| +2.5 Volts monitor |  |
| +5 Volts monitor |  |
| _ROLL_ROT | 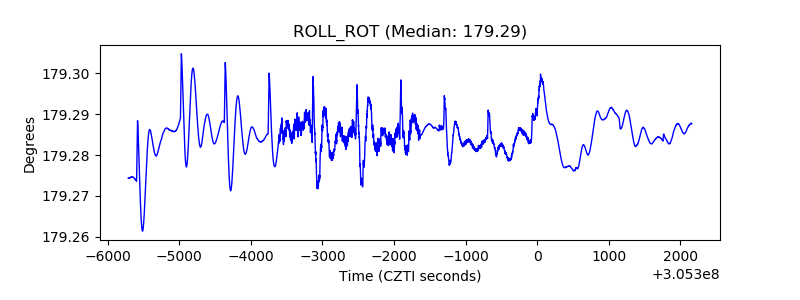 |
| _Roll_DEC | 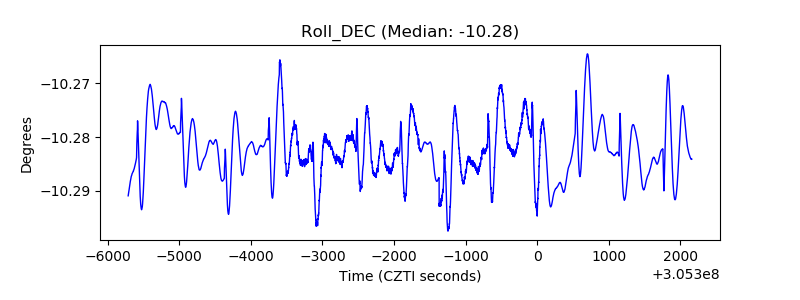 |
| _Roll_RA | 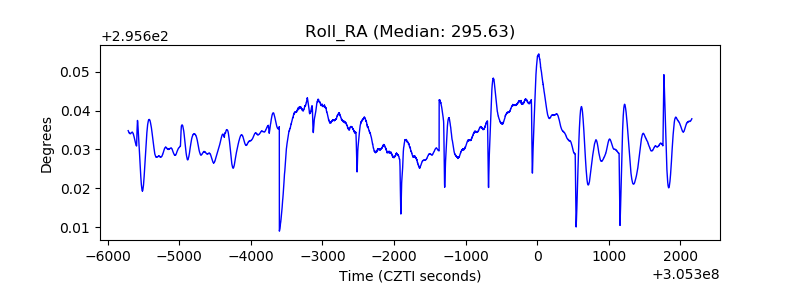 |
| Veto Counter |  |