| Param | Original file | Final file |
|---|---|---|
| Filename | modeM0/AS1A05_037T01_9000003140_21279cztM0_level2.evt | modeM0/AS1A05_037T01_9000003140_21279cztM0_level2_quad_clean.evt |
| Size (bytes) | 502,496,640 | 95,777,280 |
| Size | 479.2 MB | 91.3 MB |
| Events in quadrant A | 3,288,519 | 635,357 |
| Events in quadrant B | 4,237,093 | 610,538 |
| Events in quadrant C | 3,360,193 | 612,443 |
| Events in quadrant D | 3,898,249 | 595,950 |
| Mode M9 | |||
|---|---|---|---|
| Quadrant | BADHDUFLAG | Total packets | Discarded packets |
| A | 0 | 12 | 0 |
| B | 0 | 12 | 0 |
| C | 0 | 12 | 0 |
| D | 0 | 12 | 0 |
| Mode M0 | |||
|---|---|---|---|
| Quadrant | BADHDUFLAG | Total packets | Discarded packets |
| A | 0 | 13879 | 1 |
| B | 0 | 16824 | 1 |
| C | 0 | 13989 | 1 |
| D | 0 | 15792 | 1 |
| Mode SS | |||
|---|---|---|---|
| Quadrant | BADHDUFLAG | Total packets | Discarded packets |
| A | 0 | 130 | 0 |
| B | 0 | 130 | 0 |
| C | 0 | 130 | 0 |
| D | 0 | 130 | 0 |
| Quadrant | Total seconds | Saturated seconds | Saturation percentage |
|---|---|---|---|
| A | 6393 | 110 | 1.720632% |
| B | 6394 | 461 | 7.209884% |
| C | 6394 | 147 | 2.299030% |
| D | 6394 | 141 | 2.205192% |
Noise dominated data is calculated using 1-second bins in cleaned event files. If a bin has >2000 counts, and if more than 50% of those come from <1% of pixels, then it is considered to be noise-dominated and hence unusable.
| Quadrant | # 1 sec bins | Bins with >0 counts | Bins with >2000 counts | High rate bins dominated by noise | Noise dominated (total time) | Noise dominated (detector-on time) | Marked lightcurve |
|---|---|---|---|---|---|---|---|
| A | 7623 | 6393 | 0 | 0 | 0.00% | 0.00% | 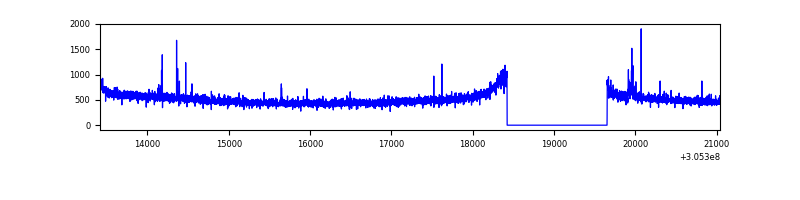 |
| B | 7624 | 6394 | 304 | 304 | 3.99% | 4.75% | 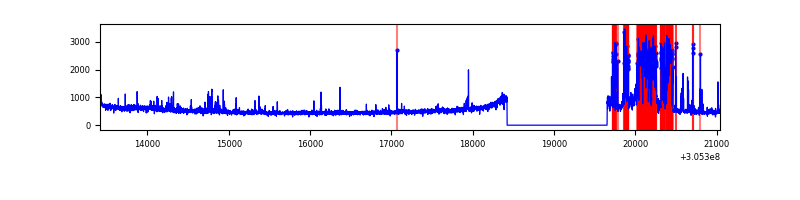 |
| C | 7624 | 6394 | 21 | 21 | 0.28% | 0.33% | 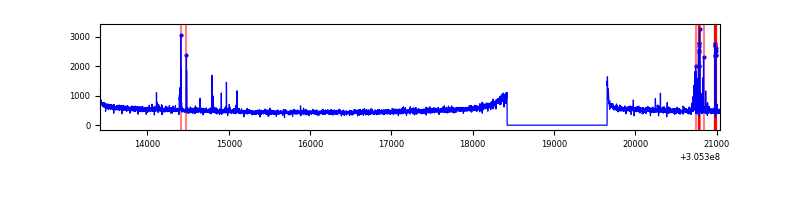 |
| D | 7624 | 6394 | 55 | 55 | 0.72% | 0.86% | 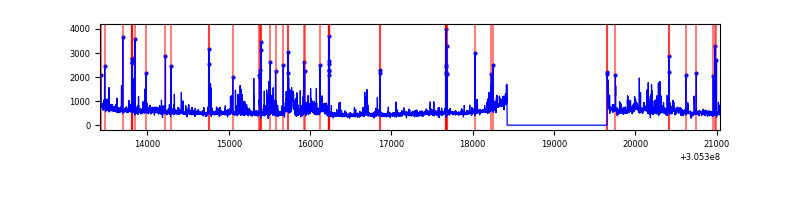 |
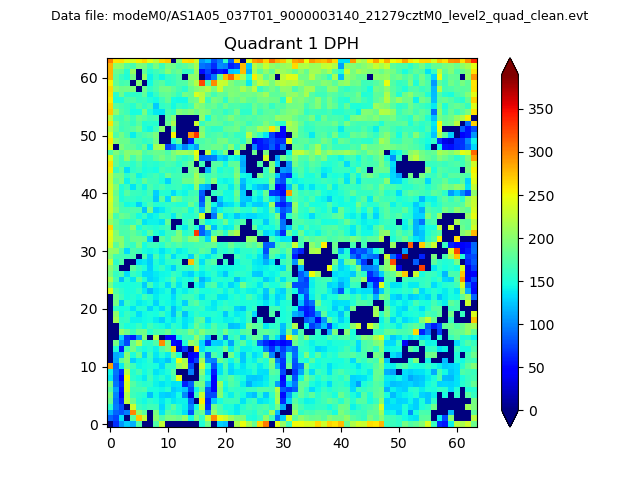
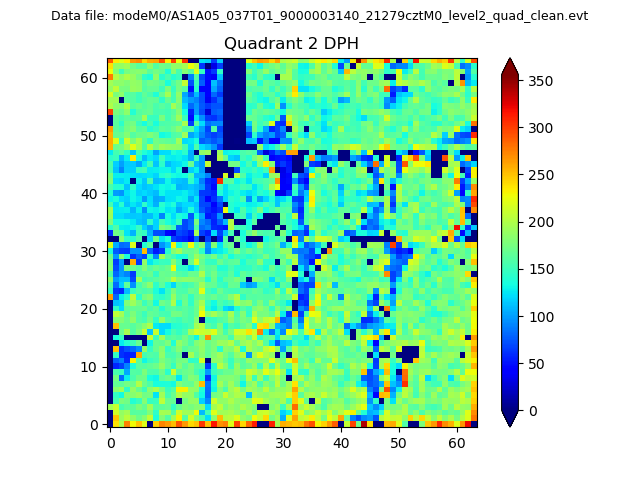
Top three noisy pixels from each quadrant. If the there are fewer than three noisy pixels in the level2.evt file, extra rows are filled as -1
| Pixel properties | Quadrant properties | ||||||
|---|---|---|---|---|---|---|---|
| Quadrant | DetID | PixID | Counts | Sigma | Mean | Median | Sigma |
| A | 9 | 143 | 31460 | 180.96 | 844 | 827 | 169.3 |
| A | 13 | 254 | 10381 | 56.44 | 844 | 827 | 169.3 |
| A | 0 | 226 | 7434 | 39.03 | 844 | 827 | 169.3 |
| B | 10 | 245 | 899489 | 5839.73 | 812 | 796 | 153.9 |
| B | 0 | 245 | 37729 | 239.99 | 812 | 796 | 153.9 |
| B | 0 | 190 | 36552 | 232.34 | 812 | 796 | 153.9 |
| C | 14 | 238 | 124999 | 675.2 | 793 | 800 | 183.9 |
| C | 0 | 207 | 120057 | 648.33 | 793 | 800 | 183.9 |
| C | 3 | 233 | 13647 | 69.84 | 793 | 800 | 183.9 |
| D | 1 | 52 | 348193 | 1762.71 | 812 | 789 | 197.1 |
| D | 7 | 238 | 152301 | 768.77 | 812 | 789 | 197.1 |
| D | 12 | 235 | 115102 | 580.02 | 812 | 789 | 197.1 |
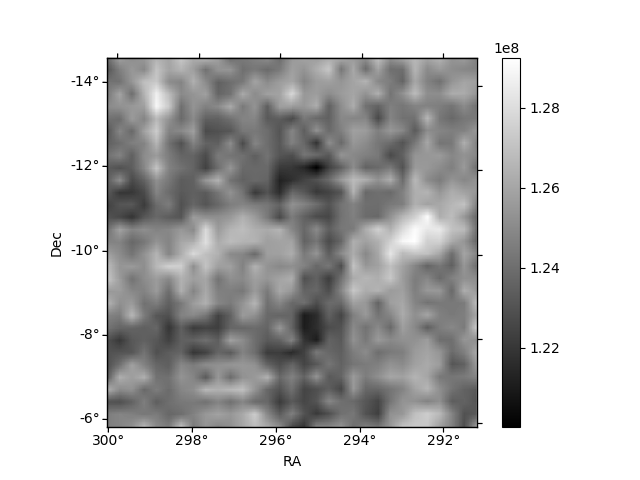
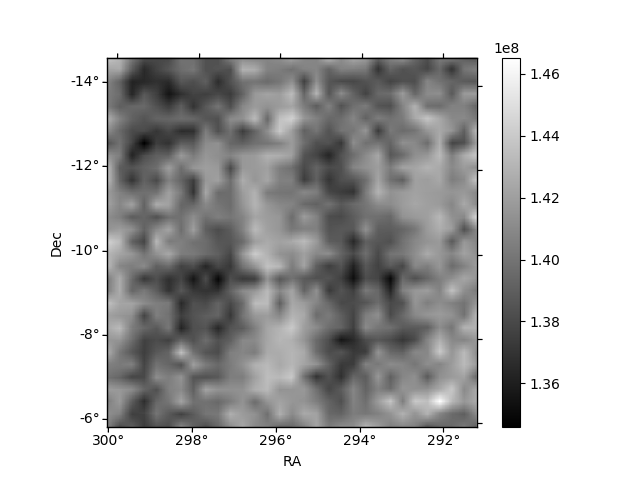
Histogram calculated using DETX and DETY for each event in the final _common_clean file
| Quadrant A | 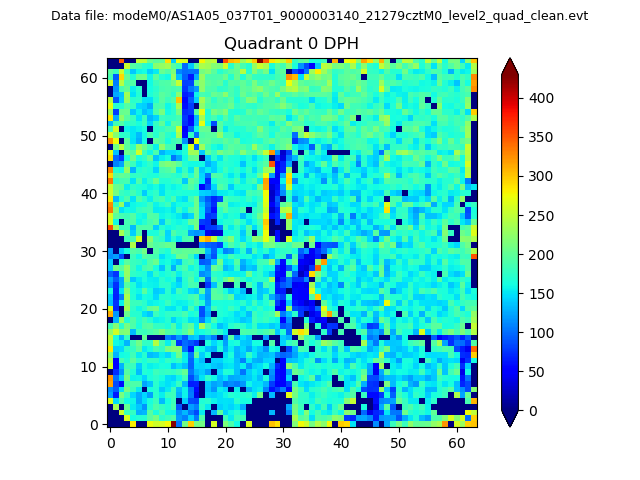 |
 |
Quadrant B |
|---|---|---|---|
| Quadrant D | 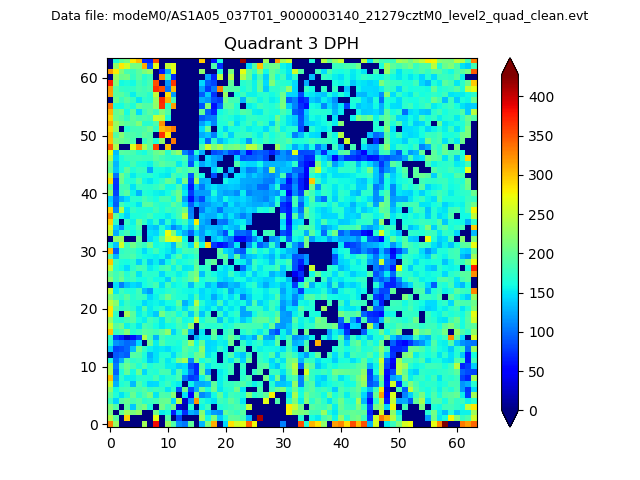 |
 |
Quadrant C |
| Plot type | Count rate plots | Images |
|---|---|---|
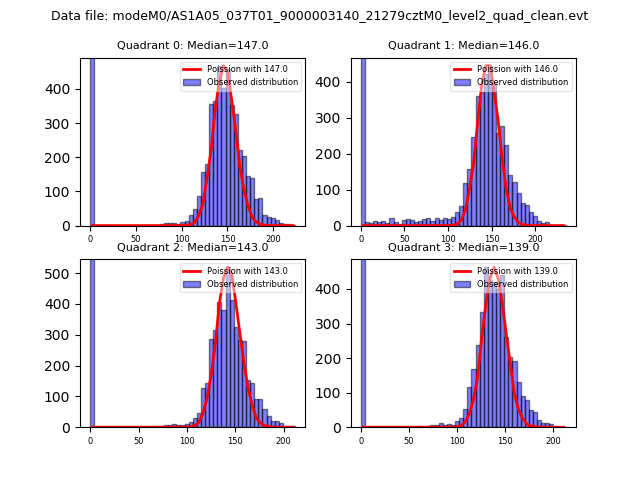
| Comparison with Poisson distribution Blue bars denote a histogram of data divided into 1 sec bins. Red curve is a Poisson curve with rate = median count rate of data. |
 |
 |
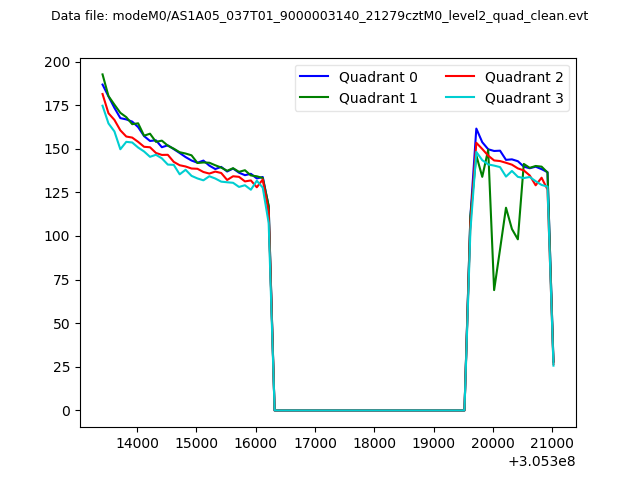
| Quadrant-wise count rates Data is divided into 100 sec bins |
 |
|
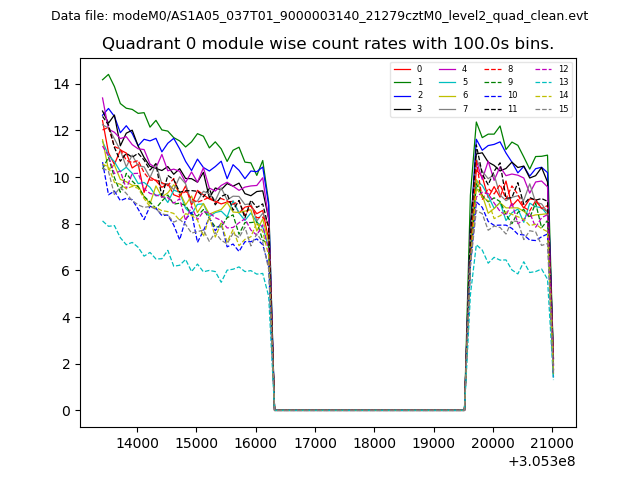
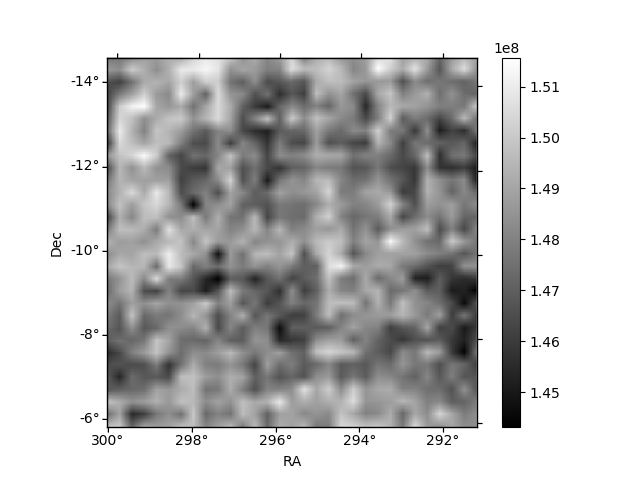
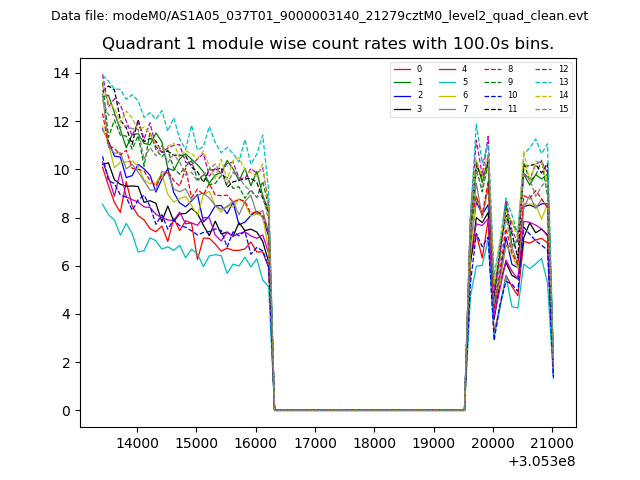
| Module-wise count rates for Quadrant A Data is divided into 100 sec bins |
 |
 |
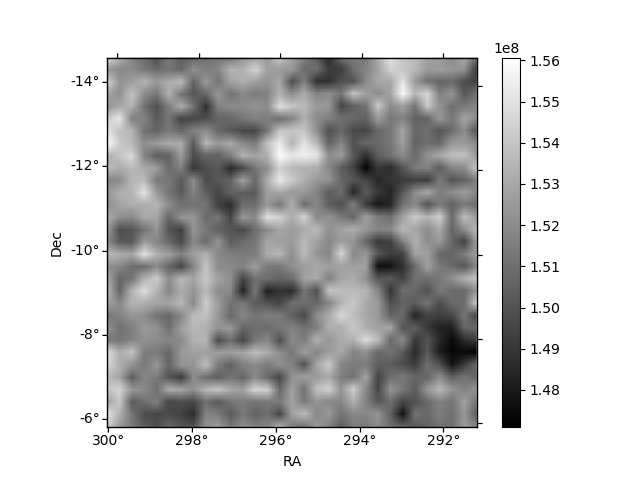
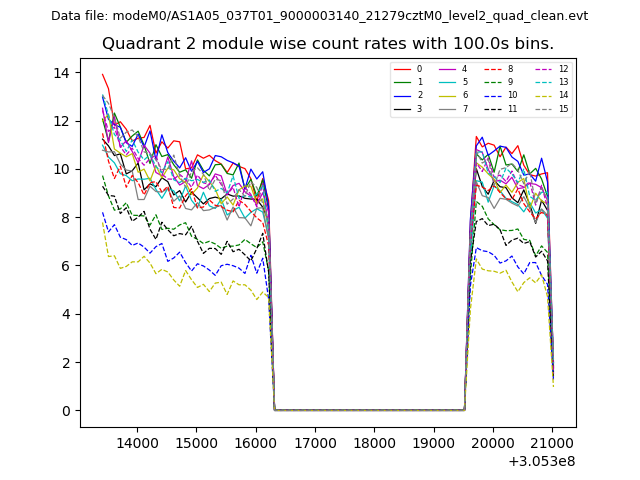
| Module-wise count rates for Quadrant B Data is divided into 100 sec bins |
 |
 |
| Module-wise count rates for Quadrant C Data is divided into 100 sec bins |
 |
 |
| Module-wise count rates for Quadrant D Data is divided into 100 sec bins |
 |
 |
| Parameter | Plot |
|---|---|
| CZT HV Monitor | 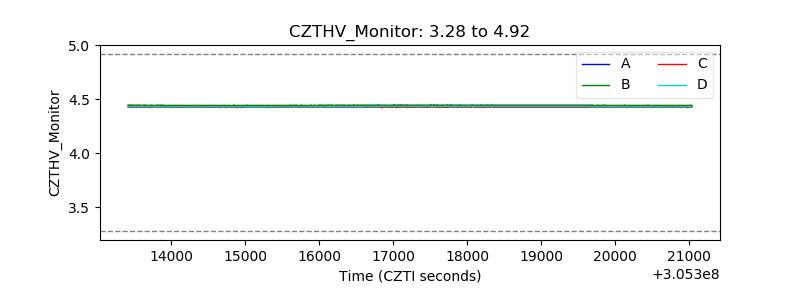 |
| D_VDD | 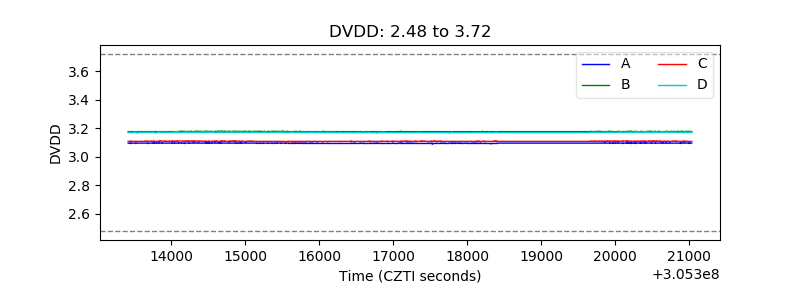 |
| Temperature 1 | 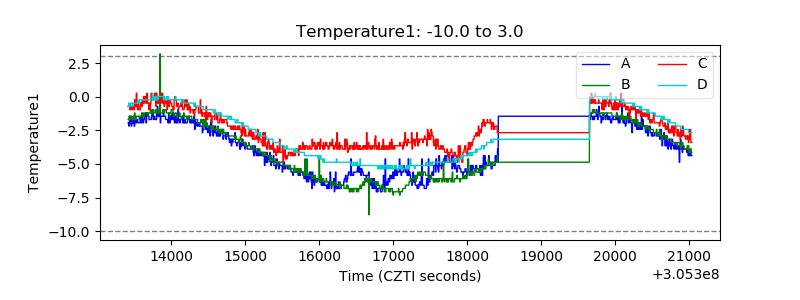 |
| Veto HV Monitor | 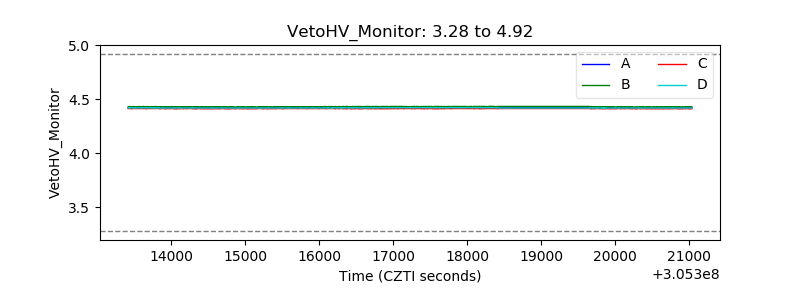 |
| Veto LLD | 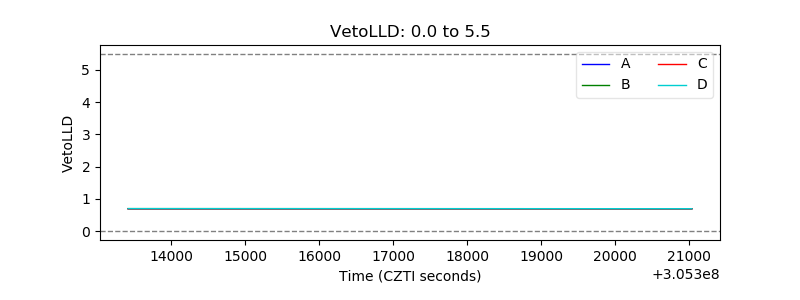 |
| Alpha Counter | 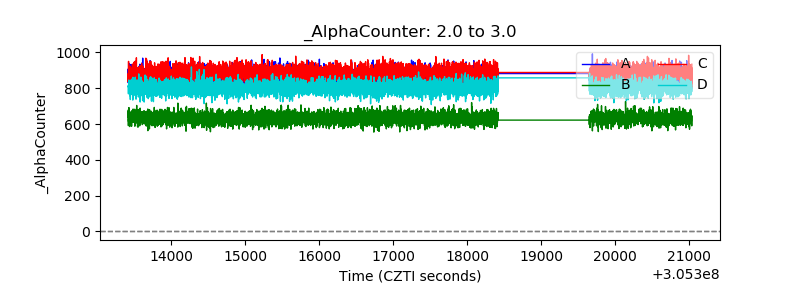 |
| _CPM_Rate | 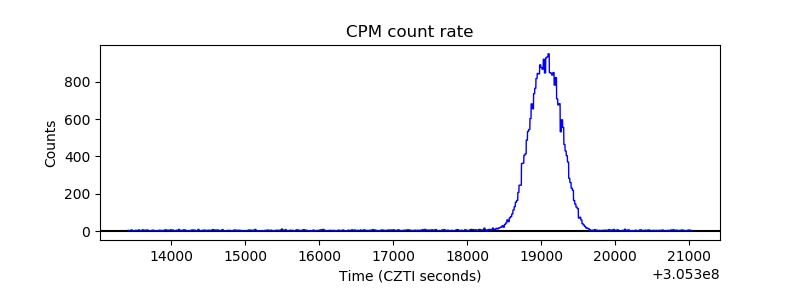 |
| CZT Counter | 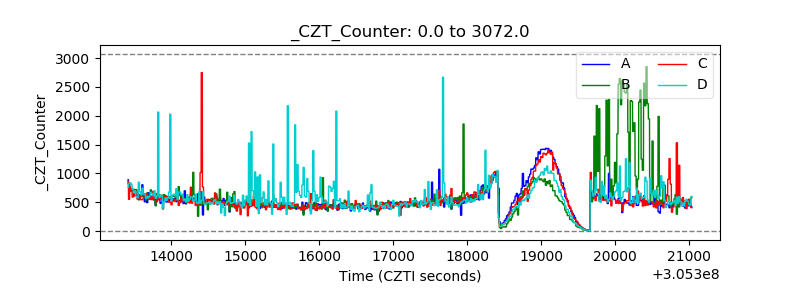 |
| +2.5 Volts monitor |  |
| +5 Volts monitor |  |
| _ROLL_ROT | 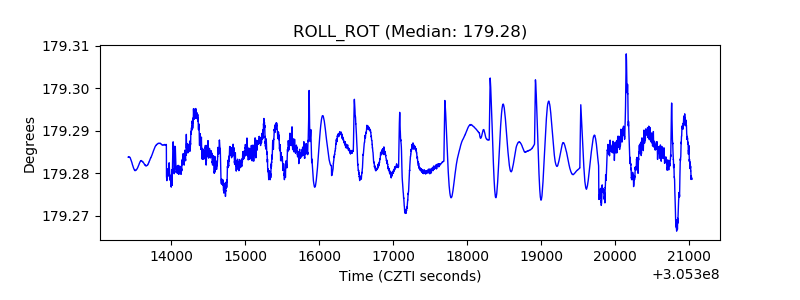 |
| _Roll_DEC | 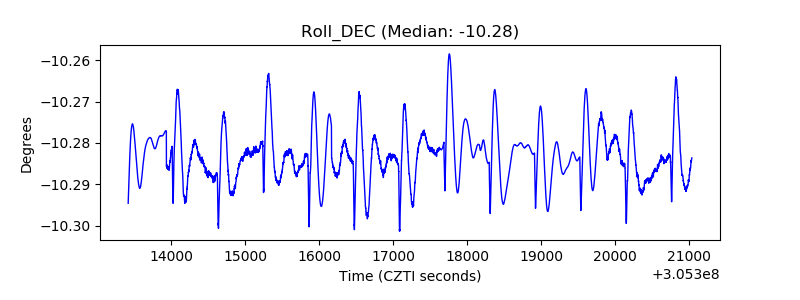 |
| _Roll_RA | 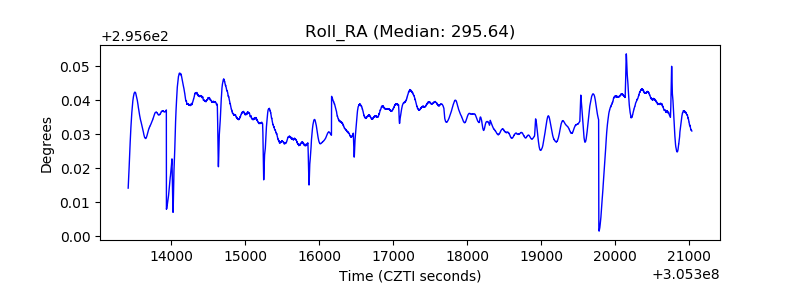 |
| Veto Counter |  |