| Param | Original file | Final file |
|---|---|---|
| Filename | modeM0/AS1A05_037T01_9000003140_21280cztM0_level2.evt | modeM0/AS1A05_037T01_9000003140_21280cztM0_level2_quad_clean.evt |
| Size (bytes) | 494,496,000 | 91,149,120 |
| Size | 471.6 MB | 86.9 MB |
| Events in quadrant A | 3,206,449 | 593,242 |
| Events in quadrant B | 4,394,665 | 569,355 |
| Events in quadrant C | 3,317,412 | 579,253 |
| Events in quadrant D | 3,614,615 | 563,548 |
| Mode M9 | |||
|---|---|---|---|
| Quadrant | BADHDUFLAG | Total packets | Discarded packets |
| A | 0 | 14 | 0 |
| B | 0 | 15 | 0 |
| C | 0 | 15 | 0 |
| D | 0 | 15 | 0 |
| Mode M0 | |||
|---|---|---|---|
| Quadrant | BADHDUFLAG | Total packets | Discarded packets |
| A | 0 | 13745 | 3 |
| B | 0 | 17237 | 2 |
| C | 0 | 14022 | 2 |
| D | 0 | 15060 | 2 |
| Mode SS | |||
|---|---|---|---|
| Quadrant | BADHDUFLAG | Total packets | Discarded packets |
| A | 0 | 134 | 0 |
| B | 0 | 134 | 0 |
| C | 0 | 134 | 0 |
| D | 0 | 134 | 0 |
| Quadrant | Total seconds | Saturated seconds | Saturation percentage |
|---|---|---|---|
| A | 6515 | 46 | 0.706063% |
| B | 6515 | 442 | 6.784344% |
| C | 6515 | 91 | 1.396777% |
| D | 6515 | 70 | 1.074444% |
Noise dominated data is calculated using 1-second bins in cleaned event files. If a bin has >2000 counts, and if more than 50% of those come from <1% of pixels, then it is considered to be noise-dominated and hence unusable.
| Quadrant | # 1 sec bins | Bins with >0 counts | Bins with >2000 counts | High rate bins dominated by noise | Noise dominated (total time) | Noise dominated (detector-on time) | Marked lightcurve |
|---|---|---|---|---|---|---|---|
| A | 7470 | 6516 | 0 | 0 | 0.00% | 0.00% | 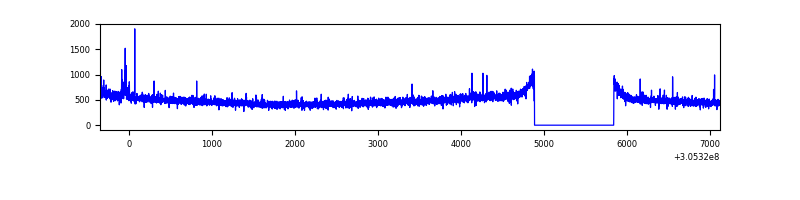 |
| B | 7470 | 6516 | 340 | 340 | 4.55% | 5.22% | 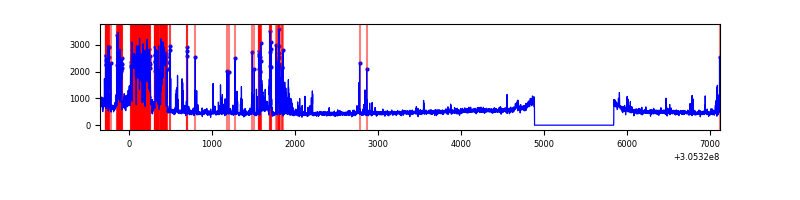 |
| C | 7470 | 6516 | 22 | 22 | 0.29% | 0.34% | 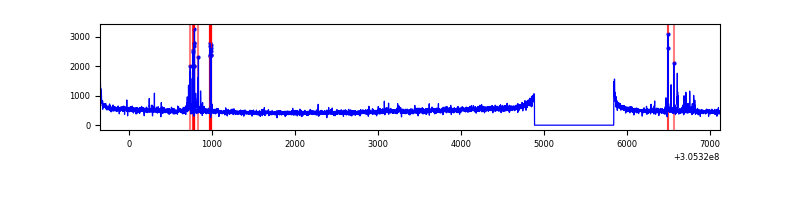 |
| D | 7470 | 6516 | 30 | 30 | 0.40% | 0.46% | 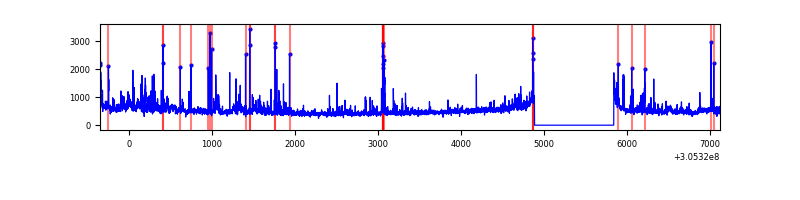 |
Top three noisy pixels from each quadrant. If the there are fewer than three noisy pixels in the level2.evt file, extra rows are filled as -1
| Pixel properties | Quadrant properties | ||||||
|---|---|---|---|---|---|---|---|
| Quadrant | DetID | PixID | Counts | Sigma | Mean | Median | Sigma |
| A | 9 | 143 | 25331 | 148.88 | 822 | 804 | 164.7 |
| A | 13 | 254 | 10471 | 58.68 | 822 | 804 | 164.7 |
| A | 0 | 226 | 7162 | 38.59 | 822 | 804 | 164.7 |
| B | 10 | 245 | 1144208 | 7556.89 | 794 | 776 | 151.3 |
| B | 0 | 190 | 27478 | 176.47 | 794 | 776 | 151.3 |
| B | 0 | 245 | 24300 | 155.47 | 794 | 776 | 151.3 |
| C | 14 | 238 | 120803 | 656.04 | 779 | 785 | 182.9 |
| C | 0 | 207 | 120333 | 653.47 | 779 | 785 | 182.9 |
| C | 3 | 233 | 23202 | 122.54 | 779 | 785 | 182.9 |
| D | 1 | 52 | 318869 | 1660.94 | 790 | 768 | 191.5 |
| D | 13 | 153 | 87749 | 454.16 | 790 | 768 | 191.5 |
| D | 13 | 174 | 65386 | 337.4 | 790 | 768 | 191.5 |
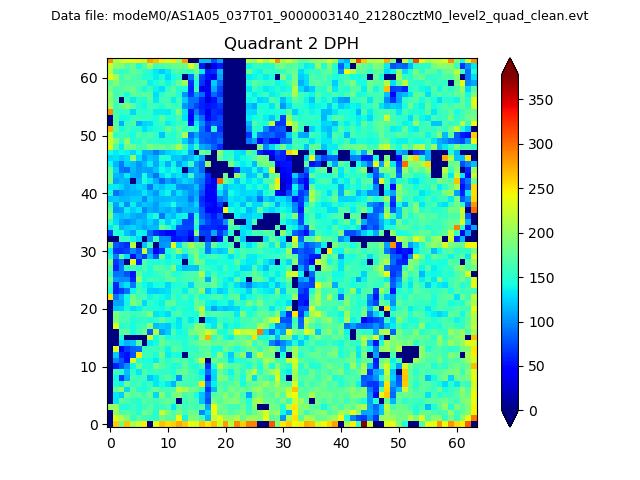
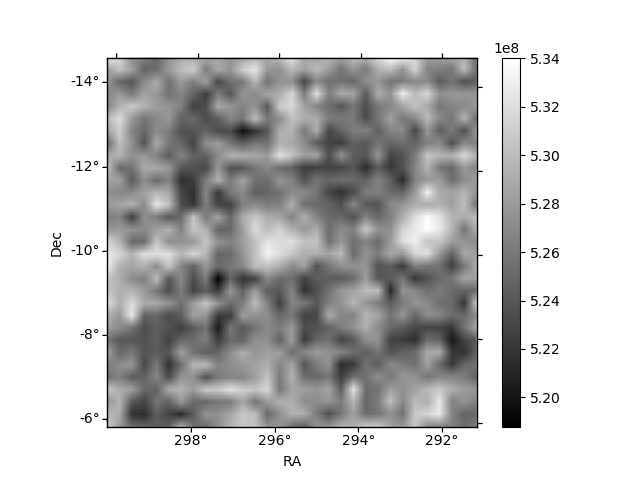
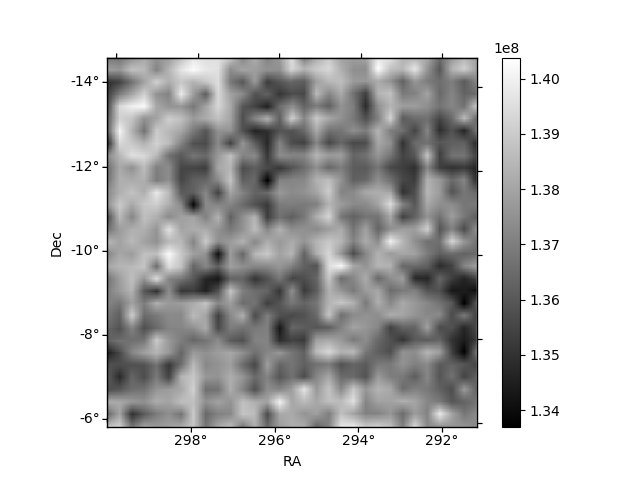
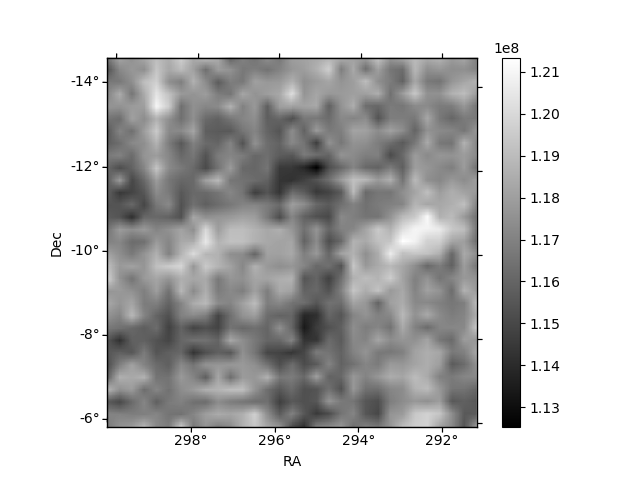
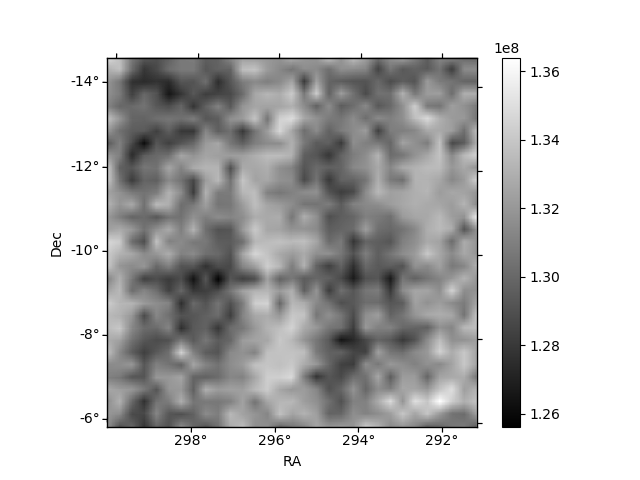
Histogram calculated using DETX and DETY for each event in the final _common_clean file
| Quadrant A | 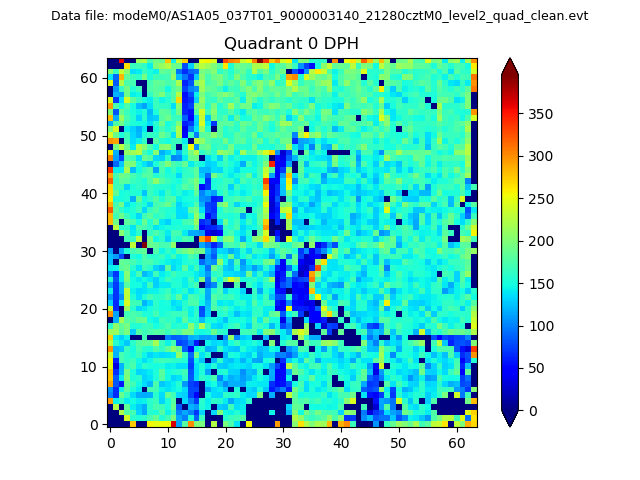 |
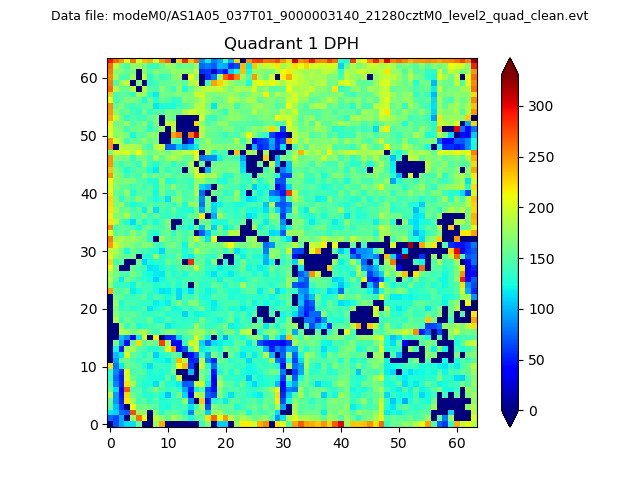 |
Quadrant B |
|---|---|---|---|
| Quadrant D | 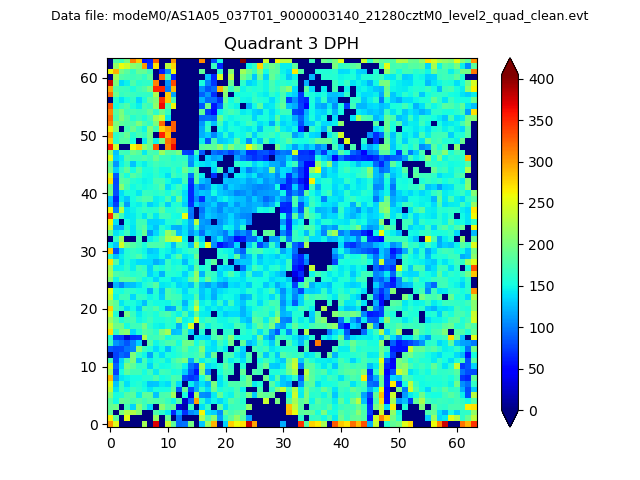 |
 |
Quadrant C |
| Plot type | Count rate plots | Images |
|---|---|---|
| Comparison with Poisson distribution Blue bars denote a histogram of data divided into 1 sec bins. Red curve is a Poisson curve with rate = median count rate of data. |
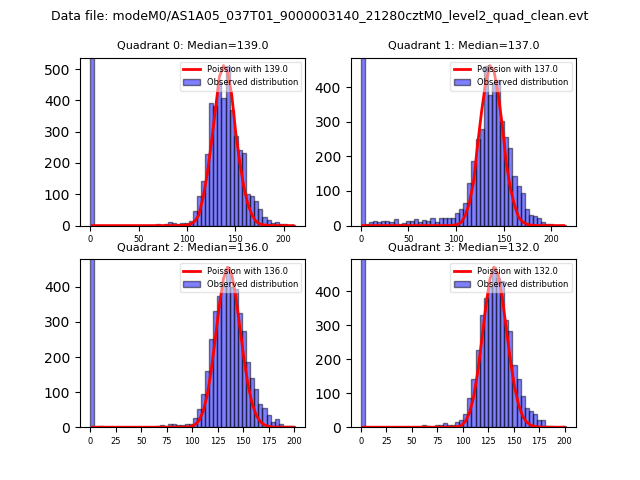 |
 |
| Quadrant-wise count rates Data is divided into 100 sec bins |
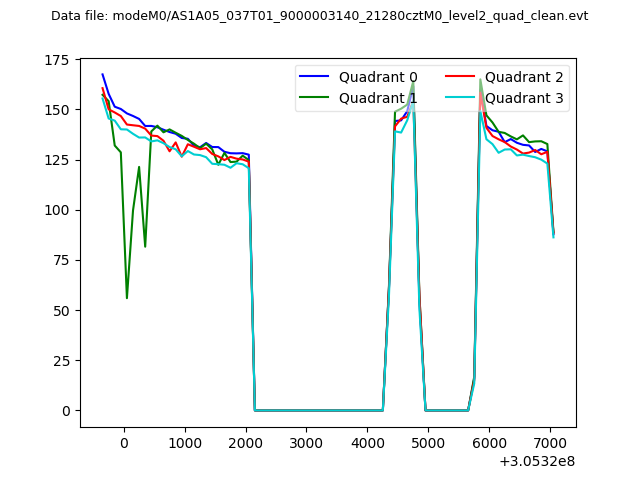 |
|
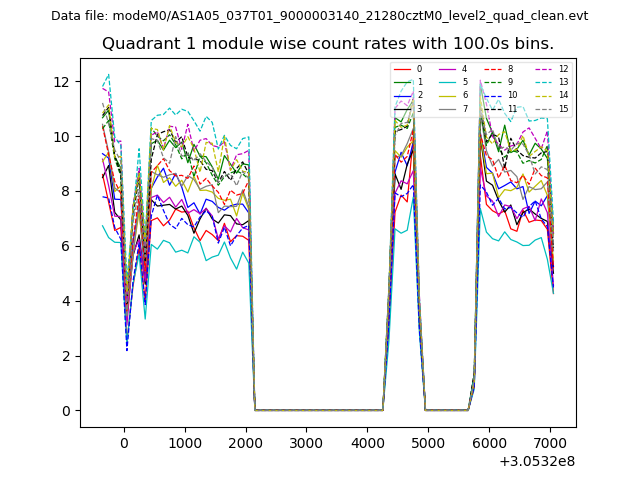
| Module-wise count rates for Quadrant A Data is divided into 100 sec bins |
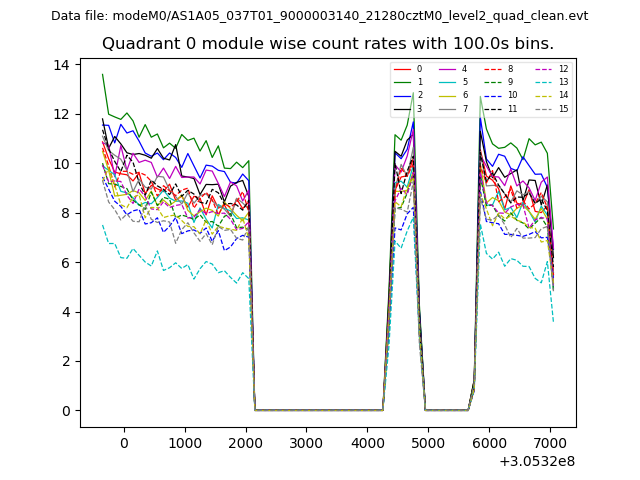 |
 |
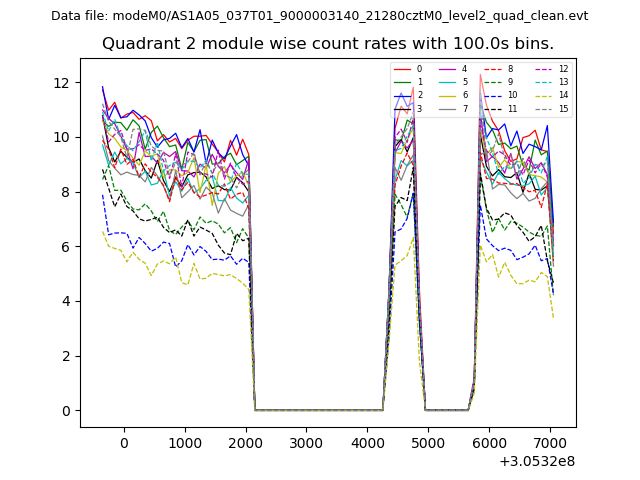
| Module-wise count rates for Quadrant B Data is divided into 100 sec bins |
 |
 |
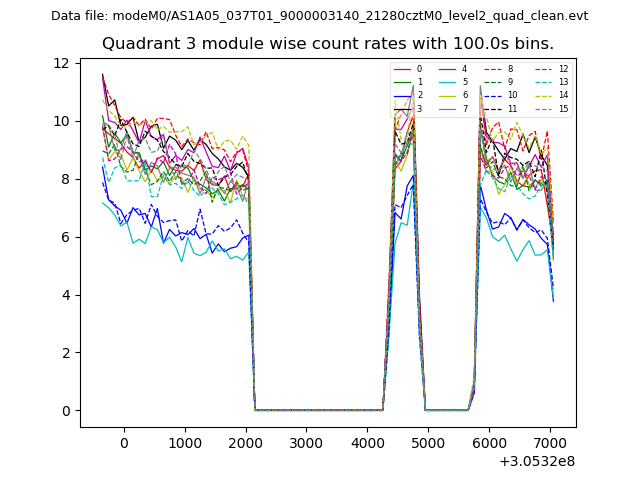
| Module-wise count rates for Quadrant C Data is divided into 100 sec bins |
 |
 |
| Module-wise count rates for Quadrant D Data is divided into 100 sec bins |
 |
 |
| Parameter | Plot |
|---|---|
| CZT HV Monitor | 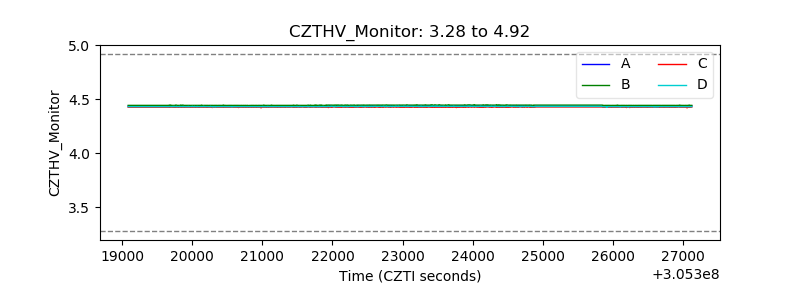 |
| D_VDD | 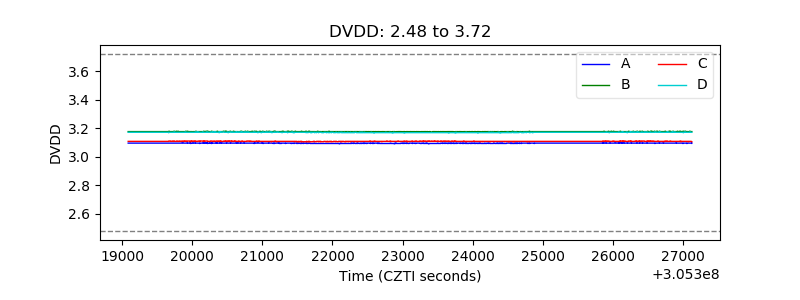 |
| Temperature 1 |  |
| Veto HV Monitor | 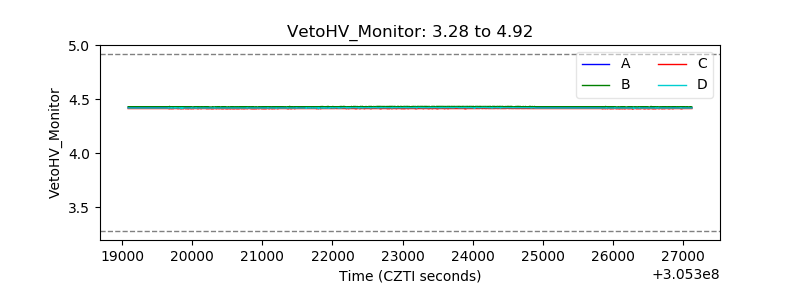 |
| Veto LLD |  |
| Alpha Counter | 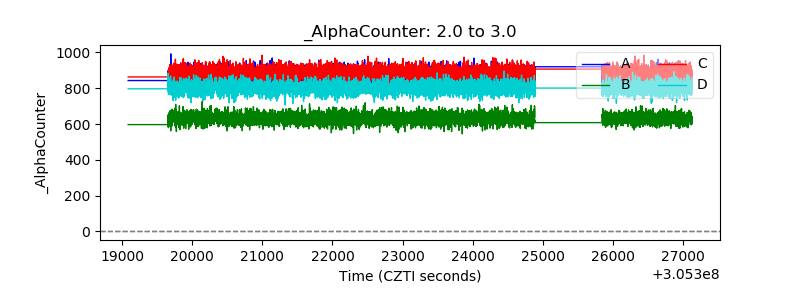 |
| _CPM_Rate | 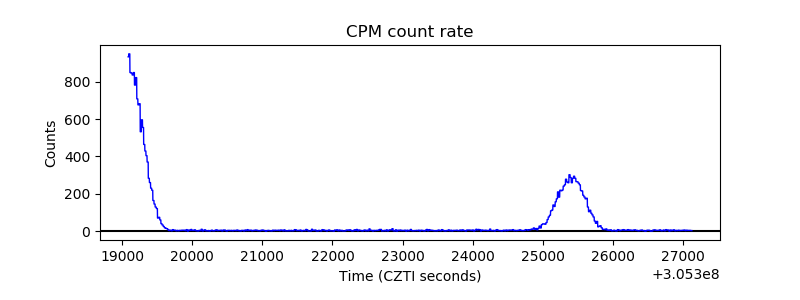 |
| CZT Counter | 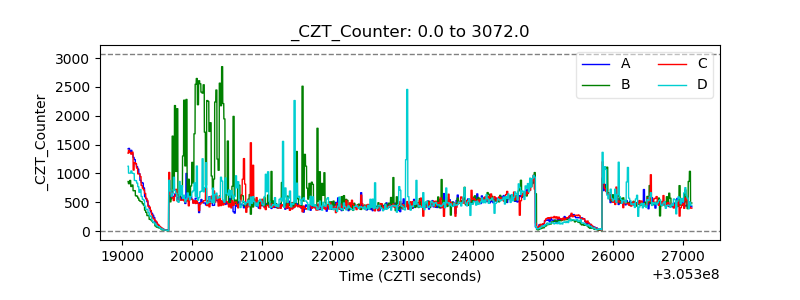 |
| +2.5 Volts monitor |  |
| +5 Volts monitor |  |
| _ROLL_ROT | 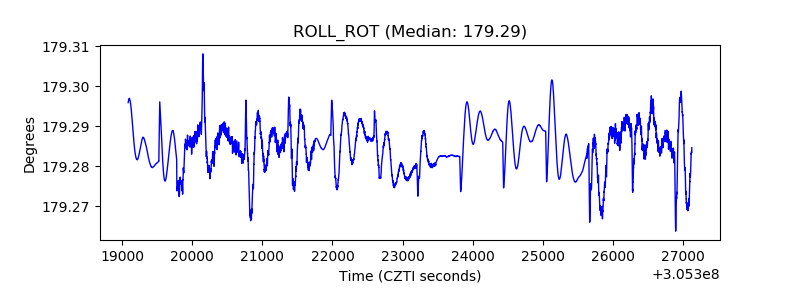 |
| _Roll_DEC |  |
| _Roll_RA | 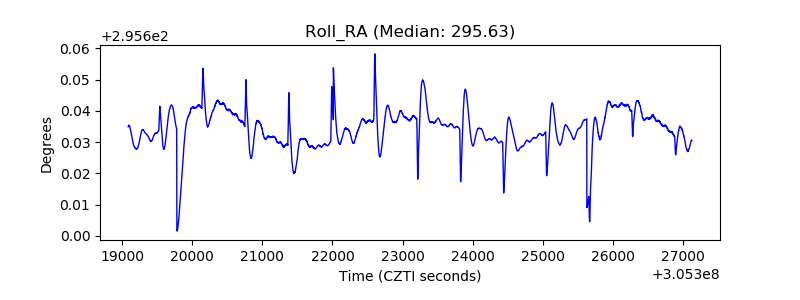 |
| Veto Counter | 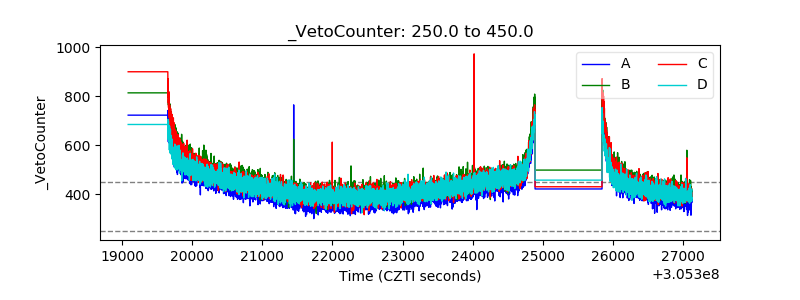 |