| Param | Original file | Final file |
|---|---|---|
| Filename | modeM0/AS1A05_037T01_9000003140_21282cztM0_level2.evt | modeM0/AS1A05_037T01_9000003140_21282cztM0_level2_quad_clean.evt |
| Size (bytes) | 580,294,080 | 113,938,560 |
| Size | 553.4 MB | 108.7 MB |
| Events in quadrant A | 4,020,621 | 732,596 |
| Events in quadrant B | 4,044,890 | 747,783 |
| Events in quadrant C | 3,926,439 | 721,942 |
| Events in quadrant D | 5,040,348 | 693,001 |
| Mode M9 | |||
|---|---|---|---|
| Quadrant | BADHDUFLAG | Total packets | Discarded packets |
| A | 0 | 8 | 0 |
| B | 0 | 8 | 0 |
| C | 0 | 8 | 0 |
| D | 0 | 8 | 0 |
| Mode M0 | |||
|---|---|---|---|
| Quadrant | BADHDUFLAG | Total packets | Discarded packets |
| A | 0 | 17211 | 2 |
| B | 0 | 17187 | 2 |
| C | 0 | 16797 | 2 |
| D | 0 | 20262 | 2 |
| Mode SS | |||
|---|---|---|---|
| Quadrant | BADHDUFLAG | Total packets | Discarded packets |
| A | 0 | 164 | 0 |
| B | 0 | 164 | 0 |
| C | 0 | 164 | 0 |
| D | 0 | 164 | 0 |
| Quadrant | Total seconds | Saturated seconds | Saturation percentage |
|---|---|---|---|
| A | 7988 | 113 | 1.414622% |
| B | 7989 | 115 | 1.439479% |
| C | 7989 | 127 | 1.589686% |
| D | 7989 | 271 | 3.392164% |
Noise dominated data is calculated using 1-second bins in cleaned event files. If a bin has >2000 counts, and if more than 50% of those come from <1% of pixels, then it is considered to be noise-dominated and hence unusable.
| Quadrant | # 1 sec bins | Bins with >0 counts | Bins with >2000 counts | High rate bins dominated by noise | Noise dominated (total time) | Noise dominated (detector-on time) | Marked lightcurve |
|---|---|---|---|---|---|---|---|
| A | 8753 | 7990 | 53 | 53 | 0.61% | 0.66% | 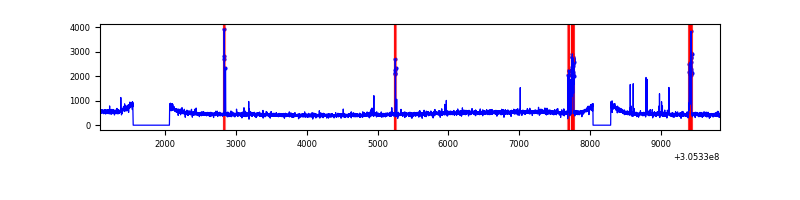 |
| B | 8754 | 7990 | 14 | 14 | 0.16% | 0.18% | 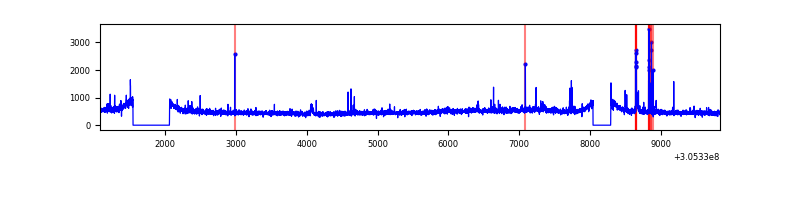 |
| C | 8754 | 7991 | 0 | 0 | 0.00% | 0.00% | 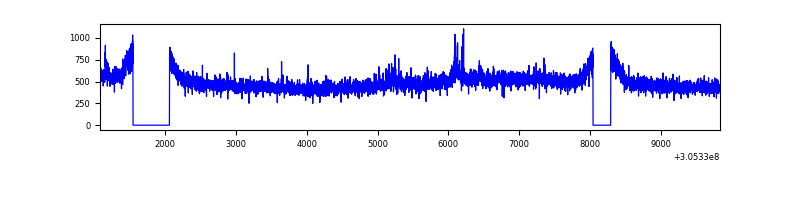 |
| D | 8754 | 7990 | 174 | 174 | 1.99% | 2.18% | 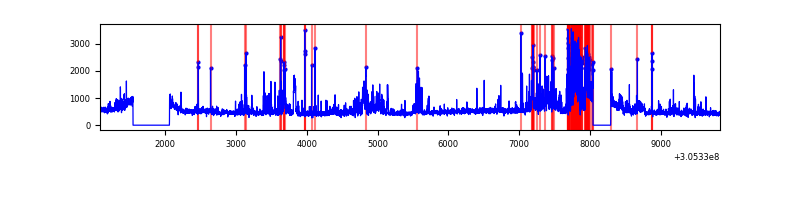 |
Top three noisy pixels from each quadrant. If the there are fewer than three noisy pixels in the level2.evt file, extra rows are filled as -1
| Pixel properties | Quadrant properties | ||||||
|---|---|---|---|---|---|---|---|
| Quadrant | DetID | PixID | Counts | Sigma | Mean | Median | Sigma |
| A | 4 | 2 | 93267 | 461.17 | 984 | 962 | 200.2 |
| A | 15 | 174 | 75861 | 374.21 | 984 | 962 | 200.2 |
| A | 5 | 16 | 49103 | 240.52 | 984 | 962 | 200.2 |
| B | 3 | 64 | 49617 | 253.27 | 987 | 962 | 192.1 |
| B | 0 | 228 | 34841 | 176.36 | 987 | 962 | 192.1 |
| B | 0 | 230 | 29246 | 147.23 | 987 | 962 | 192.1 |
| C | 14 | 238 | 145963 | 655.52 | 944 | 948 | 221.2 |
| C | 3 | 233 | 79162 | 353.55 | 944 | 948 | 221.2 |
| C | 8 | 128 | 12565 | 52.51 | 944 | 948 | 221.2 |
| D | 12 | 233 | 492780 | 2124.65 | 947 | 919 | 231.5 |
| D | 13 | 174 | 447277 | 1928.1 | 947 | 919 | 231.5 |
| D | 1 | 52 | 197547 | 849.36 | 947 | 919 | 231.5 |
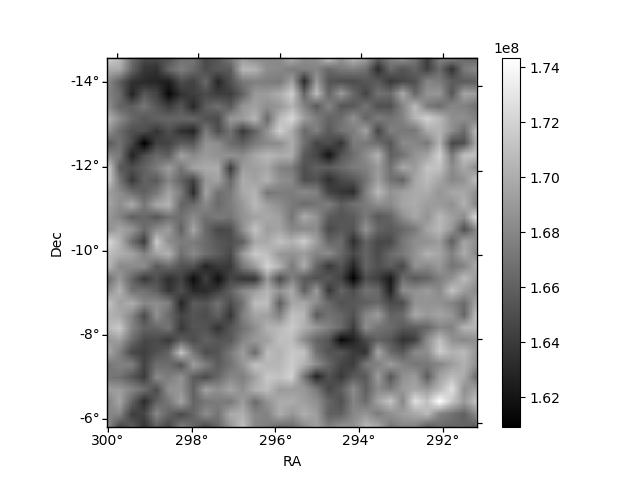
Histogram calculated using DETX and DETY for each event in the final _common_clean file
| Quadrant A |  |
 |
Quadrant B |
|---|---|---|---|
| Quadrant D |  |
 |
Quadrant C |
| Plot type | Count rate plots | Images |
|---|---|---|
| Comparison with Poisson distribution Blue bars denote a histogram of data divided into 1 sec bins. Red curve is a Poisson curve with rate = median count rate of data. |
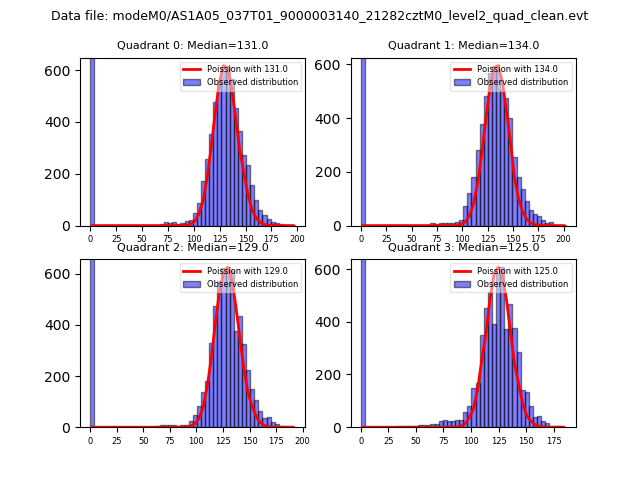 |
 |
| Quadrant-wise count rates Data is divided into 100 sec bins |
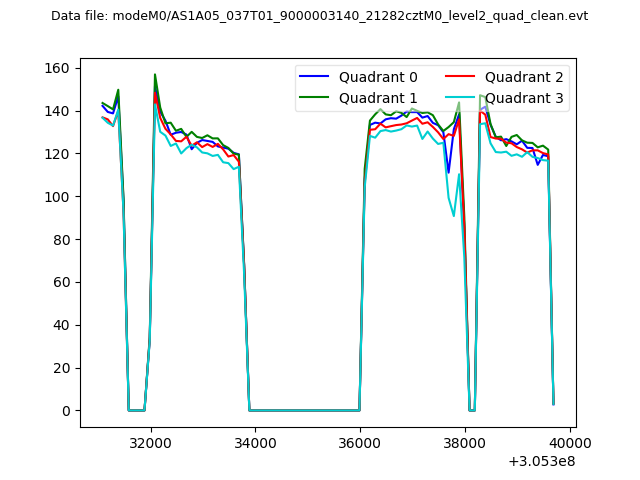 |
|
| Module-wise count rates for Quadrant A Data is divided into 100 sec bins |
 |
 |
| Module-wise count rates for Quadrant B Data is divided into 100 sec bins |
 |
 |
| Module-wise count rates for Quadrant C Data is divided into 100 sec bins |
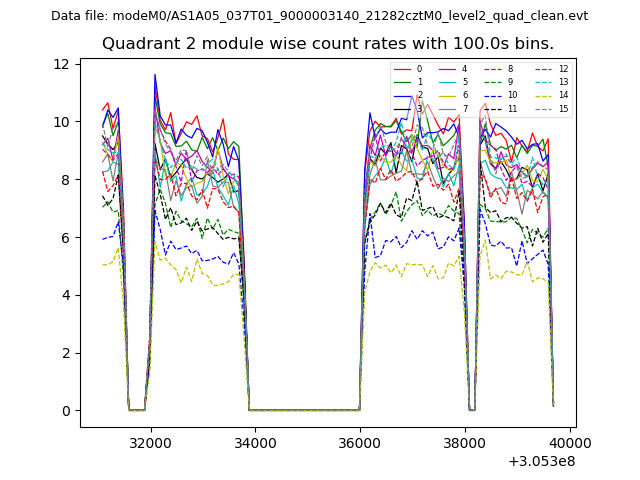 |
 |
| Module-wise count rates for Quadrant D Data is divided into 100 sec bins |
 |
 |
| Parameter | Plot |
|---|---|
| CZT HV Monitor | 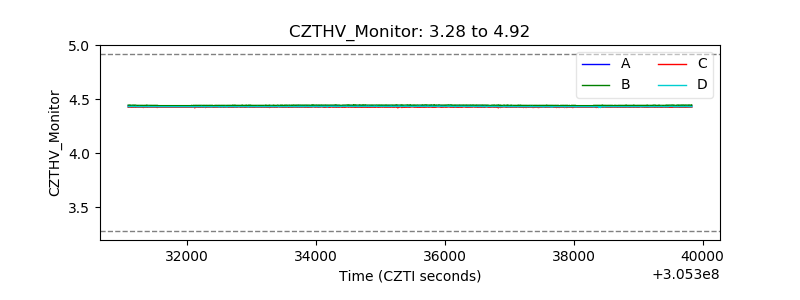 |
| D_VDD |  |
| Temperature 1 |  |
| Veto HV Monitor |  |
| Veto LLD |  |
| Alpha Counter | 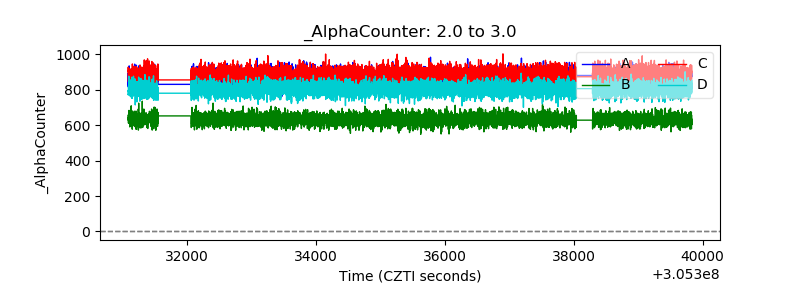 |
| _CPM_Rate | 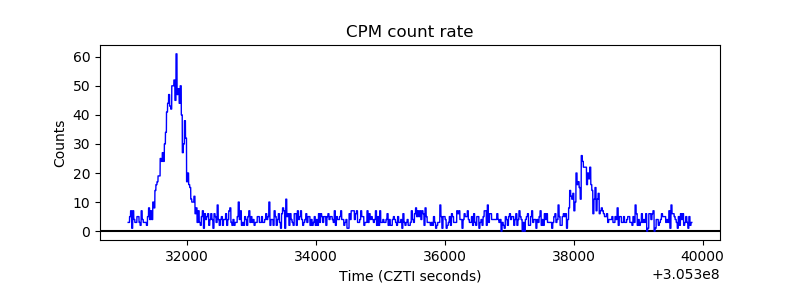 |
| CZT Counter |  |
| +2.5 Volts monitor |  |
| +5 Volts monitor |  |
| _ROLL_ROT |  |
| _Roll_DEC |  |
| _Roll_RA |  |
| Veto Counter |  |