| Param | Original file | Final file |
|---|---|---|
| Filename | modeM0/AS1A05_037T01_9000003140_21283cztM0_level2.evt | modeM0/AS1A05_037T01_9000003140_21283cztM0_level2_quad_clean.evt |
| Size (bytes) | 186,163,200 | 32,457,600 |
| Size | 177.5 MB | 31.0 MB |
| Events in quadrant A | 1,331,393 | 197,915 |
| Events in quadrant B | 1,366,169 | 203,315 |
| Events in quadrant C | 1,271,352 | 196,546 |
| Events in quadrant D | 1,479,610 | 187,645 |
| Mode M9 | |||
|---|---|---|---|
| Quadrant | BADHDUFLAG | Total packets | Discarded packets |
| A | 0 | 3 | 0 |
| B | 0 | 3 | 0 |
| C | 0 | 3 | 0 |
| D | 0 | 3 | 0 |
| Mode M0 | |||
|---|---|---|---|
| Quadrant | BADHDUFLAG | Total packets | Discarded packets |
| A | 0 | 5985 | 1 |
| B | 0 | 5992 | 1 |
| C | 0 | 5762 | 1 |
| D | 0 | 6393 | 1 |
| Mode SS | |||
|---|---|---|---|
| Quadrant | BADHDUFLAG | Total packets | Discarded packets |
| A | 0 | 56 | 0 |
| B | 0 | 56 | 0 |
| C | 0 | 56 | 0 |
| D | 0 | 56 | 0 |
| Quadrant | Total seconds | Saturated seconds | Saturation percentage |
|---|---|---|---|
| A | 2756 | 51 | 1.850508% |
| B | 2756 | 58 | 2.104499% |
| C | 2756 | 51 | 1.850508% |
| D | 2756 | 83 | 3.011611% |
Noise dominated data is calculated using 1-second bins in cleaned event files. If a bin has >2000 counts, and if more than 50% of those come from <1% of pixels, then it is considered to be noise-dominated and hence unusable.
| Quadrant | # 1 sec bins | Bins with >0 counts | Bins with >2000 counts | High rate bins dominated by noise | Noise dominated (total time) | Noise dominated (detector-on time) | Marked lightcurve |
|---|---|---|---|---|---|---|---|
| A | 3006 | 2757 | 18 | 18 | 0.60% | 0.65% | 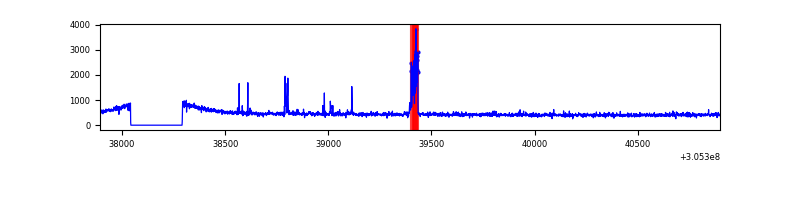 |
| B | 3006 | 2757 | 14 | 14 | 0.47% | 0.51% | 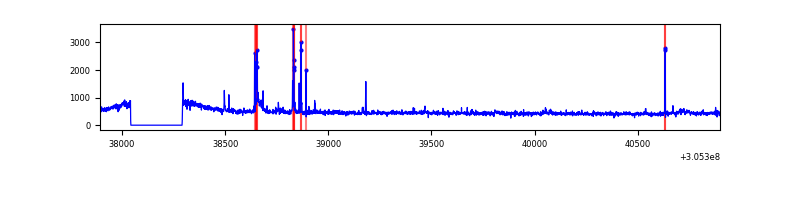 |
| C | 3006 | 2757 | 0 | 0 | 0.00% | 0.00% | 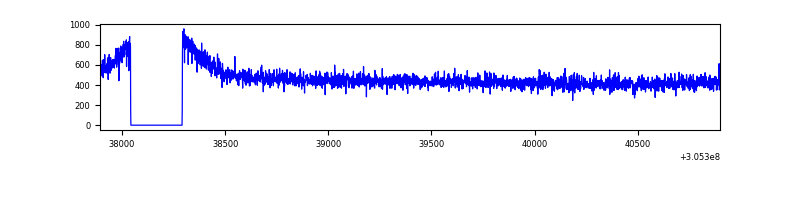 |
| D | 3006 | 2756 | 39 | 39 | 1.30% | 1.42% | 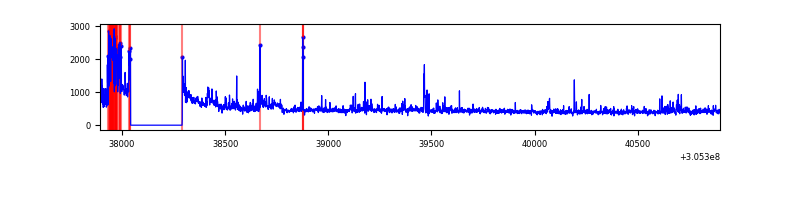 |
Top three noisy pixels from each quadrant. If the there are fewer than three noisy pixels in the level2.evt file, extra rows are filled as -1
| Pixel properties | Quadrant properties | ||||||
|---|---|---|---|---|---|---|---|
| Quadrant | DetID | PixID | Counts | Sigma | Mean | Median | Sigma |
| A | 15 | 174 | 58923 | 867.46 | 322 | 314 | 67.6 |
| A | 5 | 16 | 23073 | 336.85 | 322 | 314 | 67.6 |
| A | 13 | 254 | 4503 | 62.0 | 322 | 314 | 67.6 |
| B | 3 | 64 | 35373 | 544.47 | 326 | 318 | 64.4 |
| B | 0 | 228 | 30275 | 465.29 | 326 | 318 | 64.4 |
| B | 0 | 245 | 10142 | 152.58 | 326 | 318 | 64.4 |
| C | 14 | 238 | 47600 | 628.83 | 312 | 314 | 75.2 |
| C | 3 | 233 | 4167 | 51.24 | 312 | 314 | 75.2 |
| C | 13 | 61 | 2142 | 24.31 | 312 | 314 | 75.2 |
| D | 12 | 233 | 128081 | 1668.64 | 309 | 301 | 76.6 |
| D | 1 | 52 | 92745 | 1207.19 | 309 | 301 | 76.6 |
| D | 13 | 174 | 32601 | 421.79 | 309 | 301 | 76.6 |
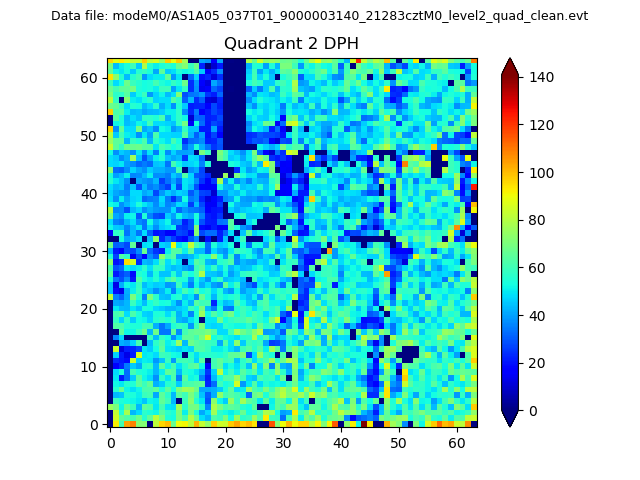
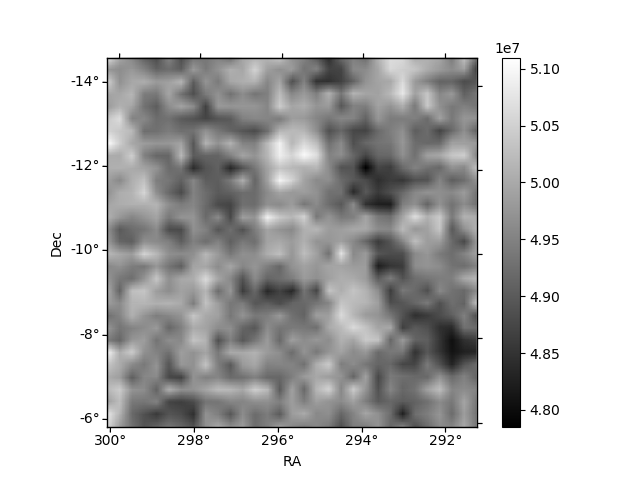
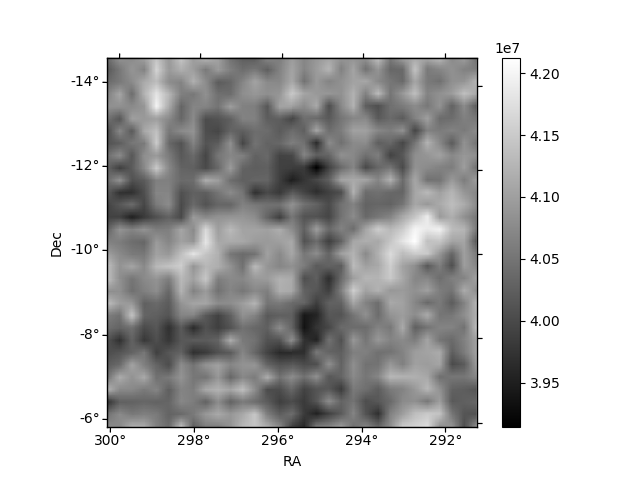
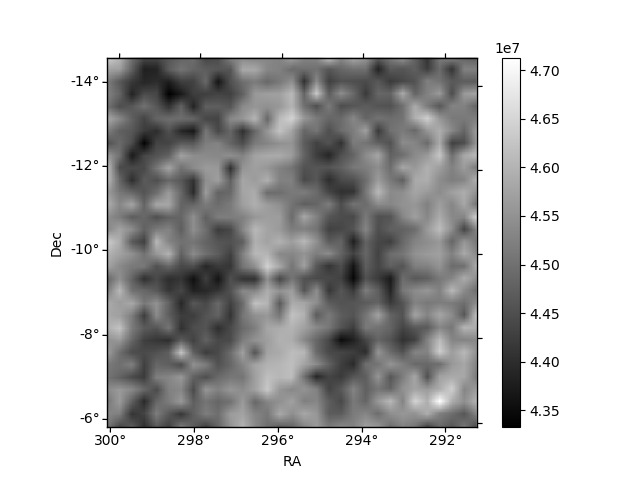
Histogram calculated using DETX and DETY for each event in the final _common_clean file
| Quadrant A | 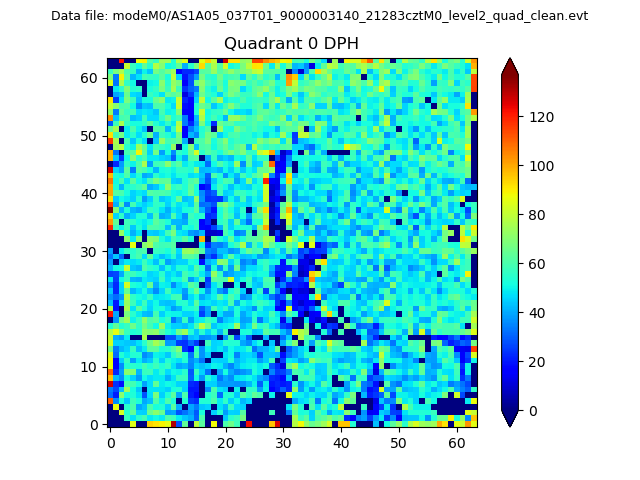 |
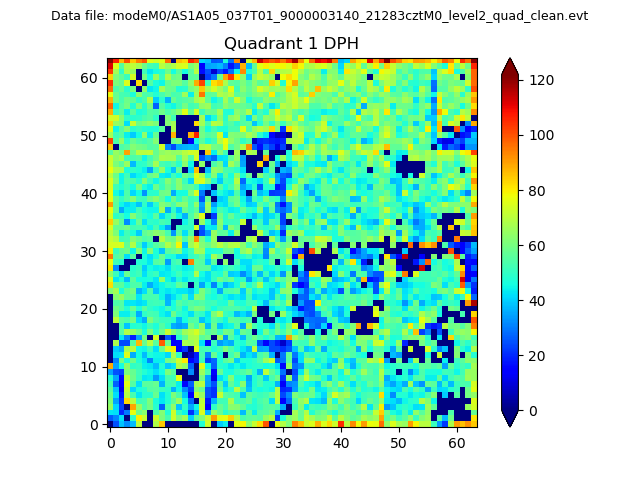 |
Quadrant B |
|---|---|---|---|
| Quadrant D | 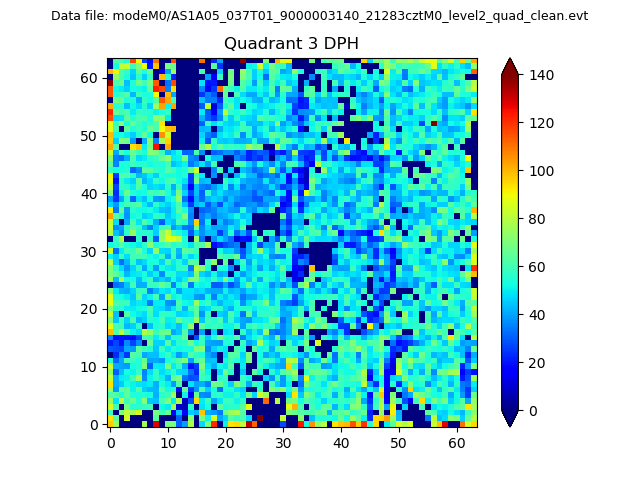 |
 |
Quadrant C |
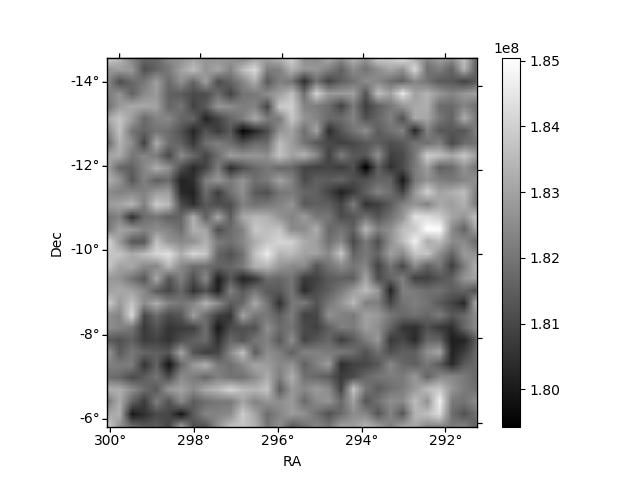
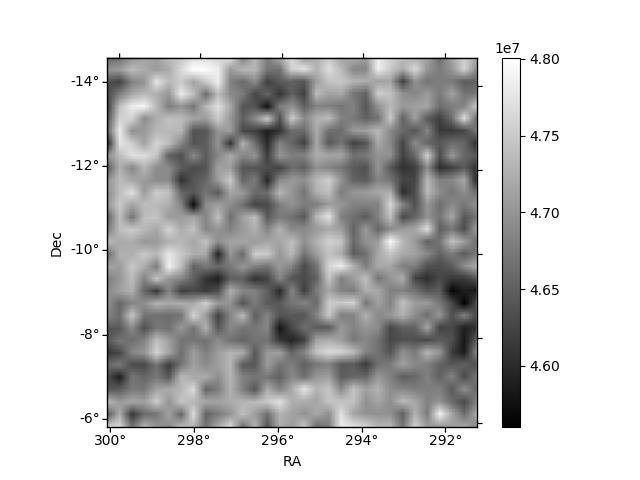
| Plot type | Count rate plots | Images |
|---|---|---|
| Comparison with Poisson distribution Blue bars denote a histogram of data divided into 1 sec bins. Red curve is a Poisson curve with rate = median count rate of data. |
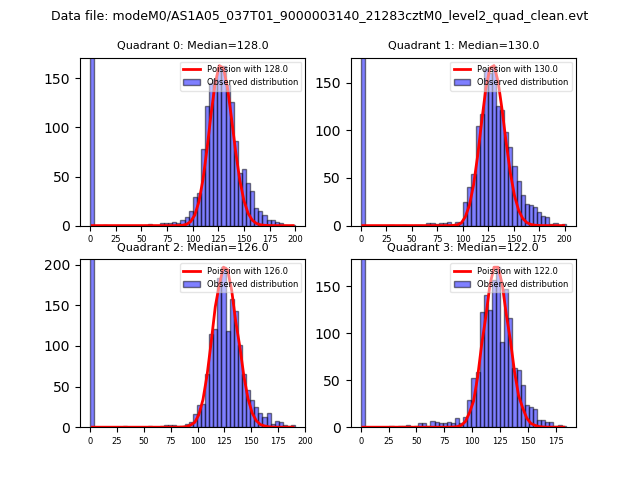 |
 |
| Quadrant-wise count rates Data is divided into 100 sec bins |
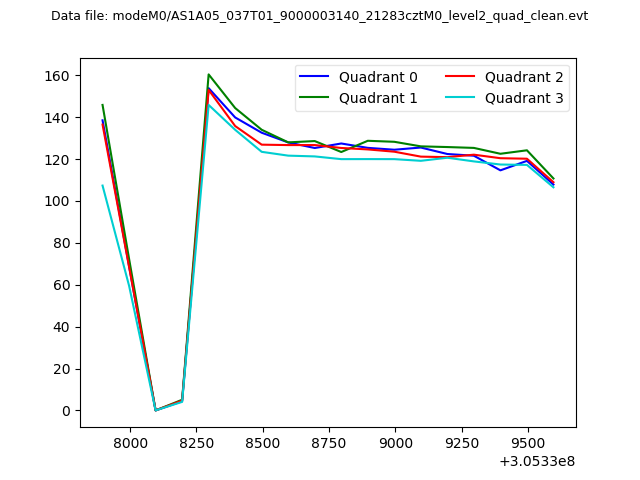 |
|
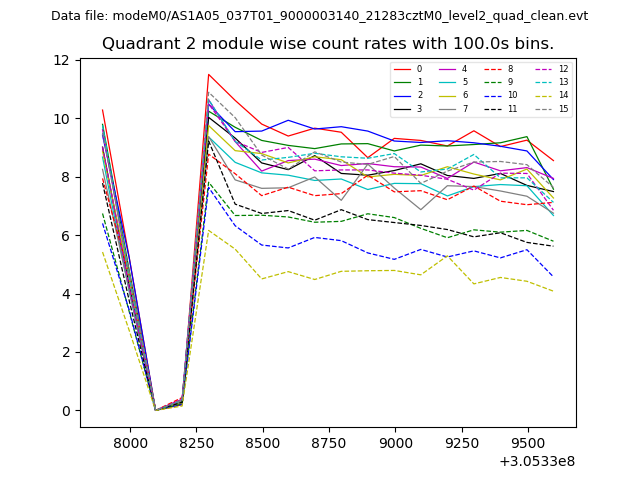
| Module-wise count rates for Quadrant A Data is divided into 100 sec bins |
 |
 |
| Module-wise count rates for Quadrant B Data is divided into 100 sec bins |
 |
 |
| Module-wise count rates for Quadrant C Data is divided into 100 sec bins |
 |
 |
| Module-wise count rates for Quadrant D Data is divided into 100 sec bins |
 |
 |
| Parameter | Plot |
|---|---|
| CZT HV Monitor | 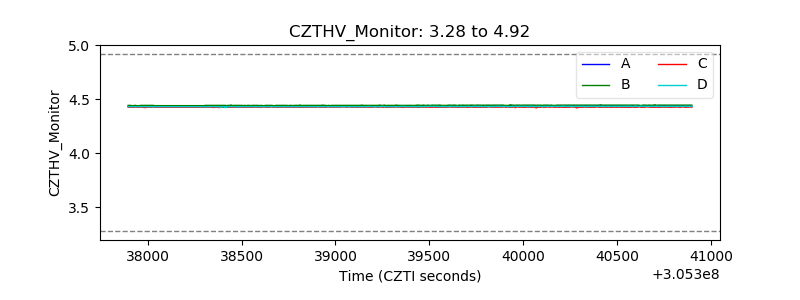 |
| D_VDD | 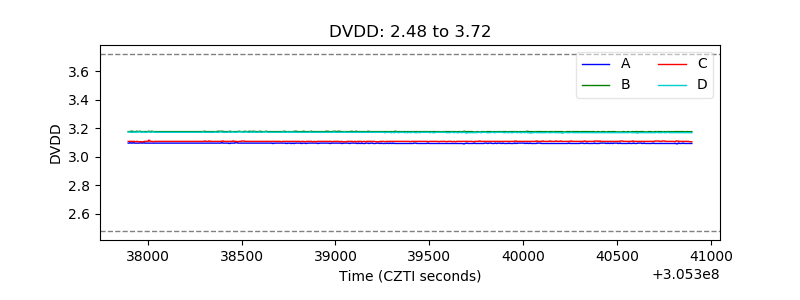 |
| Temperature 1 | 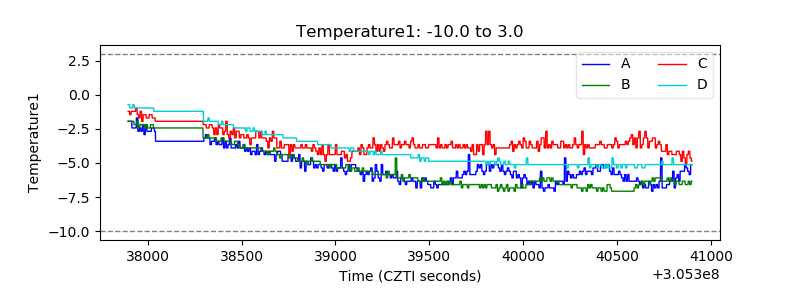 |
| Veto HV Monitor | 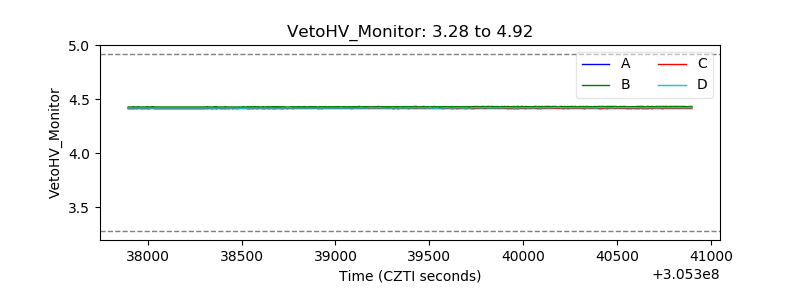 |
| Veto LLD |  |
| Alpha Counter | 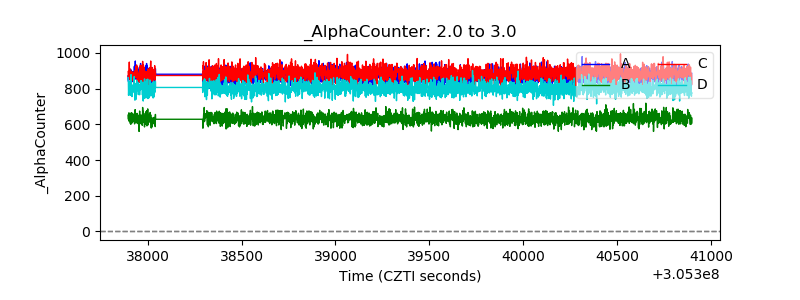 |
| _CPM_Rate | 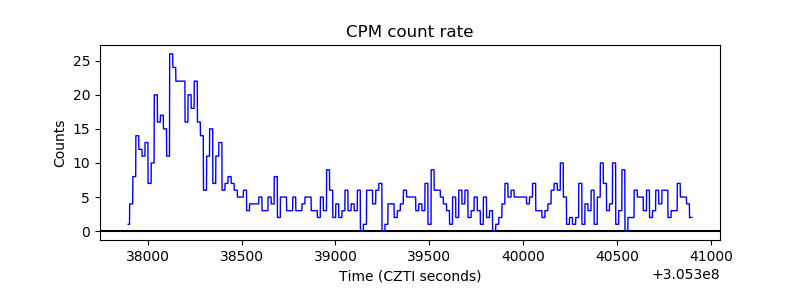 |
| CZT Counter | 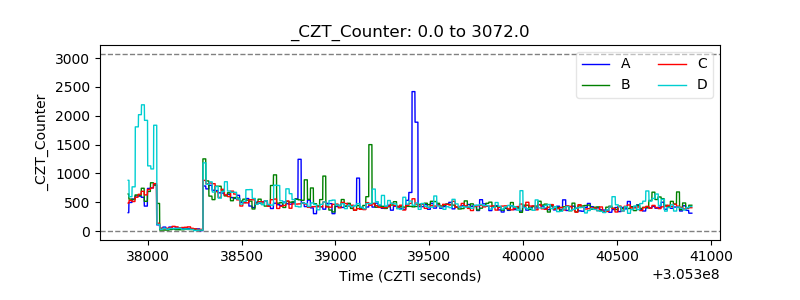 |
| +2.5 Volts monitor |  |
| +5 Volts monitor |  |
| _ROLL_ROT |  |
| _Roll_DEC | 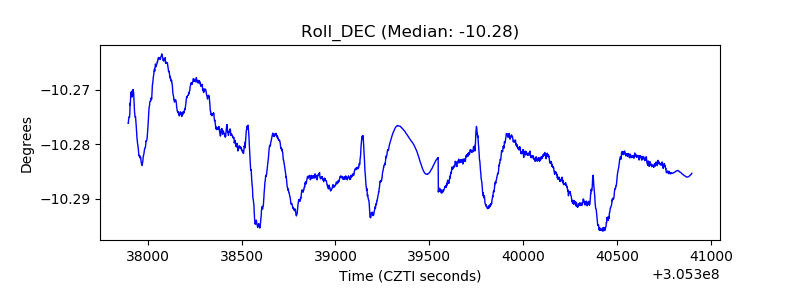 |
| _Roll_RA | 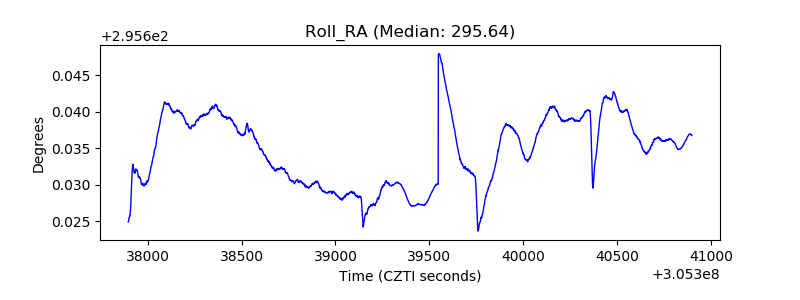 |
| Veto Counter |  |