| Param | Original file | Final file |
|---|---|---|
| Filename | modeM0/AS1A05_062T02_9000003138cztM0_level2.fits | modeM0/AS1A05_062T02_9000003138cztM0_level2_quad_clean.evt |
| Size (bytes) | 327,280,320 | 254,278,080 |
| Size | 312.1 MB | 242.5 MB |
| Events in quadrant A | 2,041,878 | 1,436,662 |
| Events in quadrant B | 1,977,702 | 1,470,448 |
| Events in quadrant C | 2,013,752 | 1,442,834 |
| Events in quadrant D | 1,616,666 | 1,090,809 |
| Mode M9 | |||
|---|---|---|---|
| Quadrant | BADHDUFLAG | Total packets | Discarded packets |
| A | 0 | 71 | 0 |
| B | 0 | 71 | 0 |
| C | 0 | 71 | 0 |
| D | 0 | 71 | 0 |
| Mode M0 | |||
|---|---|---|---|
| Quadrant | BADHDUFLAG | Total packets | Discarded packets |
| A | 0 | 82008 | 0 |
| B | 0 | 74592 | 0 |
| C | 0 | 69484 | 0 |
| D | 0 | 140548 | 0 |
| Mode SS | |||
|---|---|---|---|
| Quadrant | BADHDUFLAG | Total packets | Discarded packets |
| A | 0 | 674 | 0 |
| B | 0 | 674 | 0 |
| C | 0 | 674 | 0 |
| D | 0 | 674 | 0 |
| Quadrant | Total seconds | Saturated seconds | Saturation percentage |
|---|---|---|---|
| A | 32863 | 1574 | 4.789581% |
| B | 32863 | 961 | 2.924261% |
| C | 32863 | 676 | 2.057025% |
| D | 32862 | 5580 | 16.980099% |
Noise dominated data is calculated using 1-second bins in cleaned event files. If a bin has >2000 counts, and if more than 50% of those come from <1% of pixels, then it is considered to be noise-dominated and hence unusable.
| Quadrant | # 1 sec bins | Bins with >0 counts | Bins with >2000 counts | High rate bins dominated by noise | Noise dominated (total time) | Noise dominated (detector-on time) | Marked lightcurve |
|---|---|---|---|---|---|---|---|
| A | 40108 | 32833 | 0 | 0 | 0.00% | 0.00% |  |
| B | 40108 | 32849 | 0 | 0 | 0.00% | 0.00% |  |
| C | 40108 | 32856 | 0 | 0 | 0.00% | 0.00% |  |
| D | 40108 | 32725 | 0 | 0 | 0.00% | 0.00% |  |
Top three noisy pixels from each quadrant. If the there are fewer than three noisy pixels in the level2.evt file, extra rows are filled as -1
| Pixel properties | Quadrant properties | ||||||
|---|---|---|---|---|---|---|---|
| Quadrant | DetID | PixID | Counts | Sigma | Mean | Median | Sigma |
| A | 0 | 29 | 1917 | 10.9 | 533 | 502 | 129.8 |
| A | 7 | 110 | 1616 | 8.58 | 533 | 502 | 129.8 |
| A | 0 | 30 | 1530 | 7.92 | 533 | 502 | 129.8 |
| B | 2 | 9 | 1525 | 10.05 | 523 | 500 | 102.0 |
| B | 5 | 225 | 1319 | 8.03 | 523 | 500 | 102.0 |
| B | 5 | 128 | 1305 | 7.89 | 523 | 500 | 102.0 |
| C | 1 | 80 | 1565 | 7.83 | 531 | 497 | 136.3 |
| C | 1 | 81 | 1528 | 7.56 | 531 | 497 | 136.3 |
| C | 12 | 241 | 1403 | 6.65 | 531 | 497 | 136.3 |
| D | 7 | 3 | 1197 | 6.29 | 462 | 422 | 123.3 |
| D | 6 | 67 | 1181 | 6.16 | 462 | 422 | 123.3 |
| D | 3 | 14 | 1173 | 6.09 | 462 | 422 | 123.3 |
Histogram calculated using DETX and DETY for each event in the final _common_clean file
| Quadrant A | 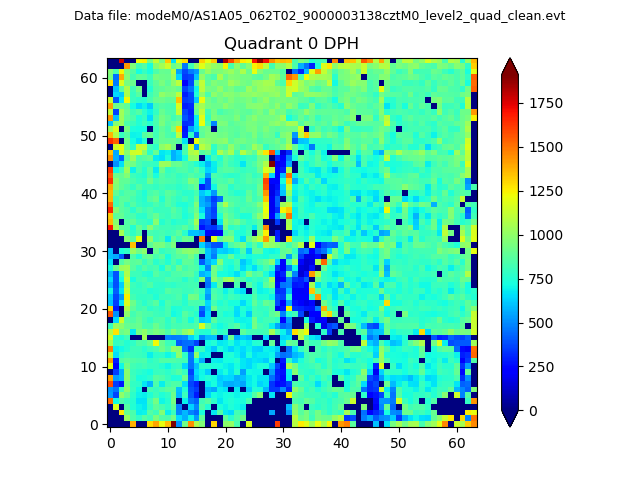 |
 |
Quadrant B |
|---|---|---|---|
| Quadrant D |  |
 |
Quadrant C |
| Plot type | Count rate plots | Images |
|---|---|---|
| Comparison with Poisson distribution Blue bars denote a histogram of data divided into 1 sec bins. Red curve is a Poisson curve with rate = median count rate of data. |
 |
 |
| Quadrant-wise count rates Data is divided into 100 sec bins |
 |
|
| Module-wise count rates for Quadrant A Data is divided into 100 sec bins |
 |
 |
| Module-wise count rates for Quadrant B Data is divided into 100 sec bins |
 |
 |
| Module-wise count rates for Quadrant C Data is divided into 100 sec bins |
 |
 |
| Module-wise count rates for Quadrant D Data is divided into 100 sec bins |
 |
 |
| Parameter | Plot |
|---|---|
| CZT HV Monitor |  |
| D_VDD |  |
| Temperature 1 |  |
| Veto HV Monitor |  |
| Veto LLD |  |
| Alpha Counter |  |
| _CPM_Rate |  |
| CZT Counter |  |
| +2.5 Volts monitor |  |
| +5 Volts monitor |  |
| _ROLL_ROT |  |
| _Roll_DEC |  |
| _Roll_RA |  |
| Veto Counter |  |