| Param | Original file | Final file |
|---|---|---|
| Filename | modeM0/AS1A05_062T02_9000003138_21228cztM0_level2.evt | modeM0/AS1A05_062T02_9000003138_21228cztM0_level2_quad_clean.evt |
| Size (bytes) | 741,038,400 | 81,432,000 |
| Size | 706.7 MB | 77.7 MB |
| Events in quadrant A | 7,037,366 | 457,405 |
| Events in quadrant B | 4,690,851 | 509,881 |
| Events in quadrant C | 3,563,563 | 514,980 |
| Events in quadrant D | 6,655,916 | 473,340 |
| Mode M9 | |||
|---|---|---|---|
| Quadrant | BADHDUFLAG | Total packets | Discarded packets |
| A | 0 | 13 | 0 |
| B | 0 | 13 | 0 |
| C | 0 | 13 | 0 |
| D | 0 | 13 | 0 |
| Mode M0 | |||
|---|---|---|---|
| Quadrant | BADHDUFLAG | Total packets | Discarded packets |
| A | 0 | 26069 | 2 |
| B | 0 | 18302 | 2 |
| C | 0 | 15092 | 2 |
| D | 0 | 24801 | 2 |
| Mode SS | |||
|---|---|---|---|
| Quadrant | BADHDUFLAG | Total packets | Discarded packets |
| A | 0 | 152 | 0 |
| B | 0 | 152 | 0 |
| C | 0 | 152 | 0 |
| D | 0 | 152 | 0 |
| Quadrant | Total seconds | Saturated seconds | Saturation percentage |
|---|---|---|---|
| A | 7313 | 1170 | 15.998906% |
| B | 7313 | 509 | 6.960208% |
| C | 7313 | 170 | 2.324627% |
| D | 7313 | 715 | 9.777109% |
Noise dominated data is calculated using 1-second bins in cleaned event files. If a bin has >2000 counts, and if more than 50% of those come from <1% of pixels, then it is considered to be noise-dominated and hence unusable.
| Quadrant | # 1 sec bins | Bins with >0 counts | Bins with >2000 counts | High rate bins dominated by noise | Noise dominated (total time) | Noise dominated (detector-on time) | Marked lightcurve |
|---|---|---|---|---|---|---|---|
| A | 8693 | 7313 | 991 | 991 | 11.40% | 13.55% | 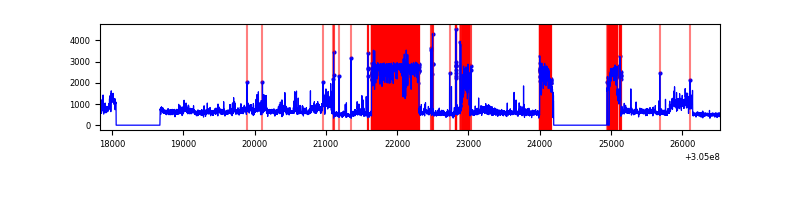 |
| B | 8693 | 7313 | 331 | 331 | 3.81% | 4.53% | 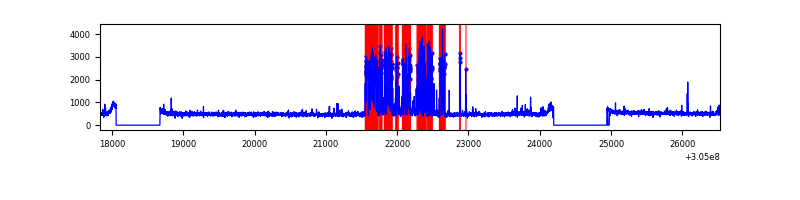 |
| C | 8693 | 7314 | 0 | 0 | 0.00% | 0.00% | 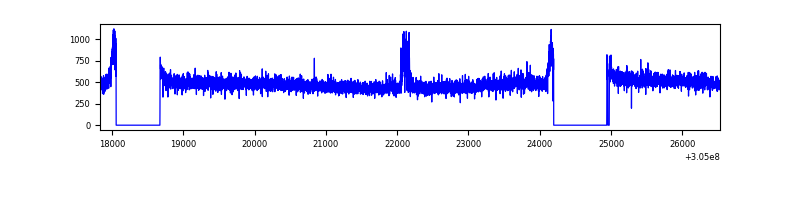 |
| D | 8693 | 7314 | 402 | 402 | 4.62% | 5.50% | 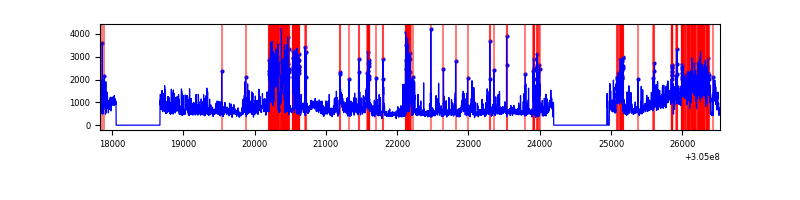 |
Top three noisy pixels from each quadrant. If the there are fewer than three noisy pixels in the level2.evt file, extra rows are filled as -1
| Pixel properties | Quadrant properties | ||||||
|---|---|---|---|---|---|---|---|
| Quadrant | DetID | PixID | Counts | Sigma | Mean | Median | Sigma |
| A | 15 | 236 | 3623886 | 21701.74 | 825 | 808 | 166.9 |
| A | 11 | 47 | 166552 | 992.78 | 825 | 808 | 166.9 |
| A | 5 | 16 | 34777 | 203.47 | 825 | 808 | 166.9 |
| B | 0 | 189 | 1059955 | 6201.19 | 888 | 866 | 170.8 |
| B | 0 | 228 | 37151 | 212.45 | 888 | 866 | 170.8 |
| B | 0 | 197 | 32657 | 186.14 | 888 | 866 | 170.8 |
| C | 14 | 238 | 135551 | 653.86 | 871 | 877 | 206.0 |
| C | 6 | 14 | 34457 | 163.03 | 871 | 877 | 206.0 |
| C | 13 | 61 | 5973 | 24.74 | 871 | 877 | 206.0 |
| D | 13 | 174 | 1887219 | 8876.2 | 858 | 831 | 212.5 |
| D | 1 | 52 | 1023935 | 4814.1 | 858 | 831 | 212.5 |
| D | 13 | 153 | 244135 | 1144.84 | 858 | 831 | 212.5 |
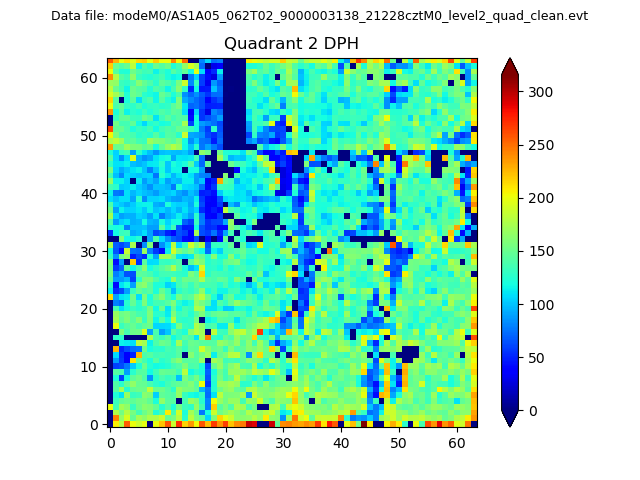
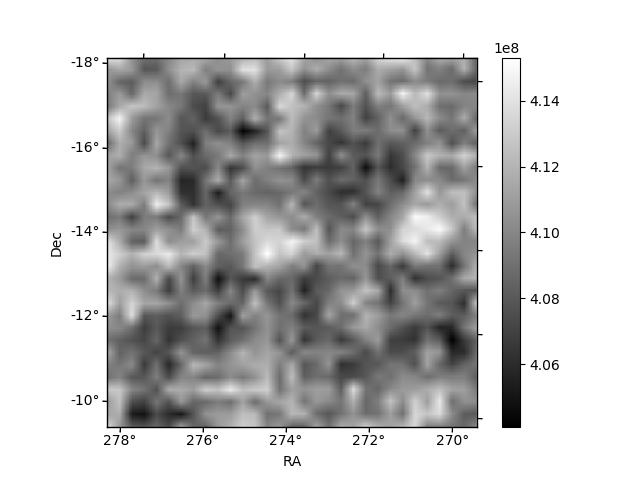
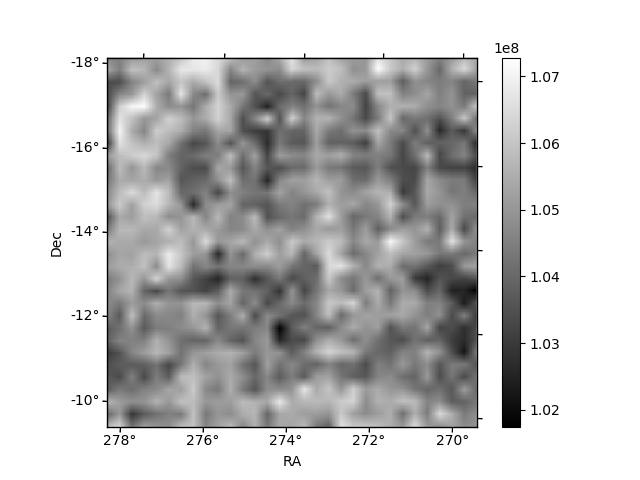
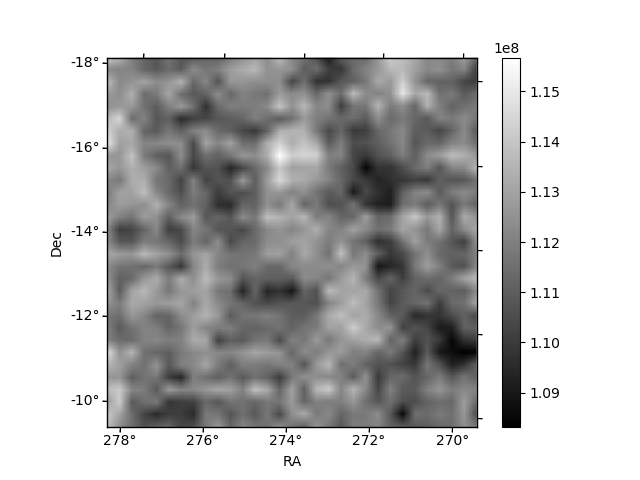
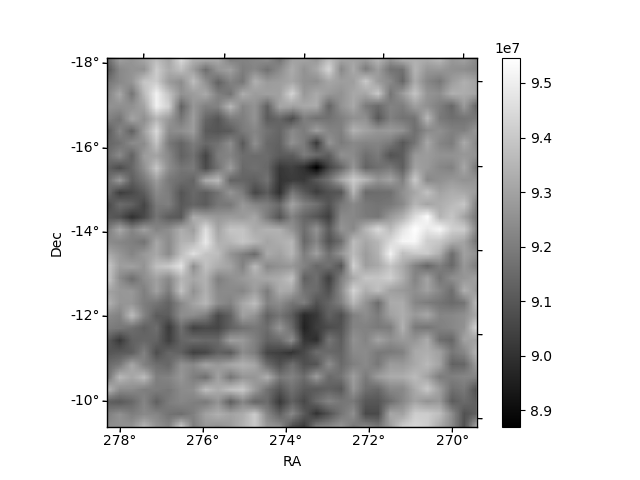
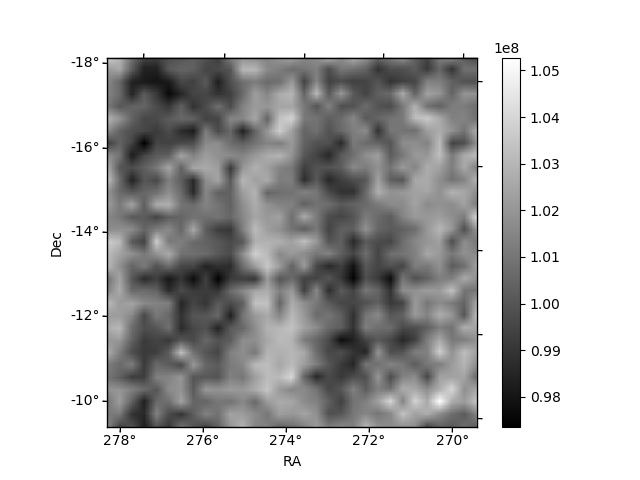
Histogram calculated using DETX and DETY for each event in the final _common_clean file
| Quadrant A | 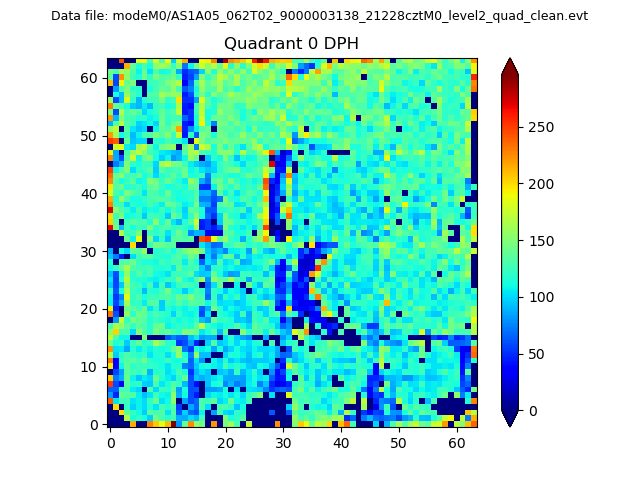 |
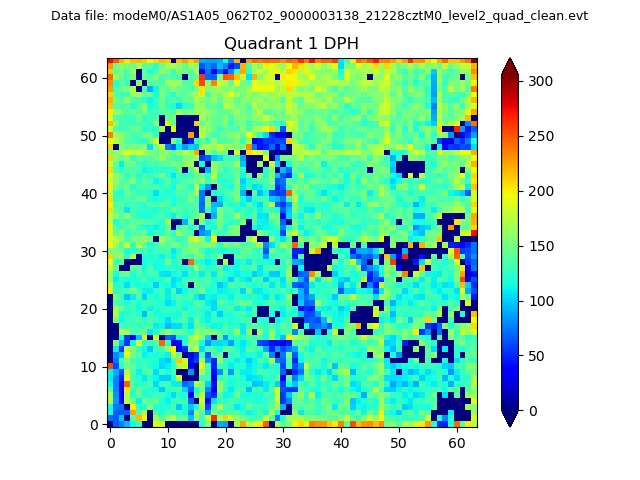 |
Quadrant B |
|---|---|---|---|
| Quadrant D | 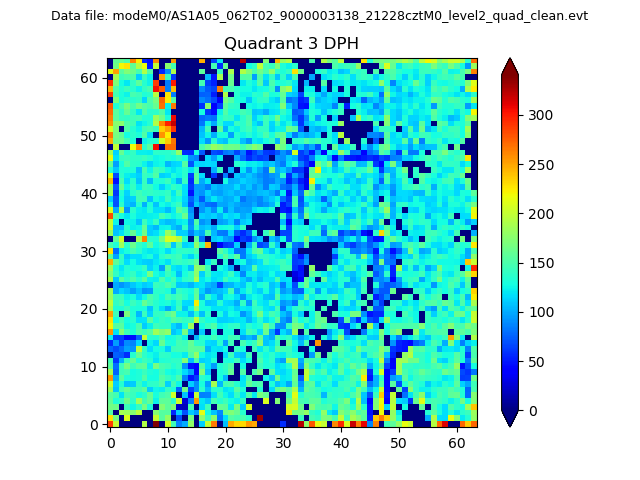 |
 |
Quadrant C |
| Plot type | Count rate plots | Images |
|---|---|---|
| Comparison with Poisson distribution Blue bars denote a histogram of data divided into 1 sec bins. Red curve is a Poisson curve with rate = median count rate of data. |
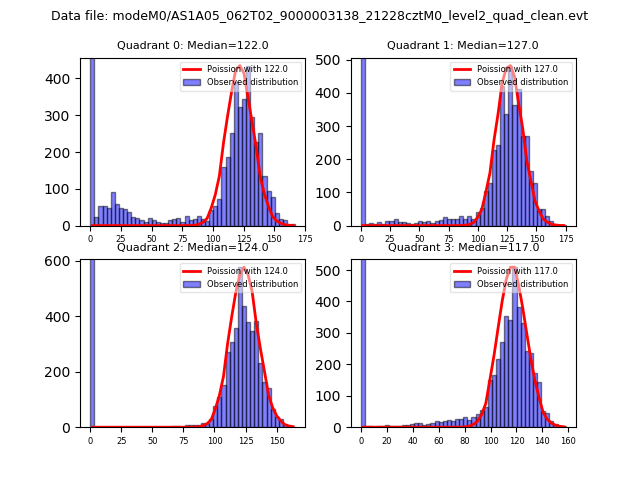 |
 |
| Quadrant-wise count rates Data is divided into 100 sec bins |
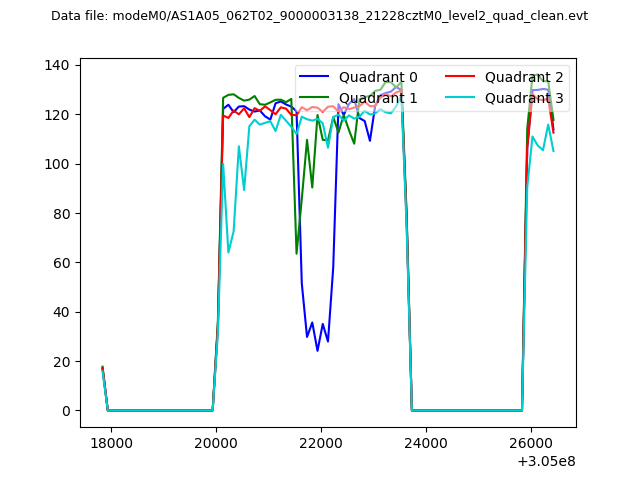 |
|
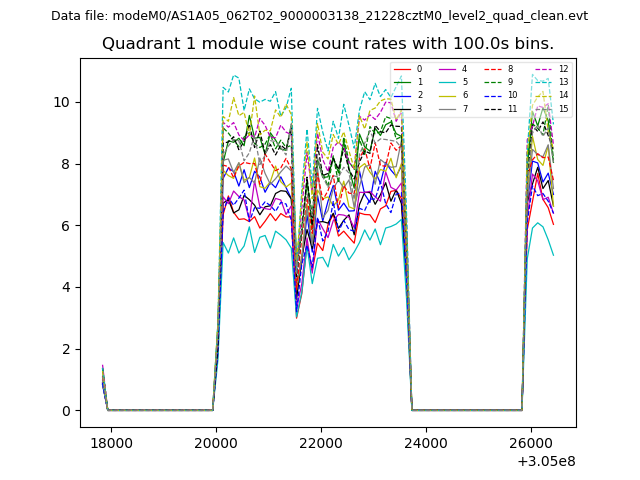
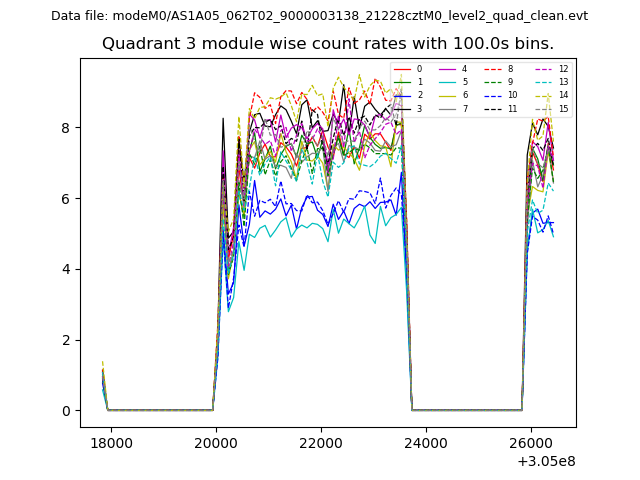
| Module-wise count rates for Quadrant A Data is divided into 100 sec bins |
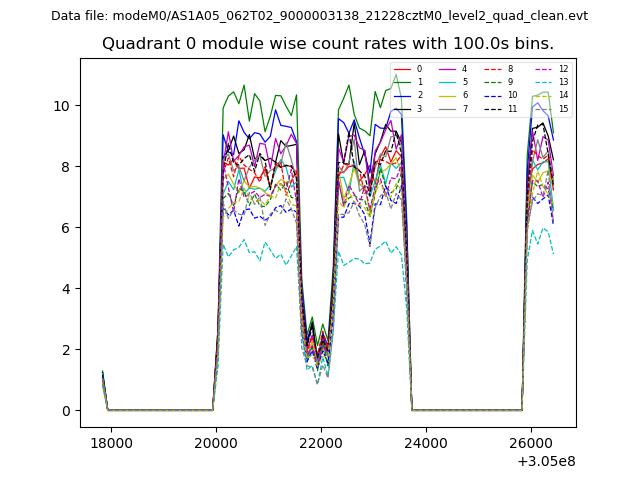 |
 |
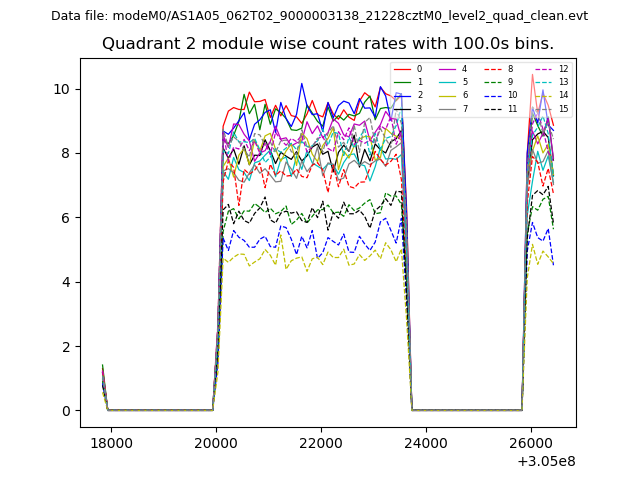
| Module-wise count rates for Quadrant B Data is divided into 100 sec bins |
 |
 |
| Module-wise count rates for Quadrant C Data is divided into 100 sec bins |
 |
 |
| Module-wise count rates for Quadrant D Data is divided into 100 sec bins |
 |
 |
| Parameter | Plot |
|---|---|
| CZT HV Monitor | 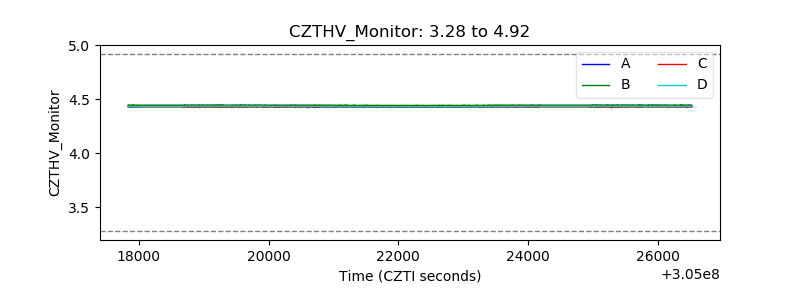 |
| D_VDD | 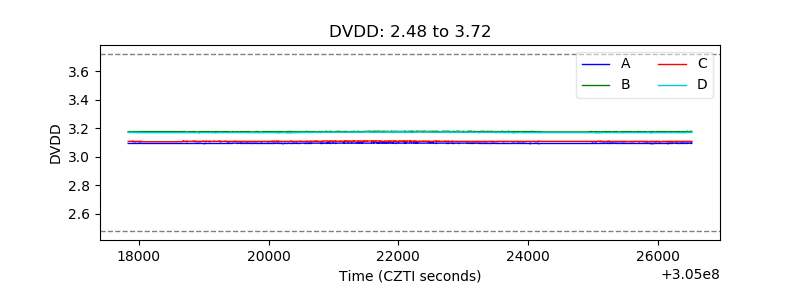 |
| Temperature 1 | 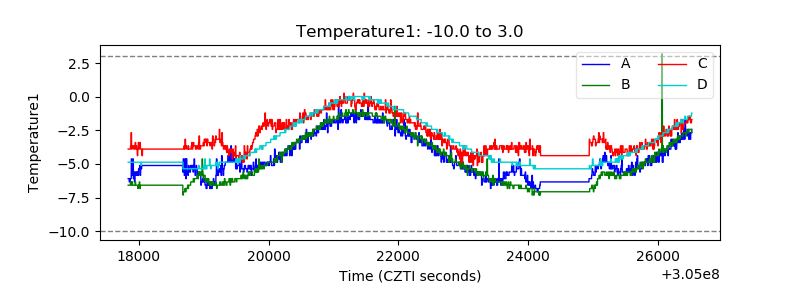 |
| Veto HV Monitor | 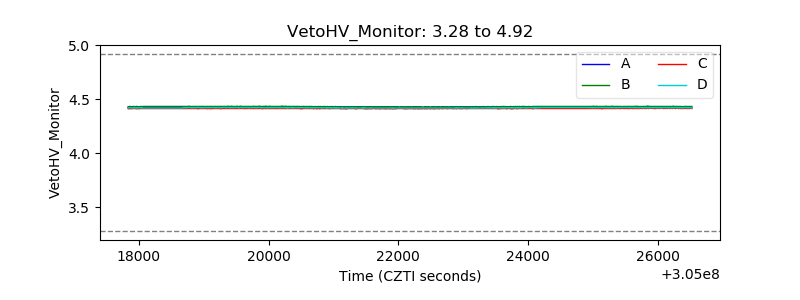 |
| Veto LLD | 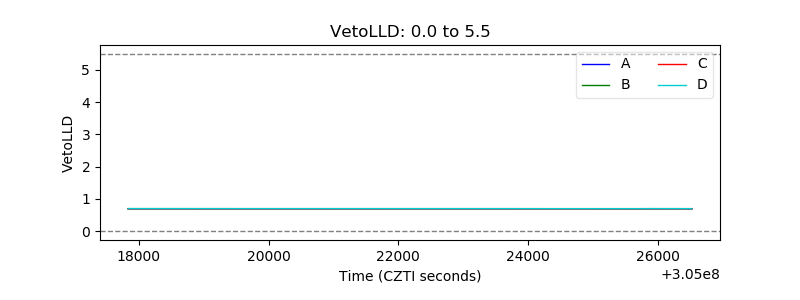 |
| Alpha Counter | 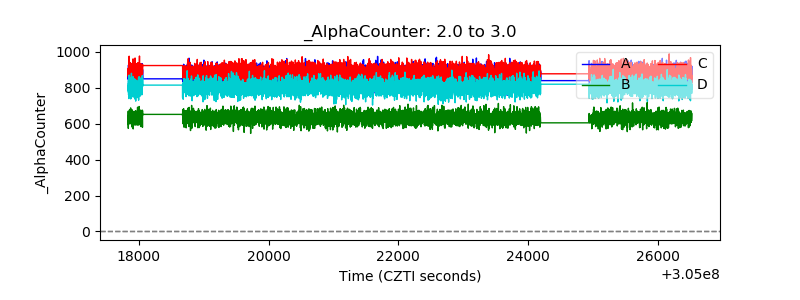 |
| _CPM_Rate | 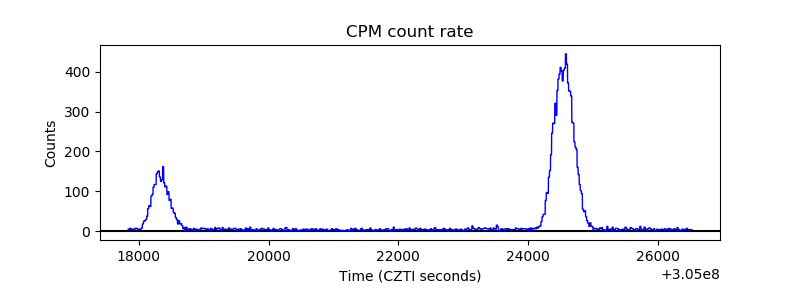 |
| CZT Counter | 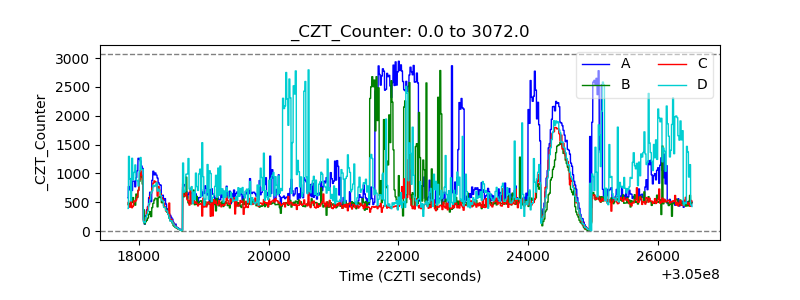 |
| +2.5 Volts monitor |  |
| +5 Volts monitor |  |
| _ROLL_ROT | 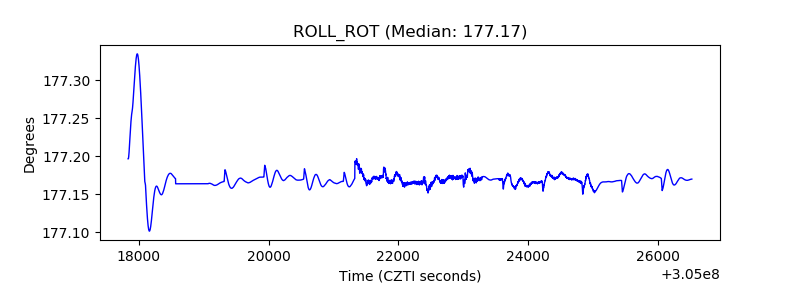 |
| _Roll_DEC | 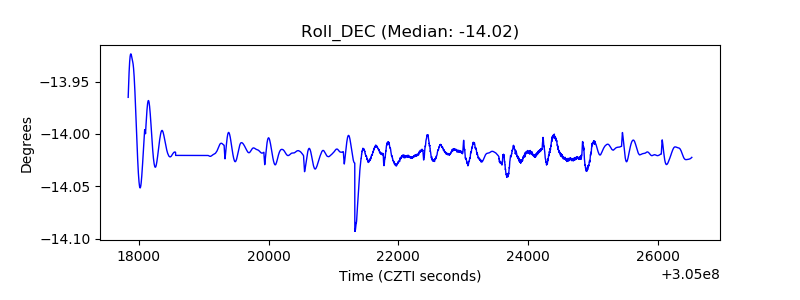 |
| _Roll_RA | 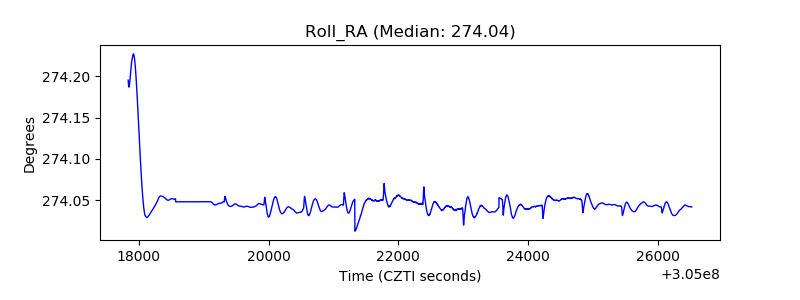 |
| Veto Counter | 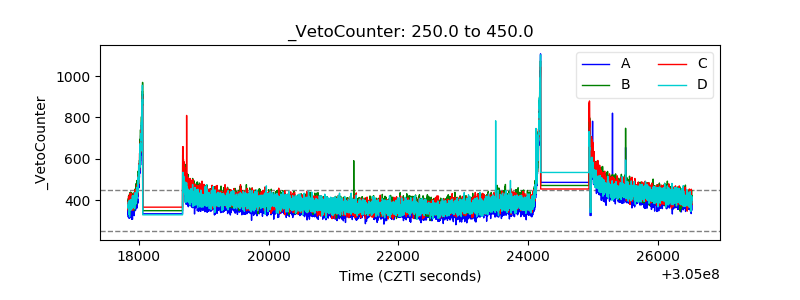 |