| Param | Original file | Final file |
|---|---|---|
| Filename | modeM0/AS1A05_062T02_9000003138_21229cztM0_level2.evt | modeM0/AS1A05_062T02_9000003138_21229cztM0_level2_quad_clean.evt |
| Size (bytes) | 610,594,560 | 89,026,560 |
| Size | 582.3 MB | 84.9 MB |
| Events in quadrant A | 3,473,027 | 579,757 |
| Events in quadrant B | 3,311,129 | 587,580 |
| Events in quadrant C | 3,128,829 | 566,953 |
| Events in quadrant D | 8,144,518 | 513,357 |
| Mode M9 | |||
|---|---|---|---|
| Quadrant | BADHDUFLAG | Total packets | Discarded packets |
| A | 0 | 9 | 0 |
| B | 0 | 9 | 0 |
| C | 0 | 9 | 0 |
| D | 0 | 9 | 0 |
| Mode M0 | |||
|---|---|---|---|
| Quadrant | BADHDUFLAG | Total packets | Discarded packets |
| A | 0 | 14574 | 1 |
| B | 0 | 13783 | 1 |
| C | 0 | 13326 | 1 |
| D | 0 | 28672 | 1 |
| Mode SS | |||
|---|---|---|---|
| Quadrant | BADHDUFLAG | Total packets | Discarded packets |
| A | 0 | 130 | 0 |
| B | 0 | 130 | 0 |
| C | 0 | 130 | 0 |
| D | 0 | 130 | 0 |
| Quadrant | Total seconds | Saturated seconds | Saturation percentage |
|---|---|---|---|
| A | 6422 | 71 | 1.105575% |
| B | 6422 | 79 | 1.230146% |
| C | 6422 | 91 | 1.417004% |
| D | 6422 | 1014 | 15.789474% |
Noise dominated data is calculated using 1-second bins in cleaned event files. If a bin has >2000 counts, and if more than 50% of those come from <1% of pixels, then it is considered to be noise-dominated and hence unusable.
| Quadrant | # 1 sec bins | Bins with >0 counts | Bins with >2000 counts | High rate bins dominated by noise | Noise dominated (total time) | Noise dominated (detector-on time) | Marked lightcurve |
|---|---|---|---|---|---|---|---|
| A | 7382 | 6422 | 4 | 4 | 0.05% | 0.06% | 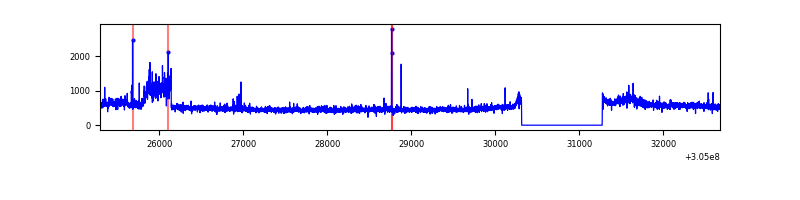 |
| B | 7382 | 6422 | 17 | 17 | 0.23% | 0.26% | 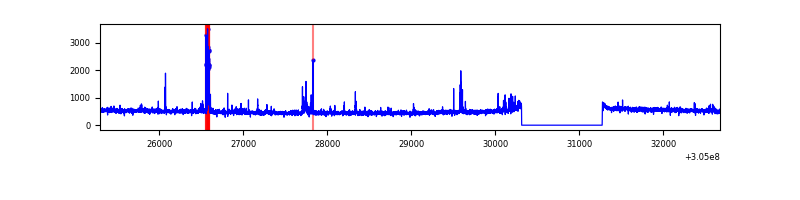 |
| C | 7382 | 6422 | 0 | 0 | 0.00% | 0.00% | 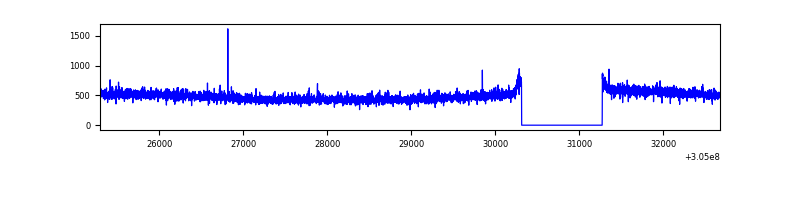 |
| D | 7382 | 6422 | 765 | 765 | 10.36% | 11.91% | 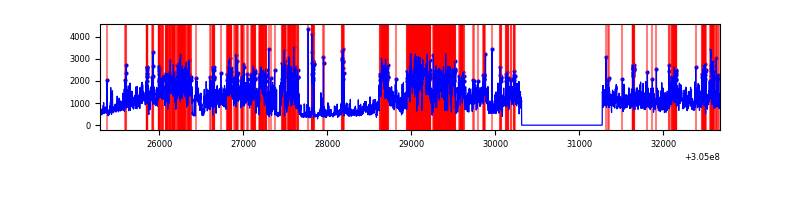 |
Top three noisy pixels from each quadrant. If the there are fewer than three noisy pixels in the level2.evt file, extra rows are filled as -1
| Pixel properties | Quadrant properties | ||||||
|---|---|---|---|---|---|---|---|
| Quadrant | DetID | PixID | Counts | Sigma | Mean | Median | Sigma |
| A | 15 | 236 | 213110 | 1303.23 | 810 | 795 | 162.9 |
| A | 11 | 47 | 55631 | 336.59 | 810 | 795 | 162.9 |
| A | 13 | 252 | 50050 | 302.34 | 810 | 795 | 162.9 |
| B | 0 | 197 | 102770 | 660.41 | 802 | 782 | 154.4 |
| B | 0 | 190 | 31147 | 196.62 | 802 | 782 | 154.4 |
| B | 12 | 111 | 18351 | 113.77 | 802 | 782 | 154.4 |
| C | 14 | 238 | 123109 | 676.44 | 770 | 773 | 180.9 |
| C | 13 | 61 | 5305 | 25.06 | 770 | 773 | 180.9 |
| C | 0 | 207 | 3313 | 14.04 | 770 | 773 | 180.9 |
| D | 13 | 174 | 3793280 | 20717.93 | 754 | 735 | 183.1 |
| D | 1 | 52 | 741200 | 4045.02 | 754 | 735 | 183.1 |
| D | 1 | 239 | 615811 | 3360.04 | 754 | 735 | 183.1 |
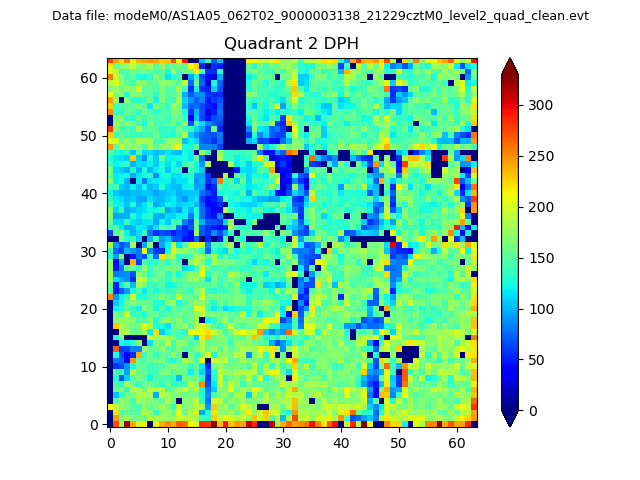
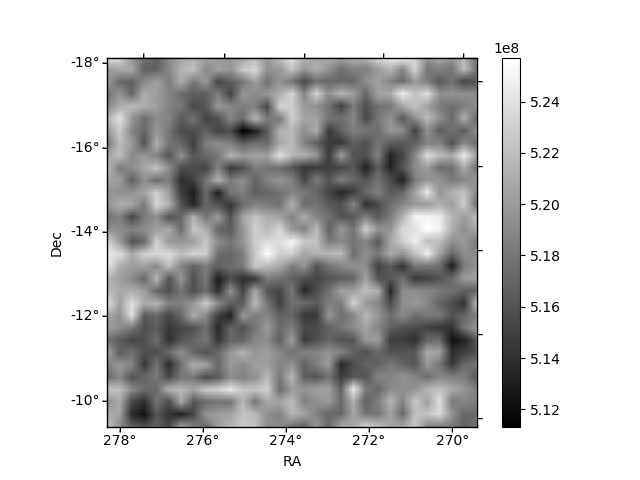
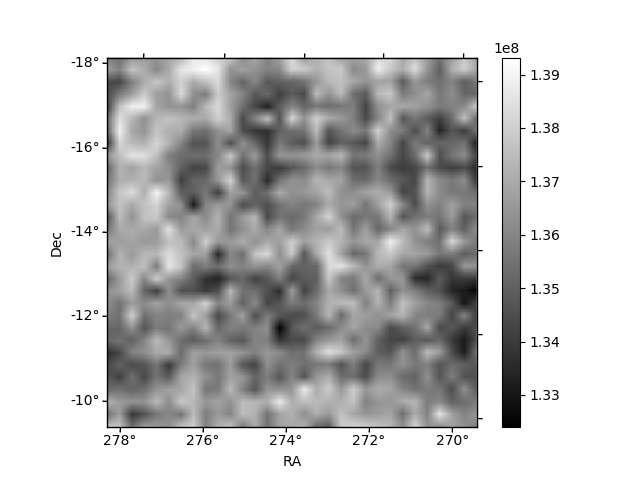
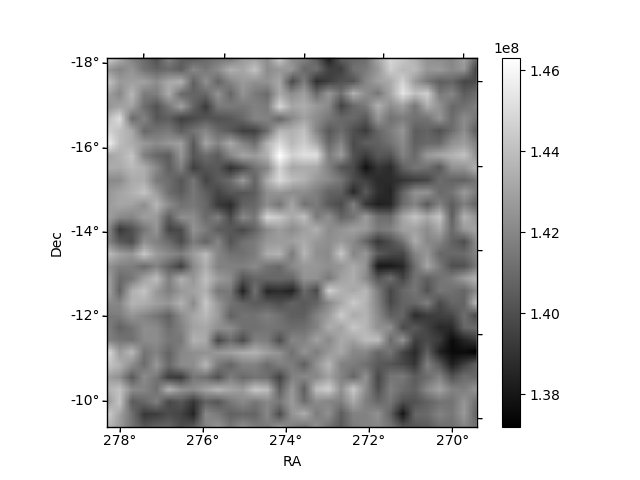
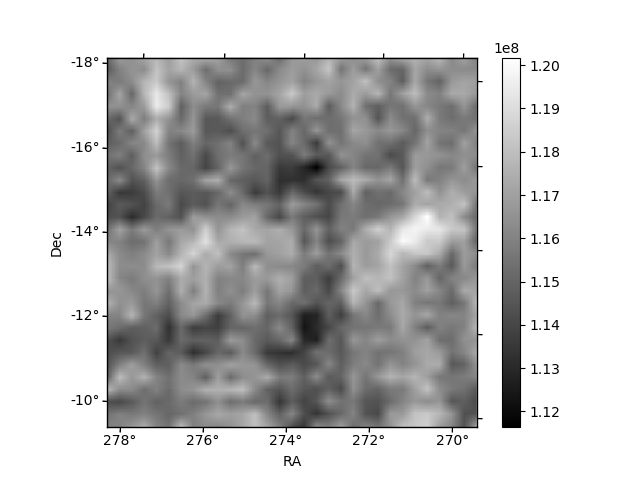
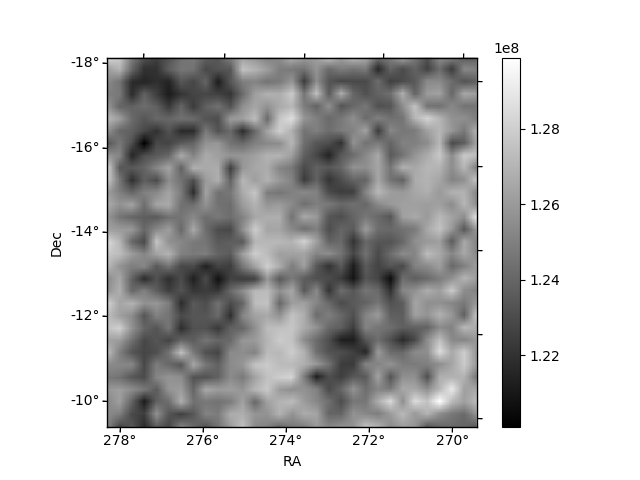
Histogram calculated using DETX and DETY for each event in the final _common_clean file
| Quadrant A | 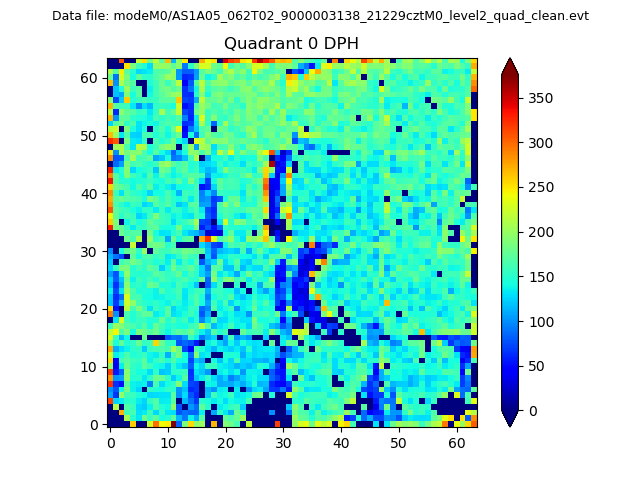 |
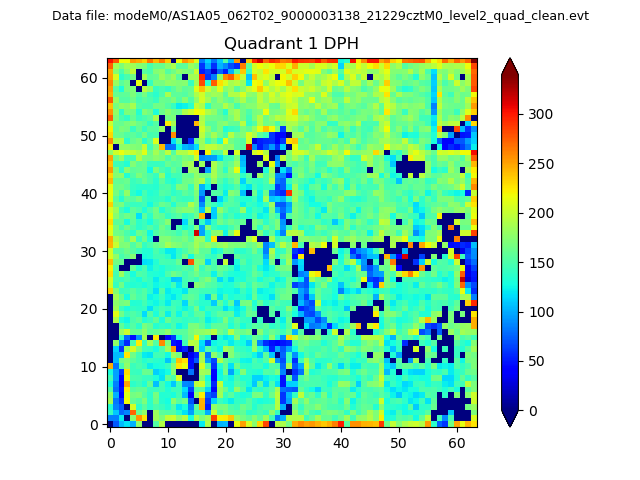 |
Quadrant B |
|---|---|---|---|
| Quadrant D | 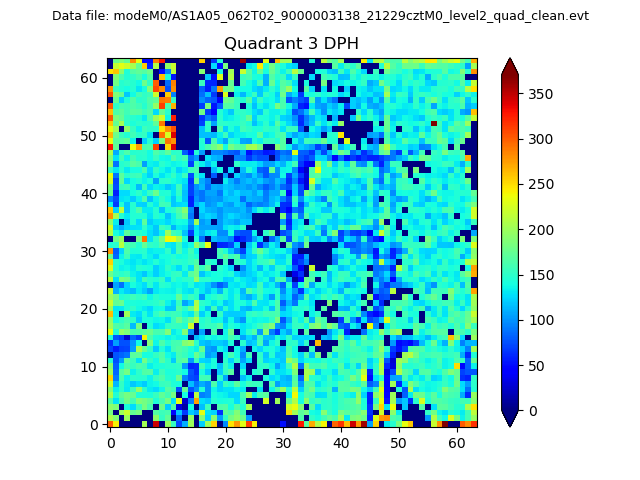 |
 |
Quadrant C |
| Plot type | Count rate plots | Images |
|---|---|---|
| Comparison with Poisson distribution Blue bars denote a histogram of data divided into 1 sec bins. Red curve is a Poisson curve with rate = median count rate of data. |
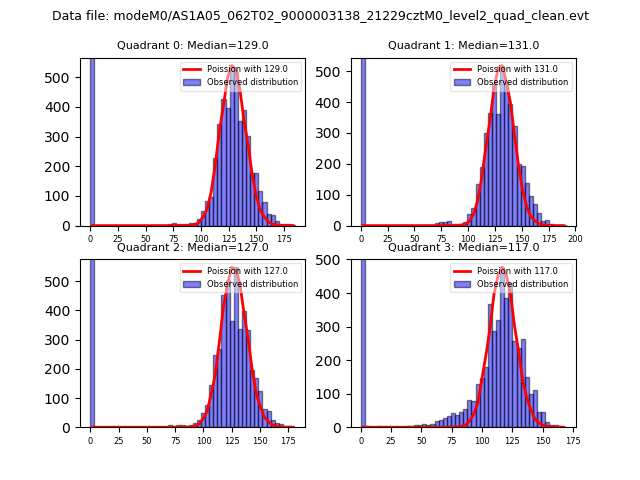 |
 |
| Quadrant-wise count rates Data is divided into 100 sec bins |
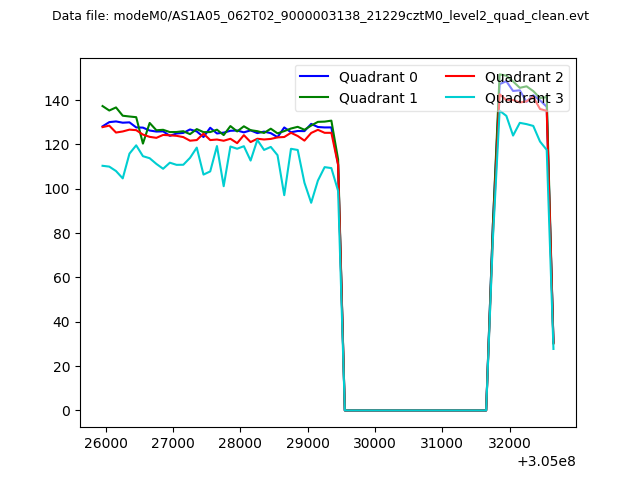 |
|
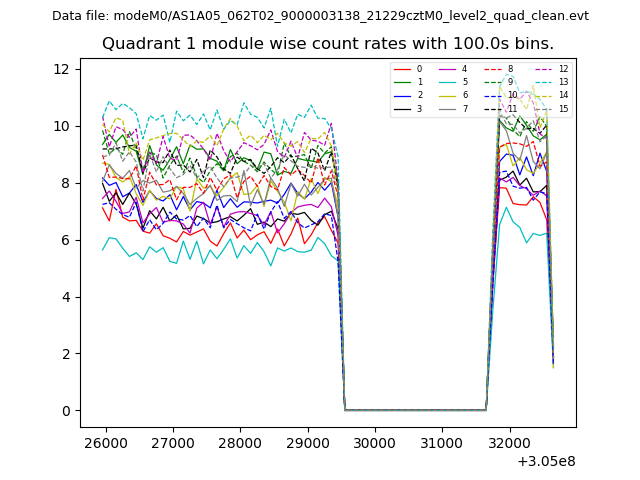
| Module-wise count rates for Quadrant A Data is divided into 100 sec bins |
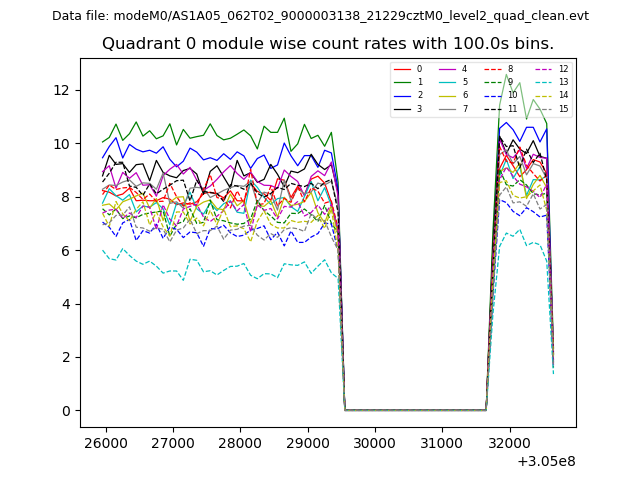 |
 |
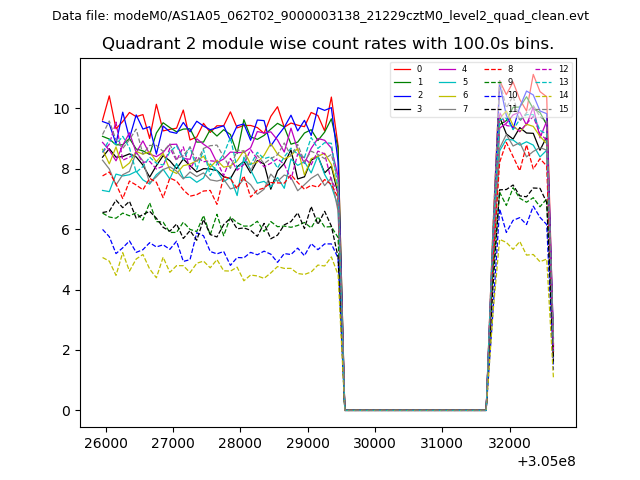
| Module-wise count rates for Quadrant B Data is divided into 100 sec bins |
 |
 |
| Module-wise count rates for Quadrant C Data is divided into 100 sec bins |
 |
 |
| Module-wise count rates for Quadrant D Data is divided into 100 sec bins |
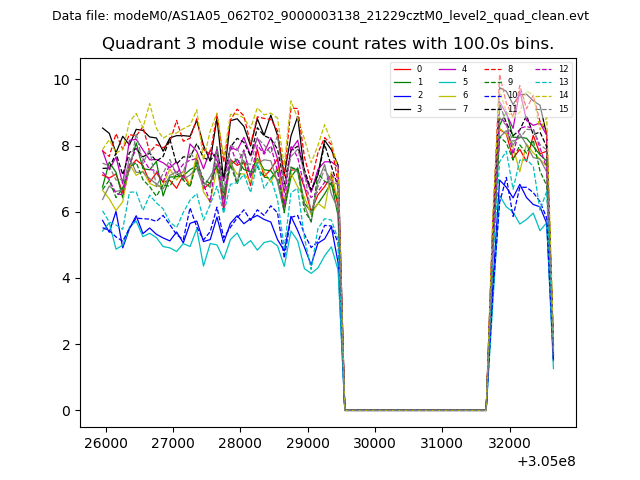 |
 |
| Parameter | Plot |
|---|---|
| CZT HV Monitor | 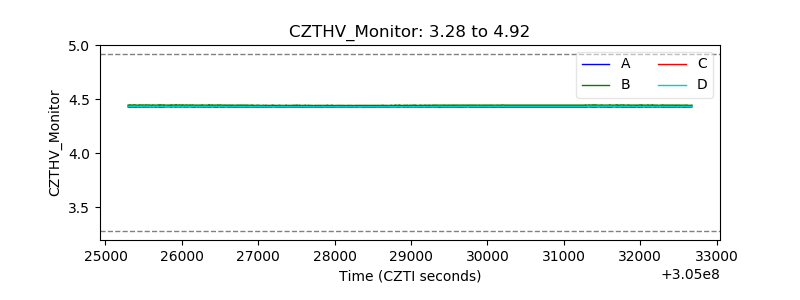 |
| D_VDD |  |
| Temperature 1 | 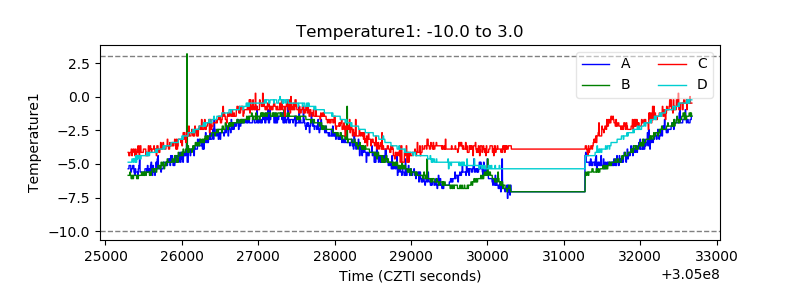 |
| Veto HV Monitor | 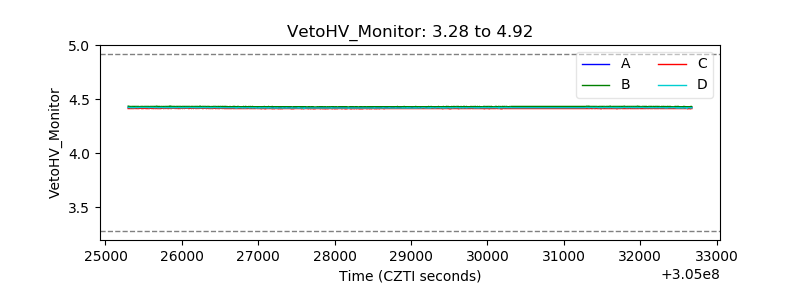 |
| Veto LLD |  |
| Alpha Counter | 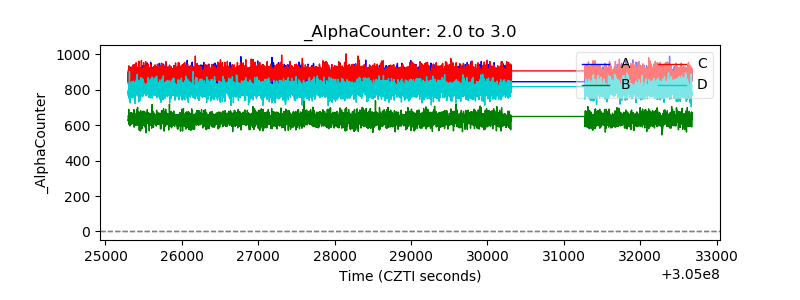 |
| _CPM_Rate | 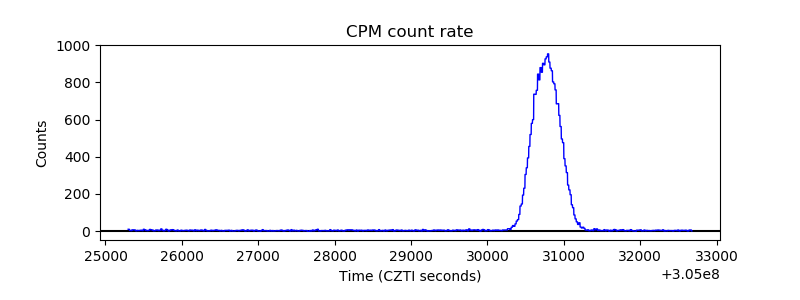 |
| CZT Counter | 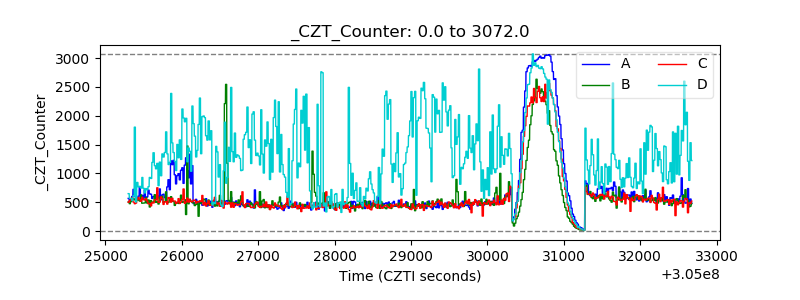 |
| +2.5 Volts monitor |  |
| +5 Volts monitor |  |
| _ROLL_ROT |  |
| _Roll_DEC | 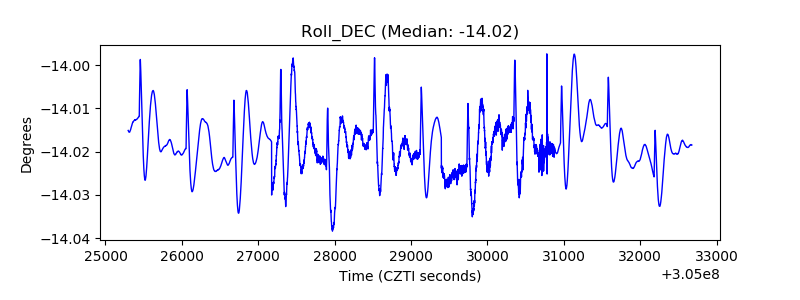 |
| _Roll_RA | 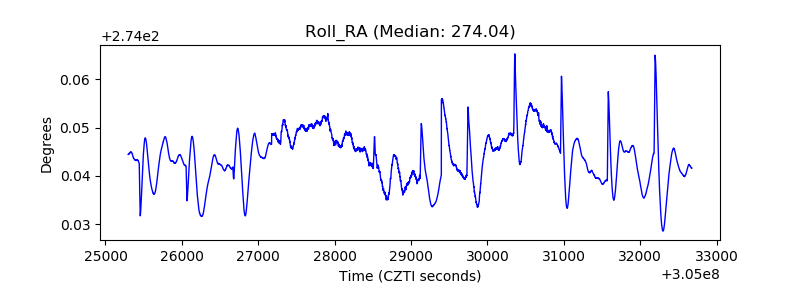 |
| Veto Counter |  |