| Param | Original file | Final file |
|---|---|---|
| Filename | modeM0/AS1A05_062T02_9000003138_21233cztM0_level2.evt | modeM0/AS1A05_062T02_9000003138_21233cztM0_level2_quad_clean.evt |
| Size (bytes) | 604,229,760 | 101,154,240 |
| Size | 576.2 MB | 96.5 MB |
| Events in quadrant A | 3,300,497 | 705,059 |
| Events in quadrant B | 3,319,547 | 708,767 |
| Events in quadrant C | 3,169,737 | 669,013 |
| Events in quadrant D | 8,095,382 | 553,187 |
| Mode M9 | |||
|---|---|---|---|
| Quadrant | BADHDUFLAG | Total packets | Discarded packets |
| A | 0 | 13 | 0 |
| B | 0 | 13 | 0 |
| C | 0 | 13 | 0 |
| D | 0 | 13 | 0 |
| Mode M0 | |||
|---|---|---|---|
| Quadrant | BADHDUFLAG | Total packets | Discarded packets |
| A | 0 | 13663 | 1 |
| B | 0 | 13801 | 1 |
| C | 0 | 13238 | 1 |
| D | 0 | 28423 | 3 |
| Mode SS | |||
|---|---|---|---|
| Quadrant | BADHDUFLAG | Total packets | Discarded packets |
| A | 0 | 124 | 0 |
| B | 0 | 124 | 0 |
| C | 0 | 124 | 0 |
| D | 0 | 124 | 0 |
| Quadrant | Total seconds | Saturated seconds | Saturation percentage |
|---|---|---|---|
| A | 6116 | 83 | 1.357096% |
| B | 6117 | 92 | 1.504005% |
| C | 6117 | 112 | 1.830963% |
| D | 6116 | 1621 | 26.504251% |
Noise dominated data is calculated using 1-second bins in cleaned event files. If a bin has >2000 counts, and if more than 50% of those come from <1% of pixels, then it is considered to be noise-dominated and hence unusable.
| Quadrant | # 1 sec bins | Bins with >0 counts | Bins with >2000 counts | High rate bins dominated by noise | Noise dominated (total time) | Noise dominated (detector-on time) | Marked lightcurve |
|---|---|---|---|---|---|---|---|
| A | 7406 | 6116 | 2 | 2 | 0.03% | 0.03% | 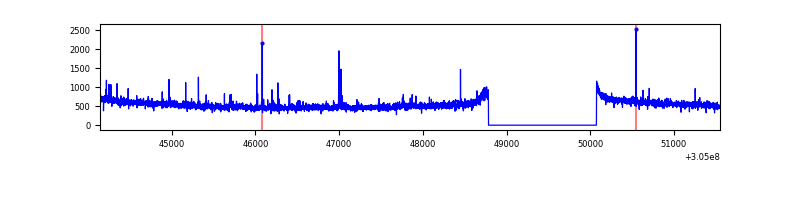 |
| B | 7407 | 6117 | 5 | 5 | 0.07% | 0.08% | 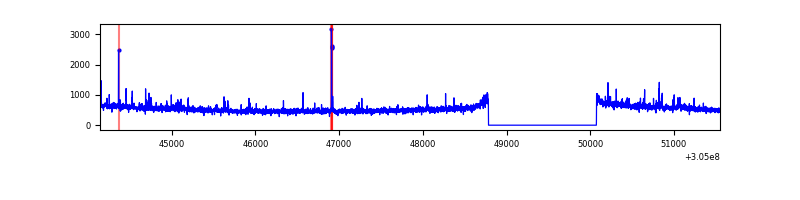 |
| C | 7407 | 6118 | 0 | 0 | 0.00% | 0.00% | 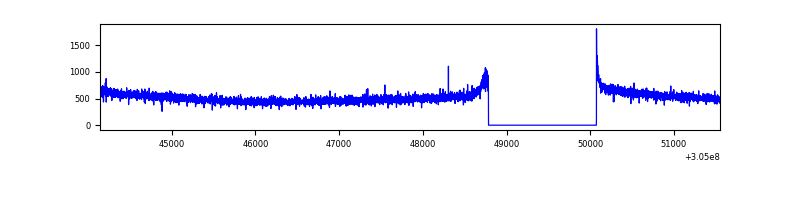 |
| D | 7406 | 6116 | 1313 | 1313 | 17.73% | 21.47% | 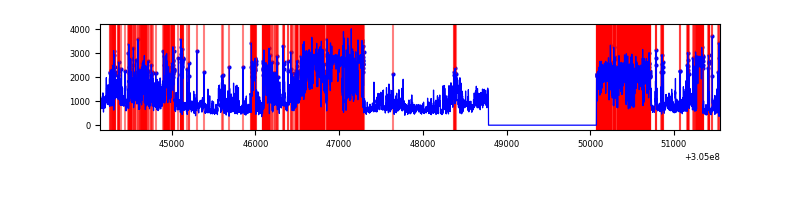 |
Top three noisy pixels from each quadrant. If the there are fewer than three noisy pixels in the level2.evt file, extra rows are filled as -1
| Pixel properties | Quadrant properties | ||||||
|---|---|---|---|---|---|---|---|
| Quadrant | DetID | PixID | Counts | Sigma | Mean | Median | Sigma |
| A | 5 | 16 | 47678 | 282.06 | 833 | 821 | 166.1 |
| A | 8 | 6 | 17624 | 101.15 | 833 | 821 | 166.1 |
| A | 12 | 96 | 12972 | 73.14 | 833 | 821 | 166.1 |
| B | 0 | 190 | 30213 | 190.18 | 819 | 803 | 154.6 |
| B | 0 | 197 | 23364 | 145.89 | 819 | 803 | 154.6 |
| B | 0 | 230 | 19419 | 120.38 | 819 | 803 | 154.6 |
| C | 14 | 238 | 123350 | 680.92 | 777 | 784 | 180.0 |
| C | 0 | 10 | 6953 | 34.27 | 777 | 784 | 180.0 |
| C | 13 | 61 | 5482 | 26.1 | 777 | 784 | 180.0 |
| D | 13 | 174 | 1865039 | 10717.93 | 713 | 693 | 173.9 |
| D | 1 | 239 | 1158098 | 6653.8 | 713 | 693 | 173.9 |
| D | 15 | 0 | 820792 | 4714.66 | 713 | 693 | 173.9 |
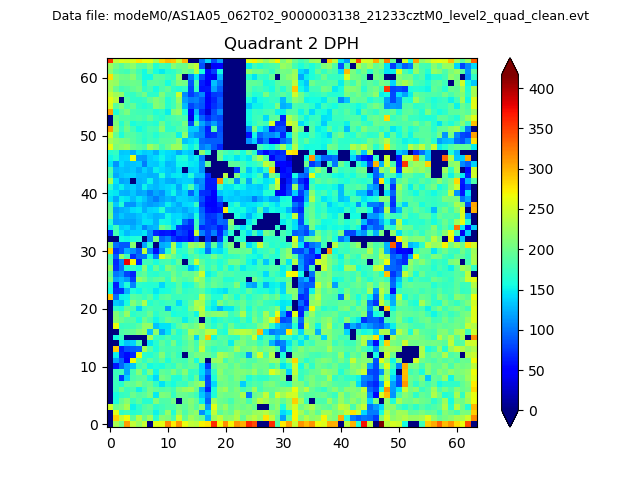
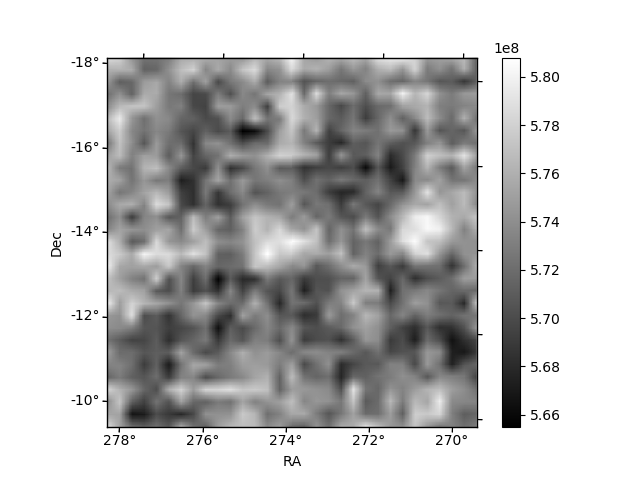
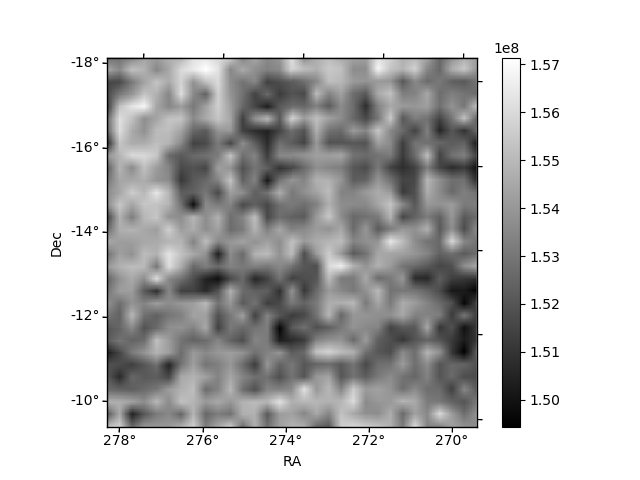
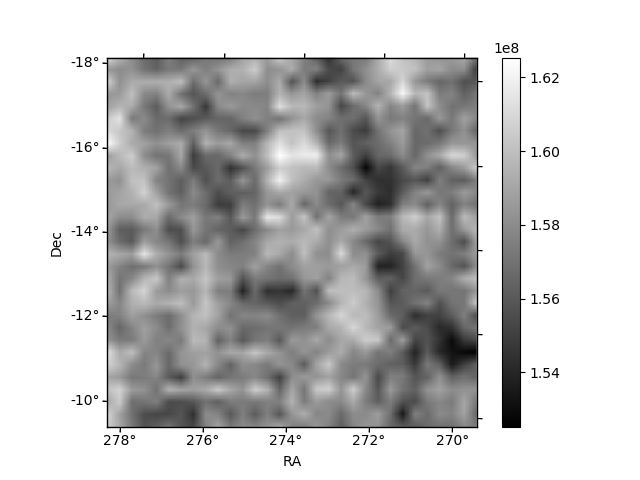
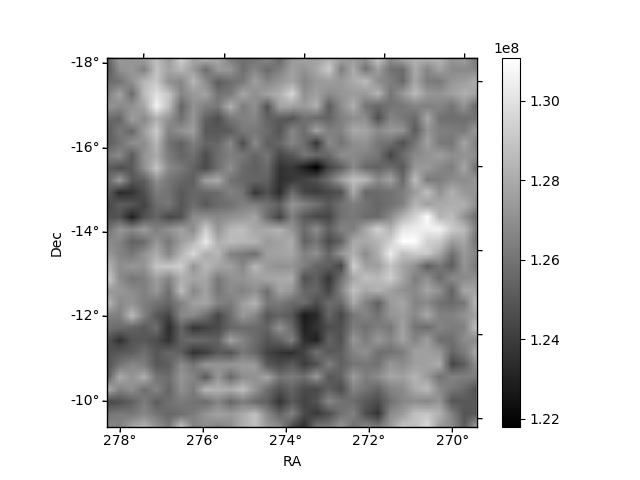
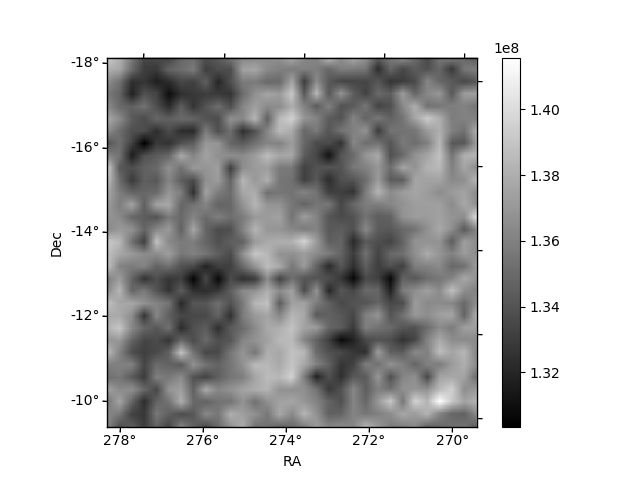
Histogram calculated using DETX and DETY for each event in the final _common_clean file
| Quadrant A | 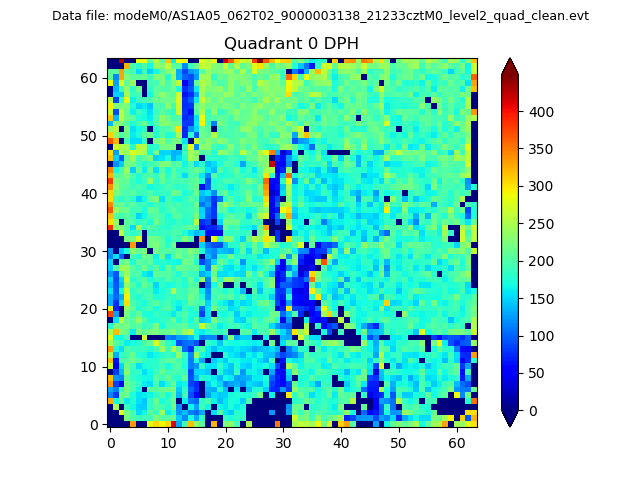 |
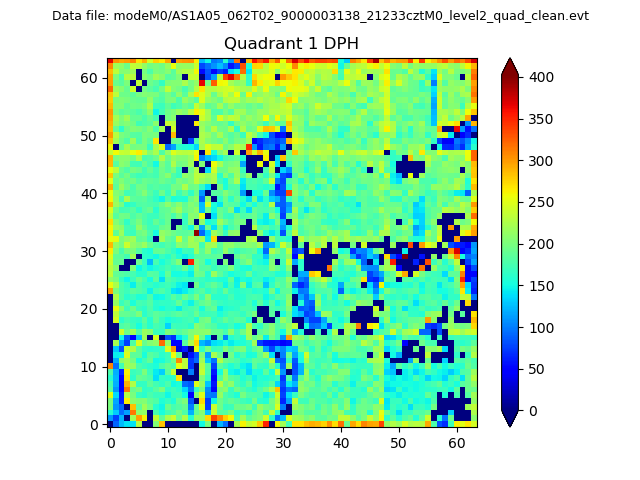 |
Quadrant B |
|---|---|---|---|
| Quadrant D | 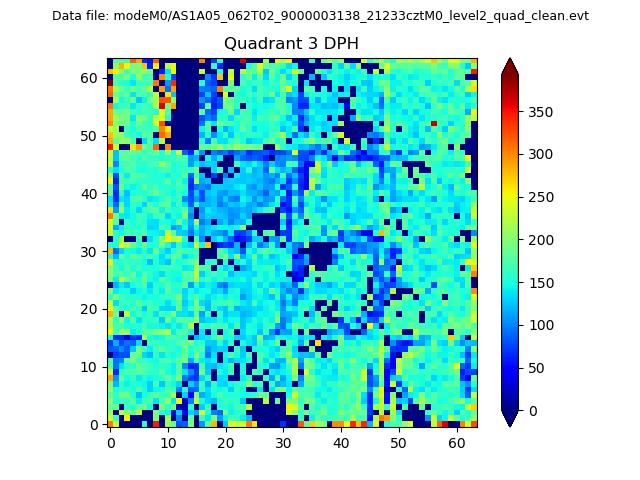 |
 |
Quadrant C |
| Plot type | Count rate plots | Images |
|---|---|---|
| Comparison with Poisson distribution Blue bars denote a histogram of data divided into 1 sec bins. Red curve is a Poisson curve with rate = median count rate of data. |
 |
 |
| Quadrant-wise count rates Data is divided into 100 sec bins |
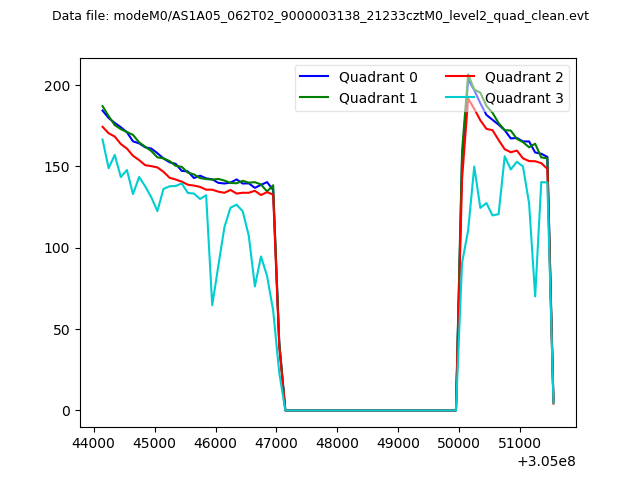 |
|
| Module-wise count rates for Quadrant A Data is divided into 100 sec bins |
 |
 |
| Module-wise count rates for Quadrant B Data is divided into 100 sec bins |
 |
 |
| Module-wise count rates for Quadrant C Data is divided into 100 sec bins |
 |
 |
| Module-wise count rates for Quadrant D Data is divided into 100 sec bins |
 |
 |
| Parameter | Plot |
|---|---|
| CZT HV Monitor |  |
| D_VDD | 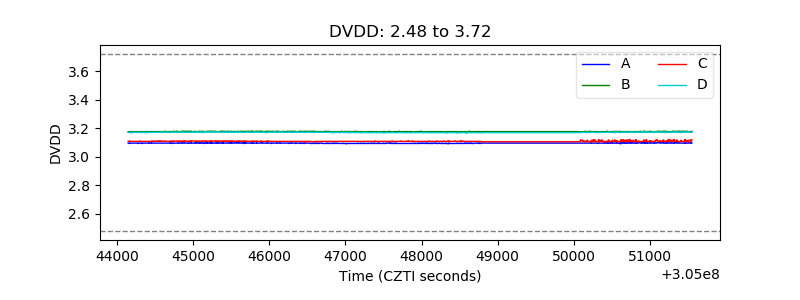 |
| Temperature 1 | 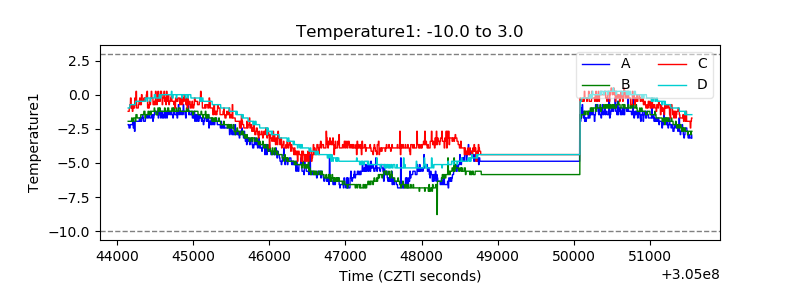 |
| Veto HV Monitor | 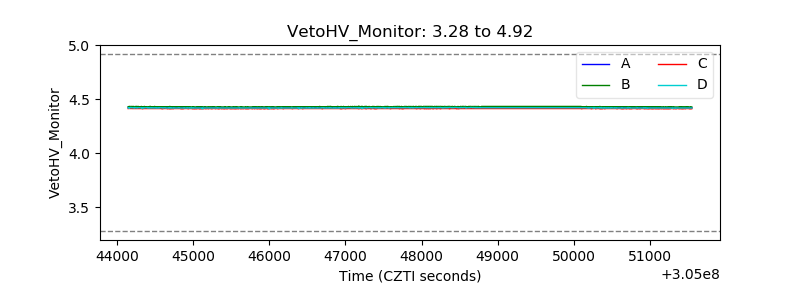 |
| Veto LLD |  |
| Alpha Counter | 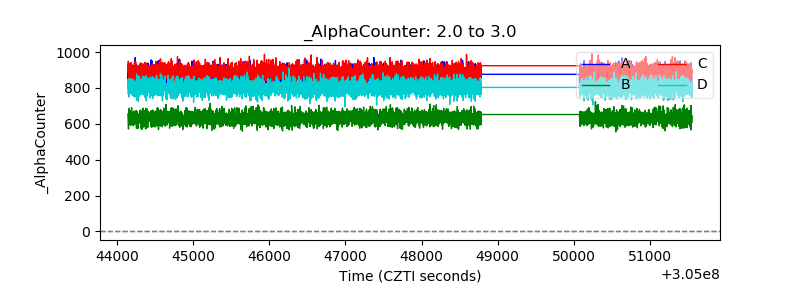 |
| _CPM_Rate | 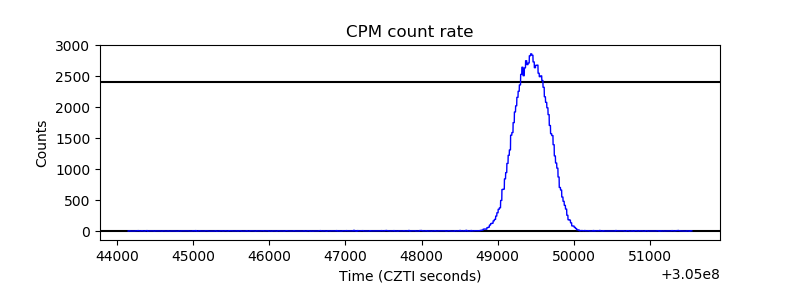 |
| CZT Counter | 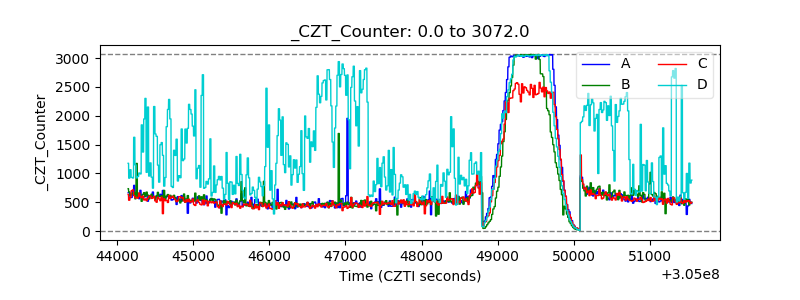 |
| +2.5 Volts monitor |  |
| +5 Volts monitor | 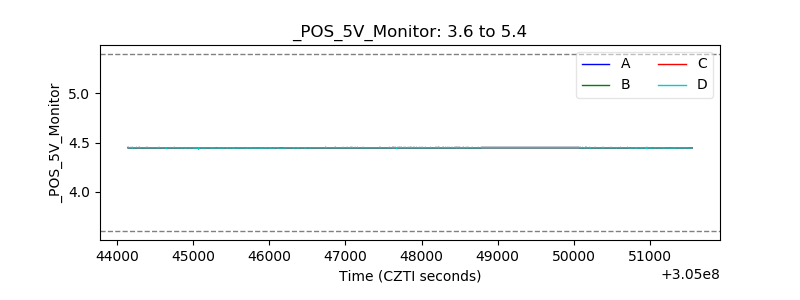 |
| _ROLL_ROT |  |
| _Roll_DEC | 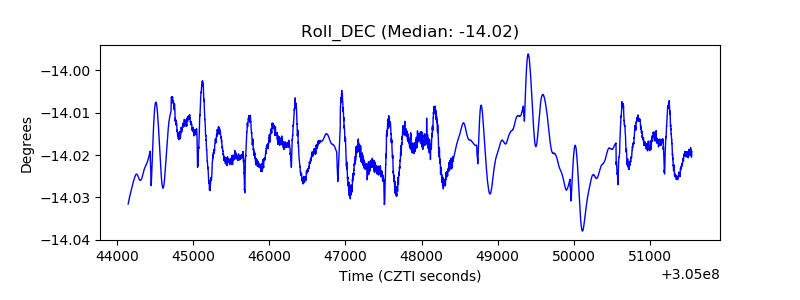 |
| _Roll_RA | 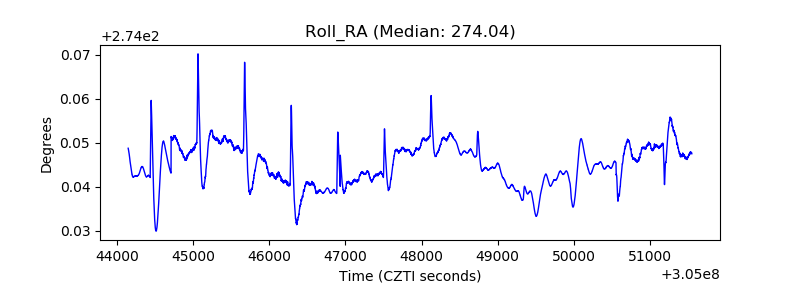 |
| Veto Counter |  |