| Param | Original file | Final file |
|---|---|---|
| Filename | modeM0/AS1A05_062T02_9000003138_21235cztM0_level2.evt | modeM0/AS1A05_062T02_9000003138_21235cztM0_level2_quad_clean.evt |
| Size (bytes) | 546,713,280 | 90,550,080 |
| Size | 521.4 MB | 86.4 MB |
| Events in quadrant A | 3,105,155 | 609,769 |
| Events in quadrant B | 3,210,729 | 613,905 |
| Events in quadrant C | 3,053,449 | 582,275 |
| Events in quadrant D | 6,784,618 | 520,075 |
| Mode M9 | |||
|---|---|---|---|
| Quadrant | BADHDUFLAG | Total packets | Discarded packets |
| A | 0 | 13 | 0 |
| B | 0 | 13 | 0 |
| C | 0 | 13 | 0 |
| D | 0 | 13 | 0 |
| Mode M0 | |||
|---|---|---|---|
| Quadrant | BADHDUFLAG | Total packets | Discarded packets |
| A | 0 | 12826 | 1 |
| B | 0 | 13223 | 1 |
| C | 0 | 12666 | 1 |
| D | 0 | 24355 | 1 |
| Mode SS | |||
|---|---|---|---|
| Quadrant | BADHDUFLAG | Total packets | Discarded packets |
| A | 0 | 122 | 0 |
| B | 0 | 122 | 0 |
| C | 0 | 122 | 0 |
| D | 0 | 122 | 0 |
| Quadrant | Total seconds | Saturated seconds | Saturation percentage |
|---|---|---|---|
| A | 5950 | 98 | 1.647059% |
| B | 5950 | 112 | 1.882353% |
| C | 5951 | 126 | 2.117291% |
| D | 5951 | 862 | 14.484961% |
Noise dominated data is calculated using 1-second bins in cleaned event files. If a bin has >2000 counts, and if more than 50% of those come from <1% of pixels, then it is considered to be noise-dominated and hence unusable.
| Quadrant | # 1 sec bins | Bins with >0 counts | Bins with >2000 counts | High rate bins dominated by noise | Noise dominated (total time) | Noise dominated (detector-on time) | Marked lightcurve |
|---|---|---|---|---|---|---|---|
| A | 7285 | 5950 | 0 | 0 | 0.00% | 0.00% | 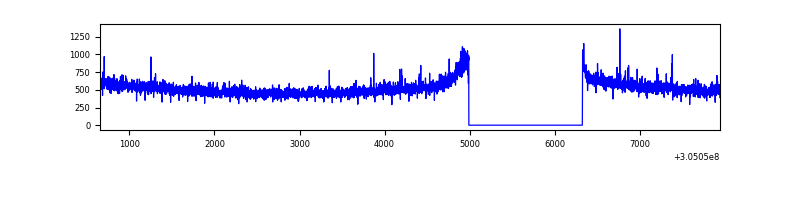 |
| B | 7285 | 5950 | 3 | 3 | 0.04% | 0.05% | 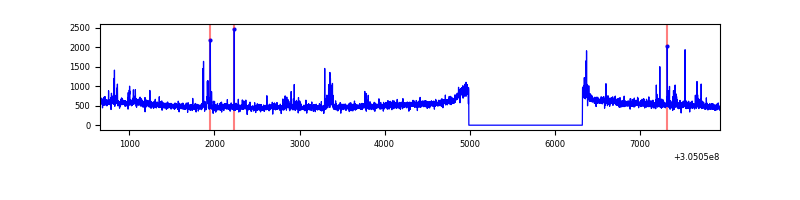 |
| C | 7286 | 5952 | 0 | 0 | 0.00% | 0.00% | 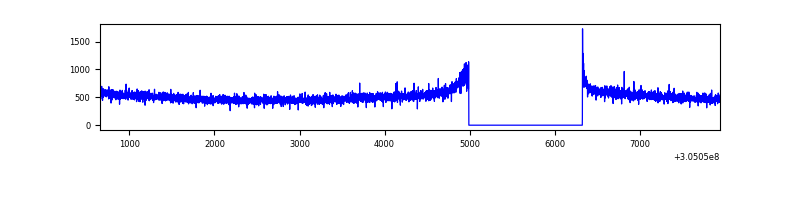 |
| D | 7286 | 5951 | 835 | 835 | 11.46% | 14.03% | 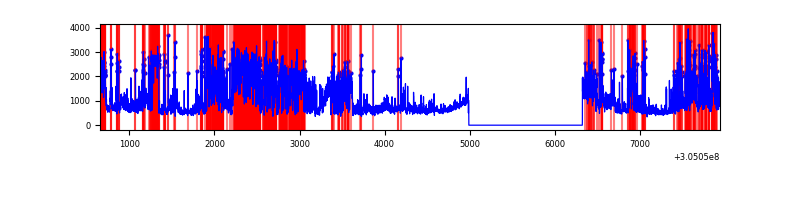 |
Top three noisy pixels from each quadrant. If the there are fewer than three noisy pixels in the level2.evt file, extra rows are filled as -1
| Pixel properties | Quadrant properties | ||||||
|---|---|---|---|---|---|---|---|
| Quadrant | DetID | PixID | Counts | Sigma | Mean | Median | Sigma |
| A | 5 | 16 | 15581 | 91.97 | 791 | 778 | 161.0 |
| A | 12 | 96 | 15214 | 89.69 | 791 | 778 | 161.0 |
| A | 11 | 47 | 10299 | 59.15 | 791 | 778 | 161.0 |
| B | 0 | 190 | 50286 | 333.61 | 786 | 771 | 148.4 |
| B | 0 | 230 | 27547 | 180.41 | 786 | 771 | 148.4 |
| B | 0 | 228 | 21418 | 139.11 | 786 | 771 | 148.4 |
| C | 14 | 238 | 117666 | 669.79 | 747 | 756 | 174.5 |
| C | 8 | 128 | 8365 | 43.59 | 747 | 756 | 174.5 |
| C | 0 | 10 | 6935 | 35.4 | 747 | 756 | 174.5 |
| D | 13 | 174 | 1877043 | 10683.59 | 727 | 707 | 175.6 |
| D | 13 | 153 | 772979 | 4397.21 | 727 | 707 | 175.6 |
| D | 7 | 238 | 450806 | 2562.8 | 727 | 707 | 175.6 |
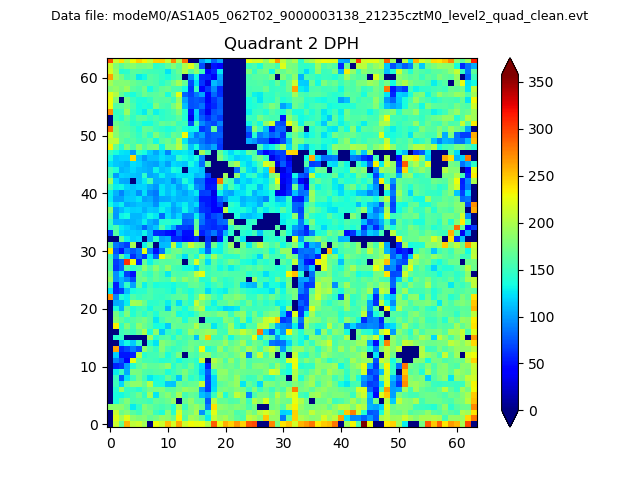
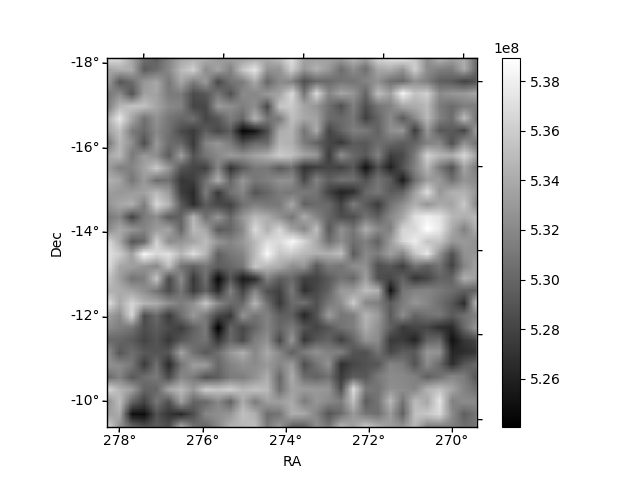
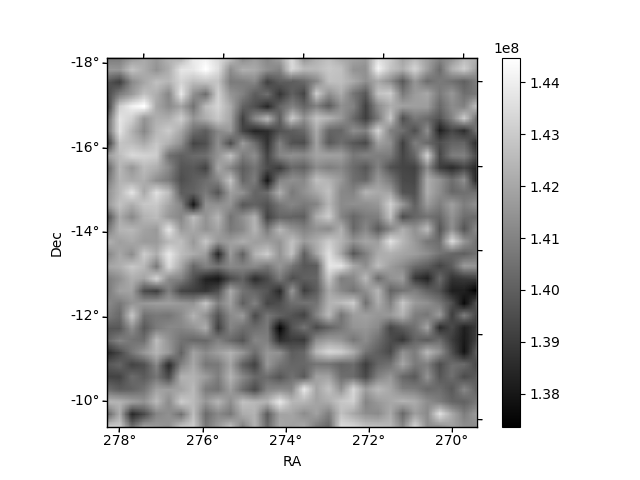
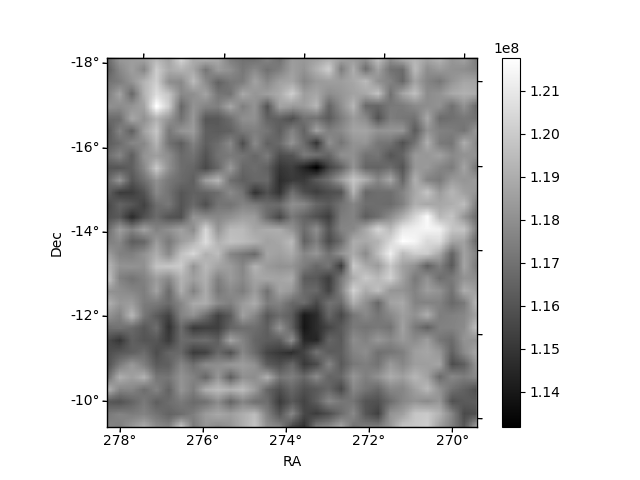
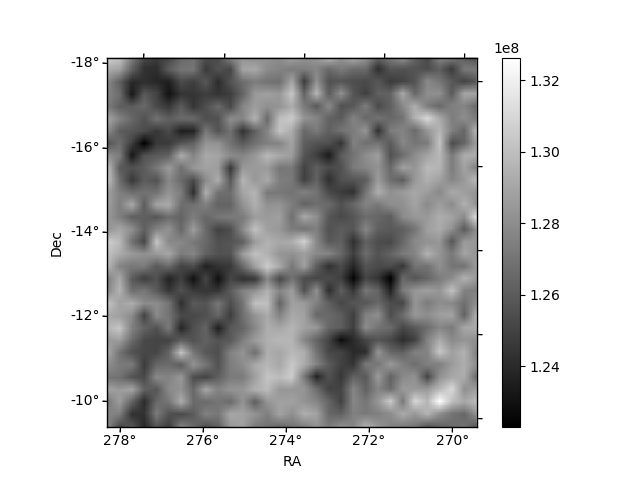
Histogram calculated using DETX and DETY for each event in the final _common_clean file
| Quadrant A | 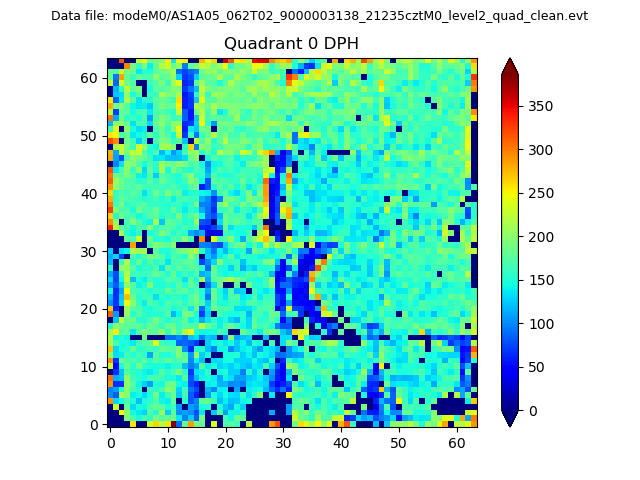 |
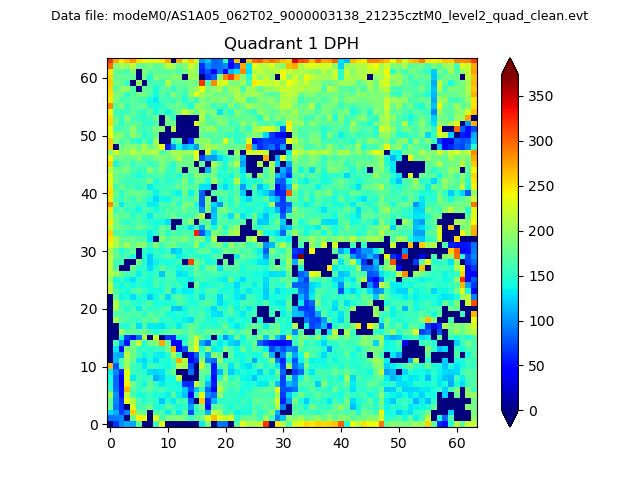 |
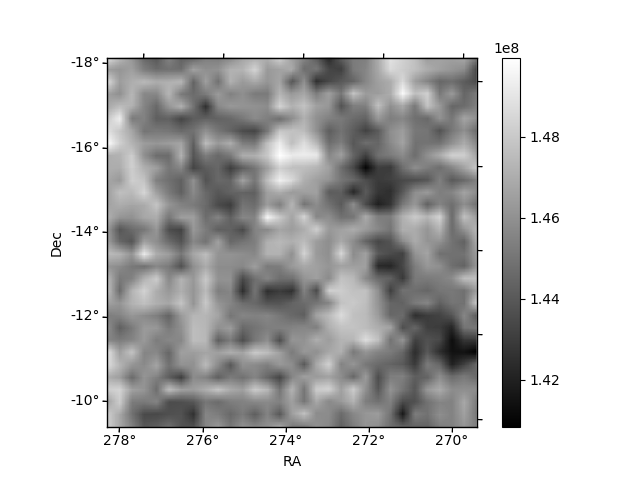
Quadrant B |
|---|---|---|---|
| Quadrant D | 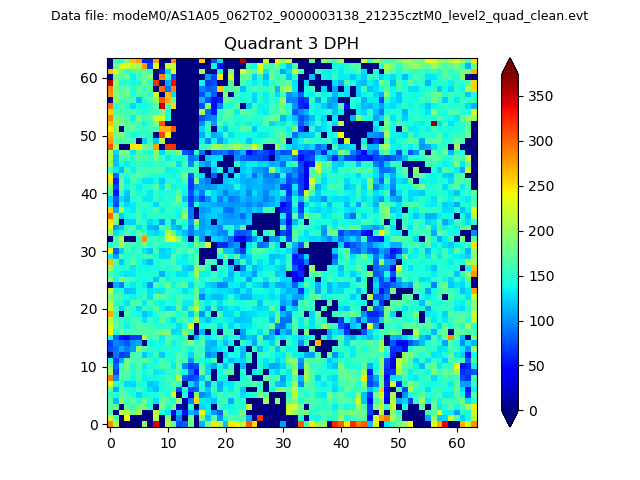 |
 |
Quadrant C |
| Plot type | Count rate plots | Images |
|---|---|---|
| Comparison with Poisson distribution Blue bars denote a histogram of data divided into 1 sec bins. Red curve is a Poisson curve with rate = median count rate of data. |
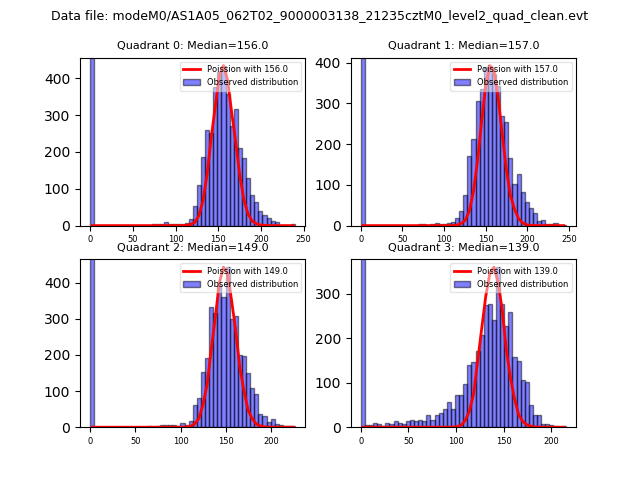 |
 |
| Quadrant-wise count rates Data is divided into 100 sec bins |
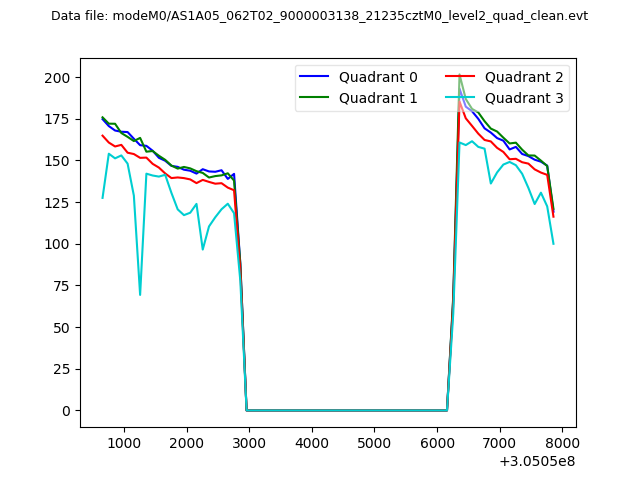 |
|
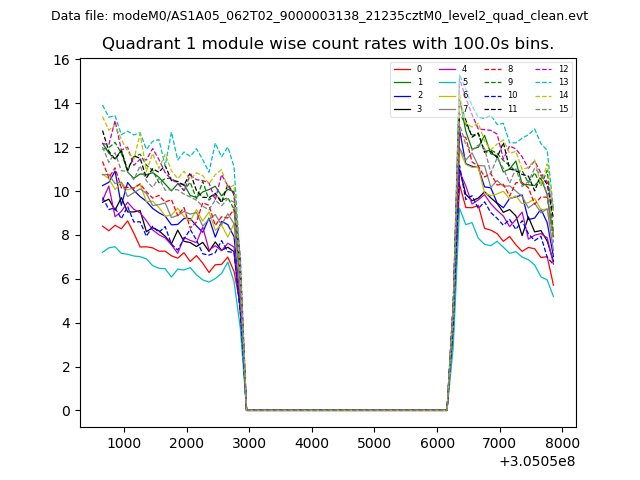
| Module-wise count rates for Quadrant A Data is divided into 100 sec bins |
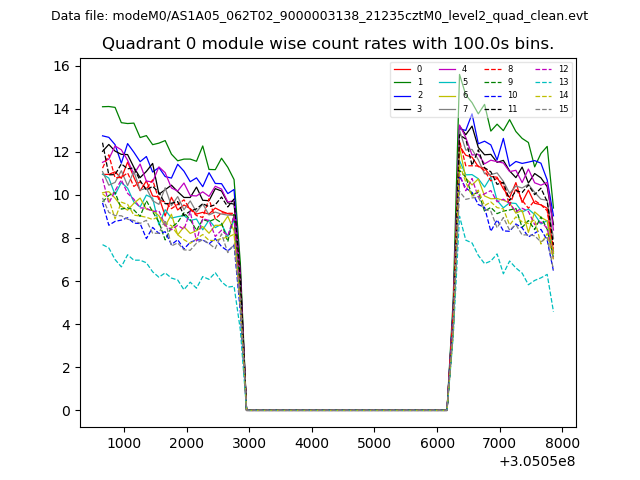 |
 |
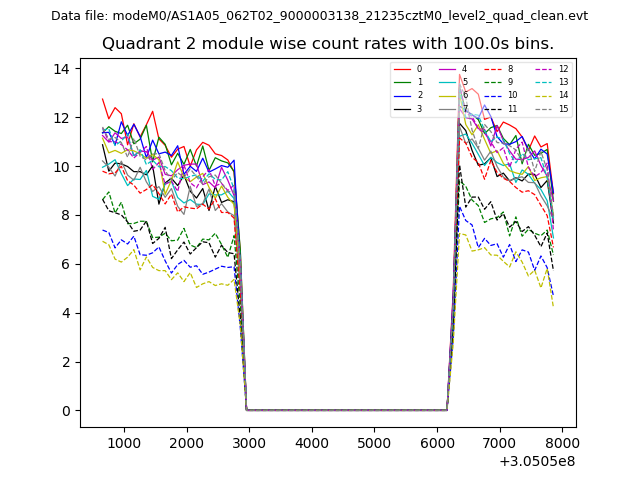
| Module-wise count rates for Quadrant B Data is divided into 100 sec bins |
 |
 |
| Module-wise count rates for Quadrant C Data is divided into 100 sec bins |
 |
 |
| Module-wise count rates for Quadrant D Data is divided into 100 sec bins |
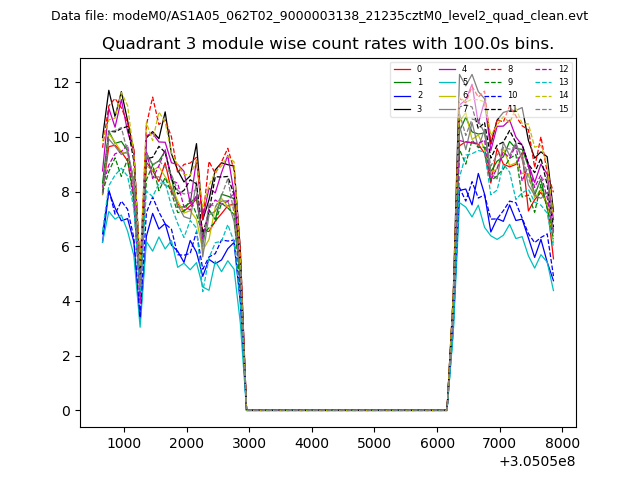 |
 |
| Parameter | Plot |
|---|---|
| CZT HV Monitor | 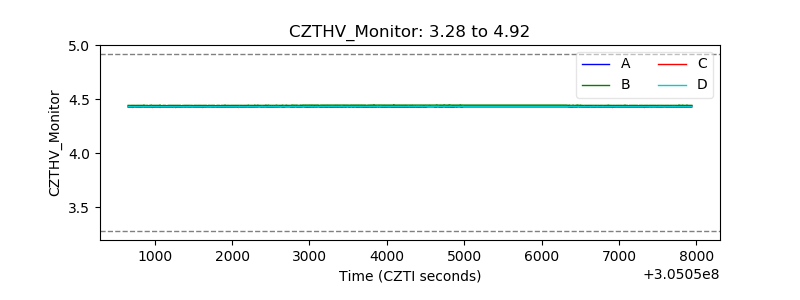 |
| D_VDD | 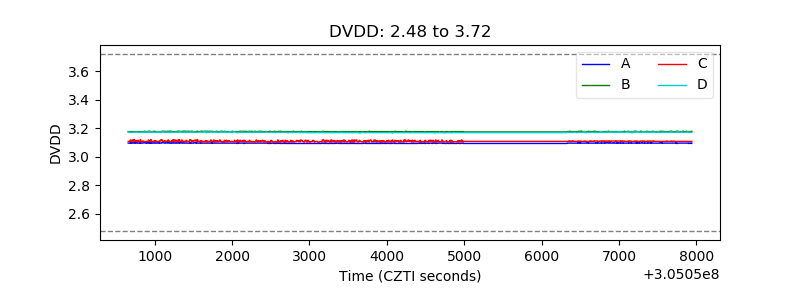 |
| Temperature 1 | 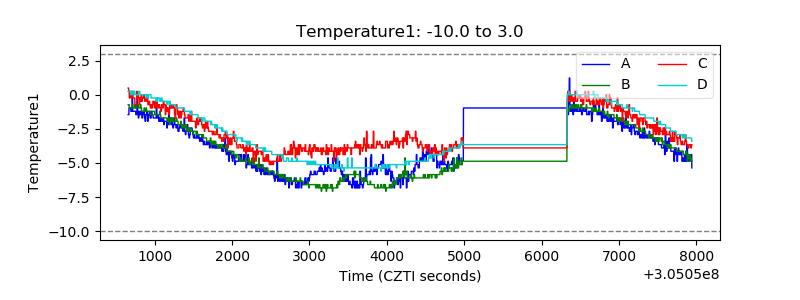 |
| Veto HV Monitor | 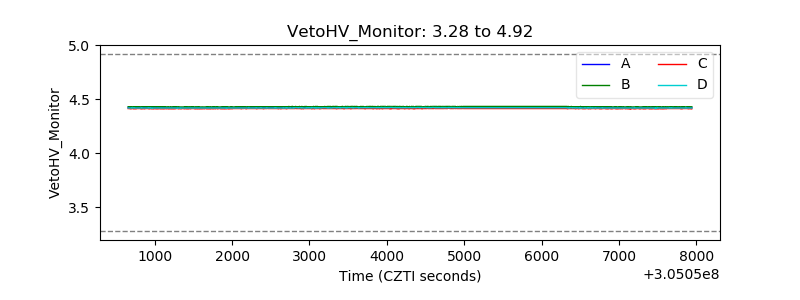 |
| Veto LLD | 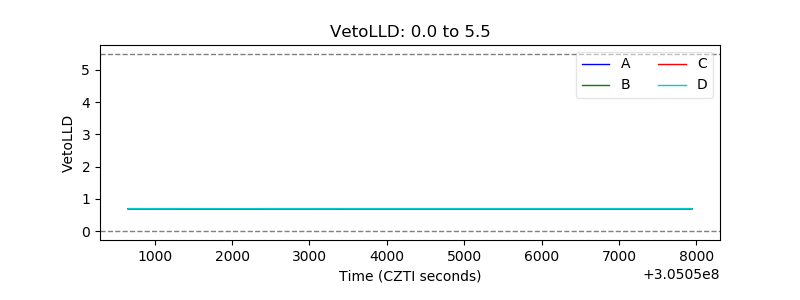 |
| Alpha Counter | 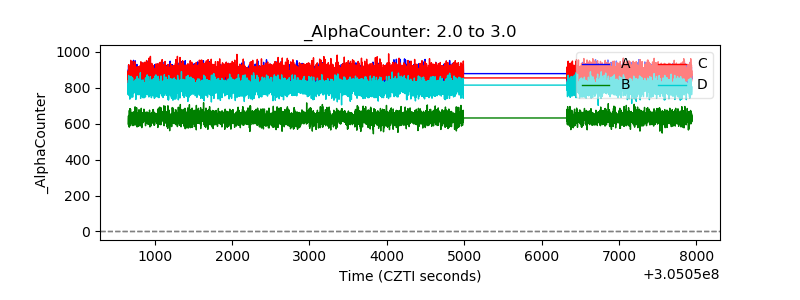 |
| _CPM_Rate | 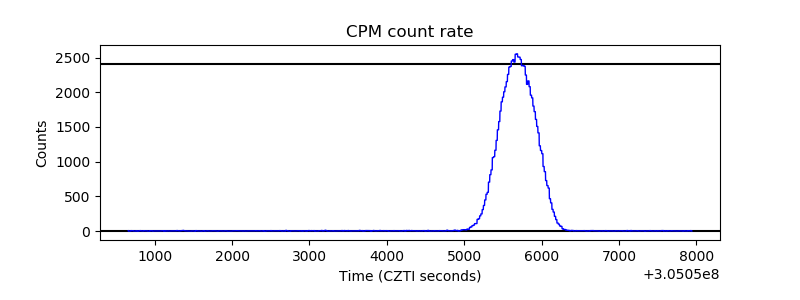 |
| CZT Counter | 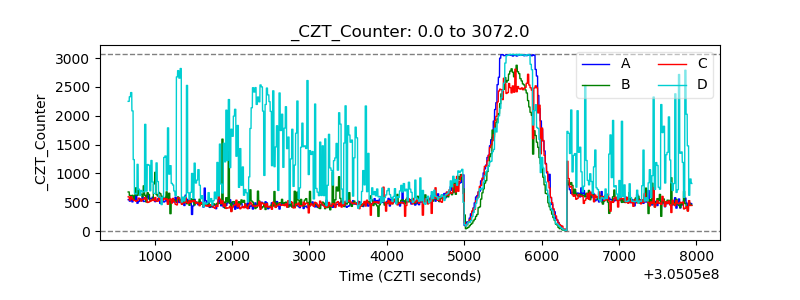 |
| +2.5 Volts monitor | 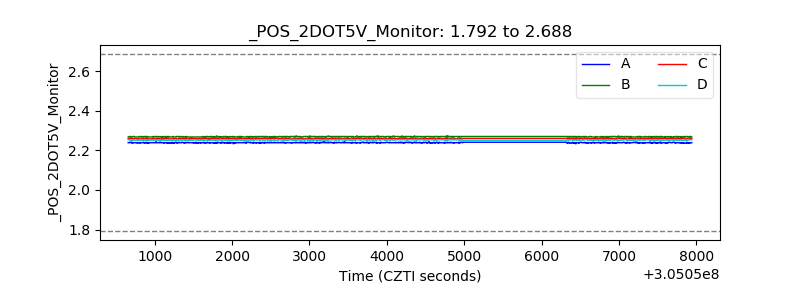 |
| +5 Volts monitor | 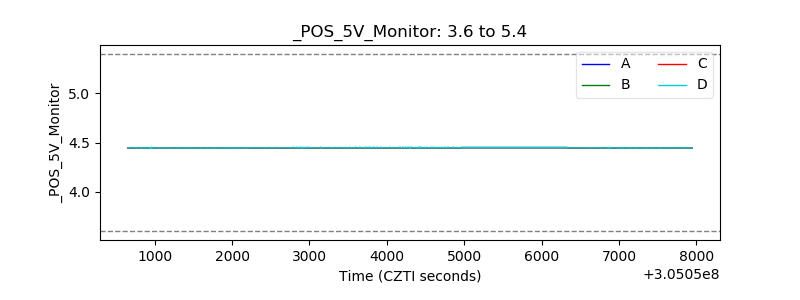 |
| _ROLL_ROT | 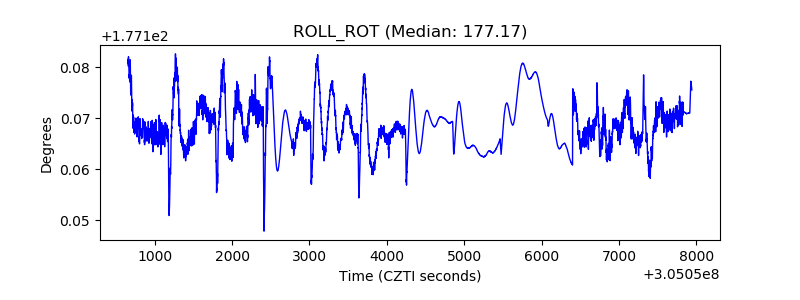 |
| _Roll_DEC | 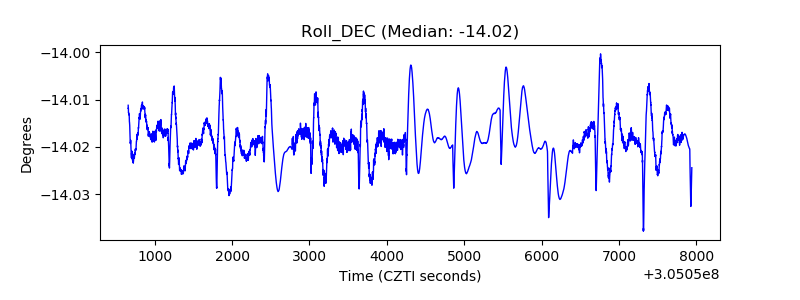 |
| _Roll_RA | 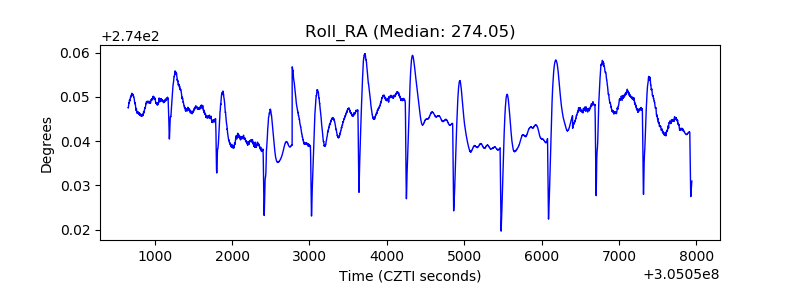 |
| Veto Counter | 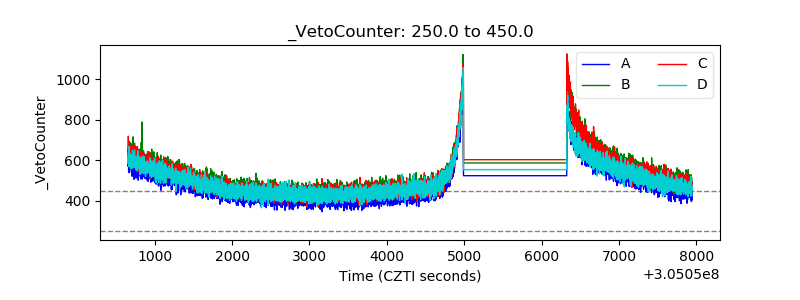 |