| Param | Original file | Final file |
|---|---|---|
| Filename | modeM0/AS1T03_140T01_9000003142_21286cztM0_level2.evt | modeM0/AS1T03_140T01_9000003142_21286cztM0_level2_quad_clean.evt |
| Size (bytes) | 1,282,037,760 | 221,201,280 |
| Size | 1.2 GB | 211.0 MB |
| Events in quadrant A | 8,916,562 | 1,370,321 |
| Events in quadrant B | 9,292,697 | 1,387,828 |
| Events in quadrant C | 8,783,009 | 1,353,206 |
| Events in quadrant D | 10,580,742 | 1,310,364 |
| Mode M0 | |||
|---|---|---|---|
| Quadrant | BADHDUFLAG | Total packets | Discarded packets |
| A | 0 | 38394 | 4 |
| B | 0 | 39226 | 4 |
| C | 0 | 37872 | 5 |
| D | 0 | 43850 | 4 |
| Mode M9 | |||
|---|---|---|---|
| Quadrant | BADHDUFLAG | Total packets | Discarded packets |
| A | 0 | 22 | 0 |
| B | 0 | 22 | 0 |
| C | 0 | 22 | 0 |
| D | 0 | 22 | 0 |
| Mode SS | |||
|---|---|---|---|
| Quadrant | BADHDUFLAG | Total packets | Discarded packets |
| A | 0 | 380 | 0 |
| B | 0 | 380 | 0 |
| C | 0 | 380 | 0 |
| D | 0 | 380 | 0 |
| Quadrant | Total seconds | Saturated seconds | Saturation percentage |
|---|---|---|---|
| A | 18537 | 186 | 1.003399% |
| B | 18538 | 301 | 1.623692% |
| C | 18537 | 249 | 1.343259% |
| D | 18537 | 447 | 2.411393% |
Noise dominated data is calculated using 1-second bins in cleaned event files. If a bin has >2000 counts, and if more than 50% of those come from <1% of pixels, then it is considered to be noise-dominated and hence unusable.
| Quadrant | # 1 sec bins | Bins with >0 counts | Bins with >2000 counts | High rate bins dominated by noise | Noise dominated (total time) | Noise dominated (detector-on time) | Marked lightcurve |
|---|---|---|---|---|---|---|---|
| A | 20737 | 18539 | 4 | 4 | 0.02% | 0.02% | 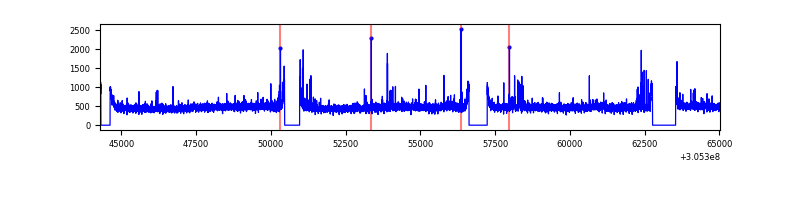 |
| B | 20738 | 18540 | 63 | 63 | 0.30% | 0.34% | 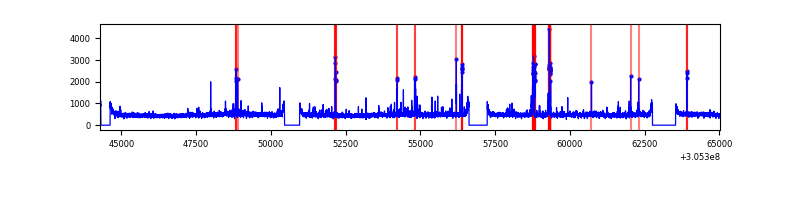 |
| C | 20737 | 18539 | 0 | 0 | 0.00% | 0.00% | 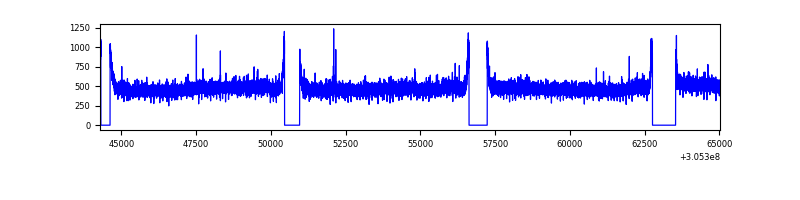 |
| D | 20737 | 18538 | 281 | 281 | 1.36% | 1.52% | 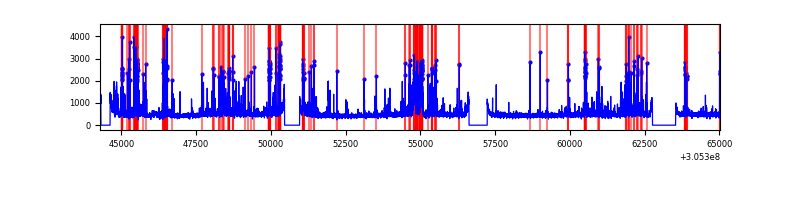 |
Top three noisy pixels from each quadrant. If the there are fewer than three noisy pixels in the level2.evt file, extra rows are filled as -1
| Pixel properties | Quadrant properties | ||||||
|---|---|---|---|---|---|---|---|
| Quadrant | DetID | PixID | Counts | Sigma | Mean | Median | Sigma |
| A | 15 | 174 | 95986 | 208.04 | 2243 | 2195 | 450.8 |
| A | 5 | 16 | 92781 | 200.93 | 2243 | 2195 | 450.8 |
| A | 9 | 143 | 51564 | 109.51 | 2243 | 2195 | 450.8 |
| B | 3 | 64 | 300278 | 702.49 | 2237 | 2182 | 424.3 |
| B | 0 | 230 | 72817 | 166.46 | 2237 | 2182 | 424.3 |
| B | 12 | 111 | 52283 | 118.07 | 2237 | 2182 | 424.3 |
| C | 14 | 238 | 336072 | 665.26 | 2147 | 2159 | 501.9 |
| C | 3 | 233 | 57605 | 110.47 | 2147 | 2159 | 501.9 |
| C | 13 | 61 | 15147 | 25.88 | 2147 | 2159 | 501.9 |
| D | 1 | 52 | 845793 | 1593.99 | 2166 | 2107 | 529.3 |
| D | 7 | 38 | 746603 | 1406.59 | 2166 | 2107 | 529.3 |
| D | 13 | 174 | 200734 | 375.27 | 2166 | 2107 | 529.3 |
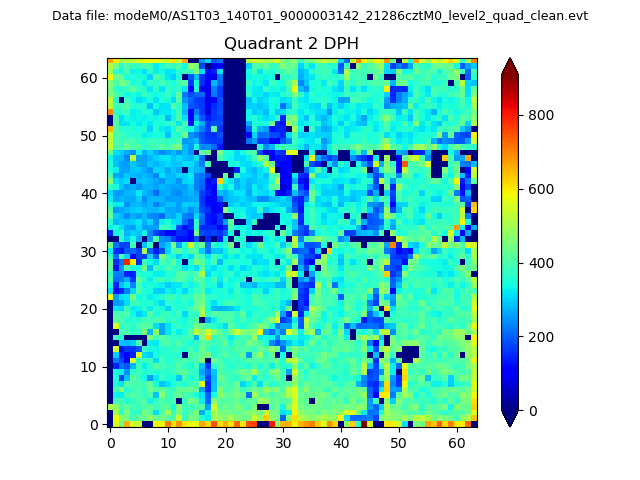
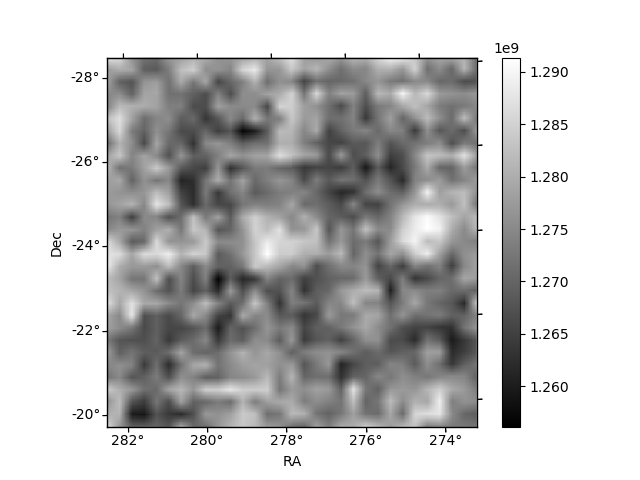
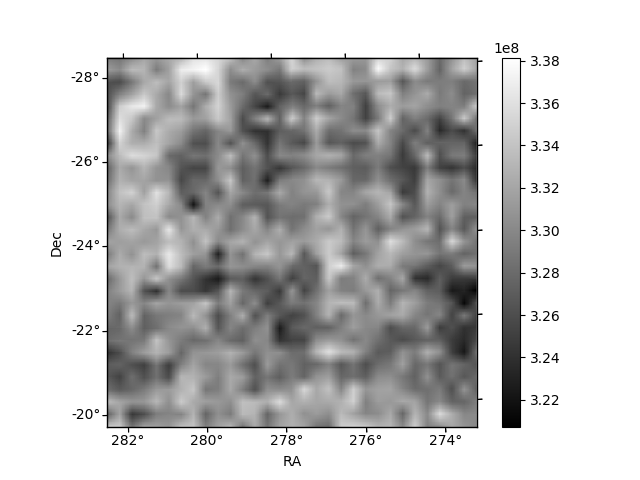
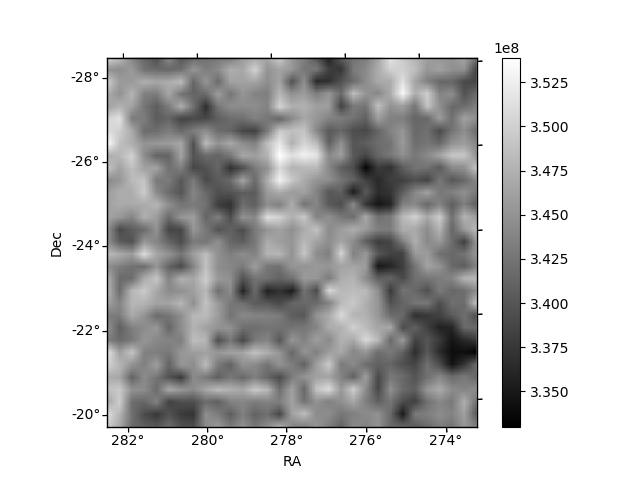
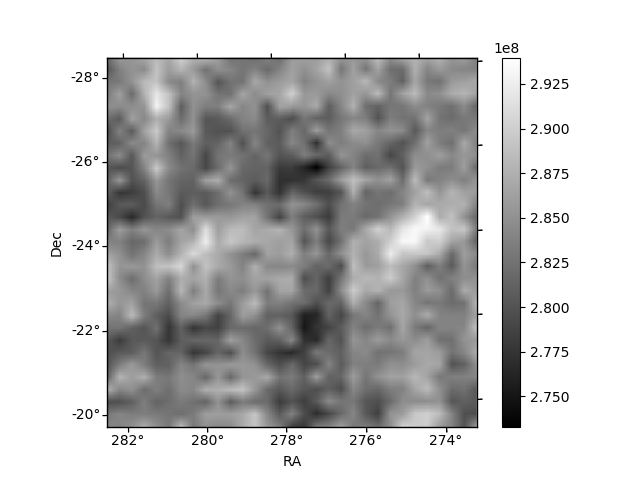
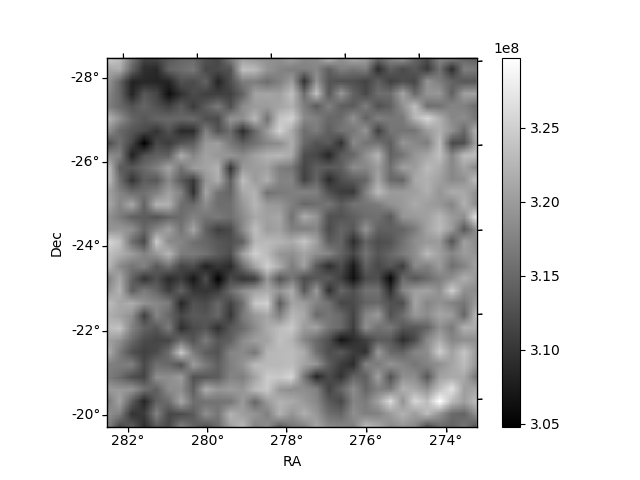
Histogram calculated using DETX and DETY for each event in the final _common_clean file
| Quadrant A | 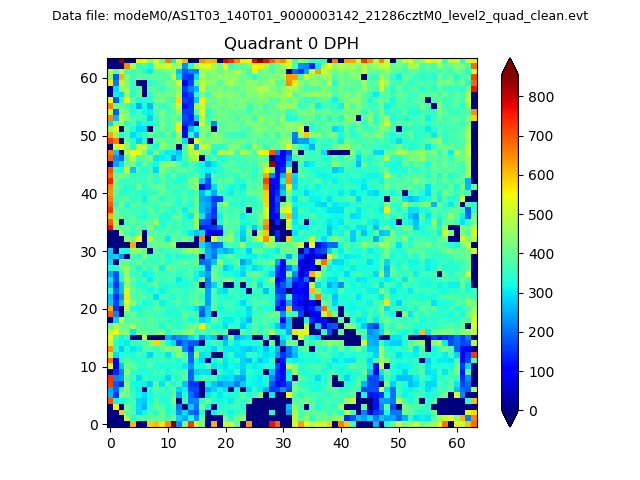 |
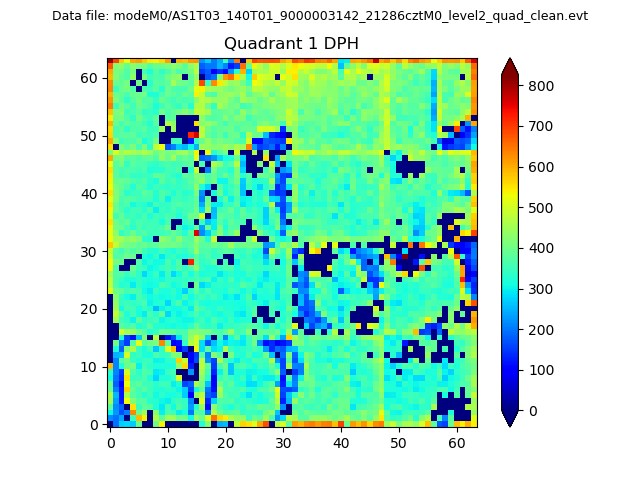 |
Quadrant B |
|---|---|---|---|
| Quadrant D | 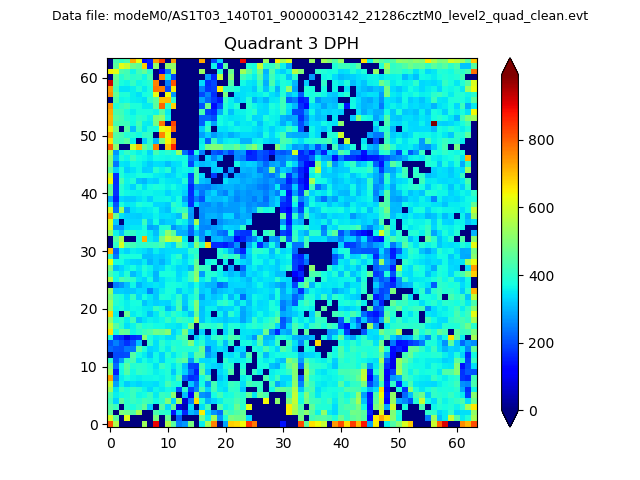 |
 |
Quadrant C |
| Plot type | Count rate plots | Images |
|---|---|---|
| Comparison with Poisson distribution Blue bars denote a histogram of data divided into 1 sec bins. Red curve is a Poisson curve with rate = median count rate of data. |
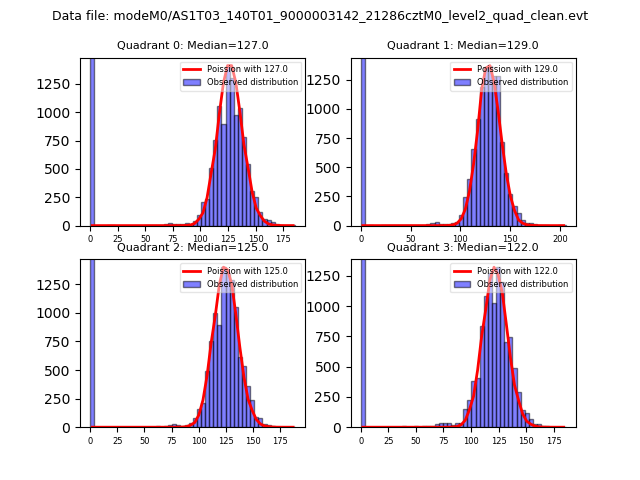 |
 |
| Quadrant-wise count rates Data is divided into 100 sec bins |
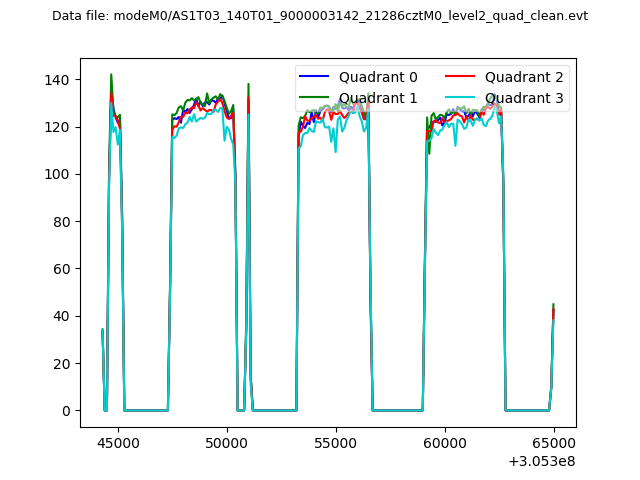 |
|
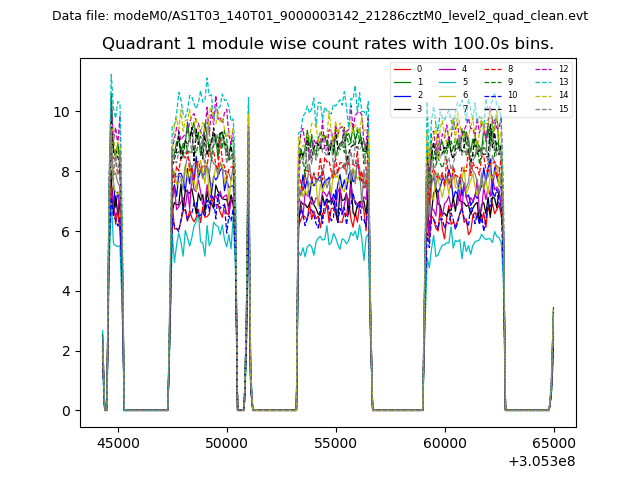
| Module-wise count rates for Quadrant A Data is divided into 100 sec bins |
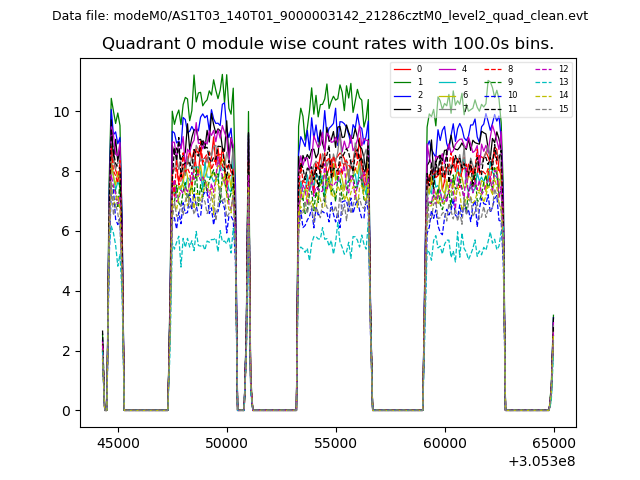 |
 |
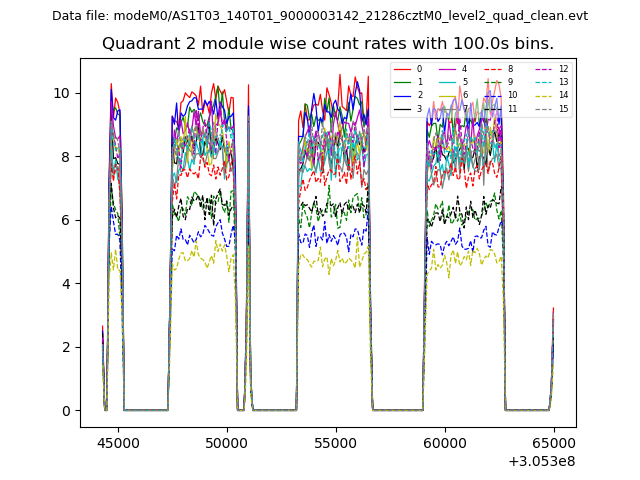
| Module-wise count rates for Quadrant B Data is divided into 100 sec bins |
 |
 |
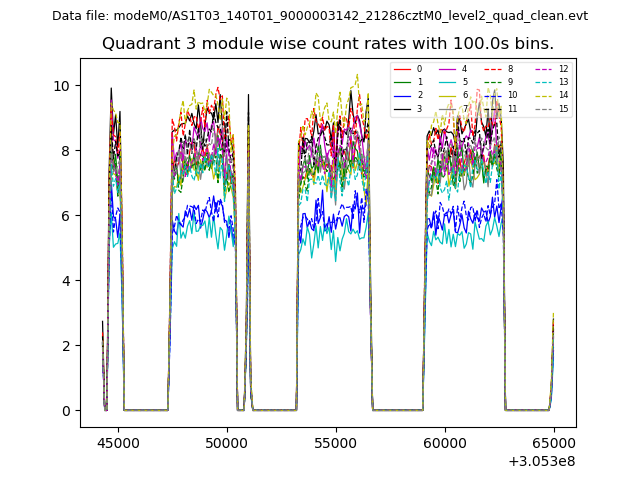
| Module-wise count rates for Quadrant C Data is divided into 100 sec bins |
 |
 |
| Module-wise count rates for Quadrant D Data is divided into 100 sec bins |
 |
 |
| Parameter | Plot |
|---|---|
| CZT HV Monitor | 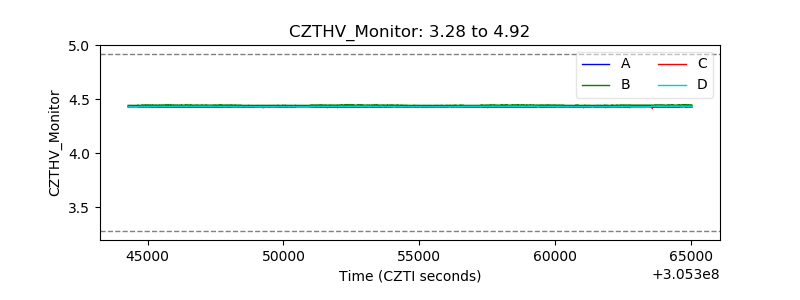 |
| D_VDD | 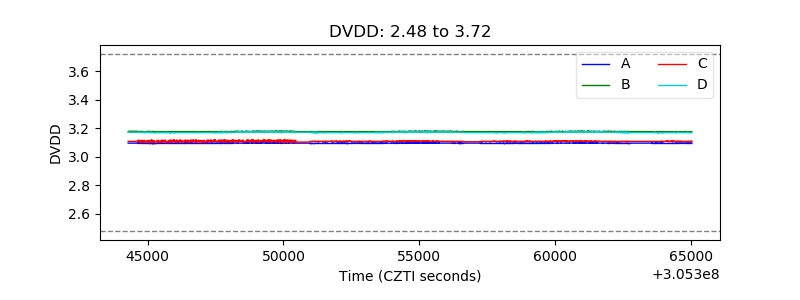 |
| Temperature 1 | 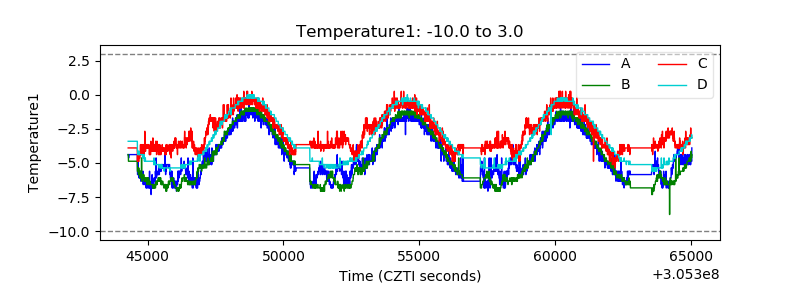 |
| Veto HV Monitor | 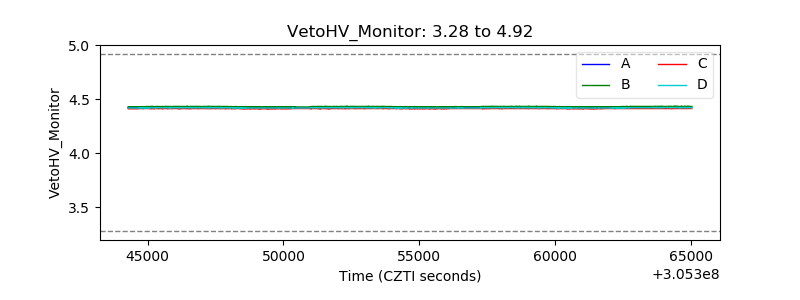 |
| Veto LLD | 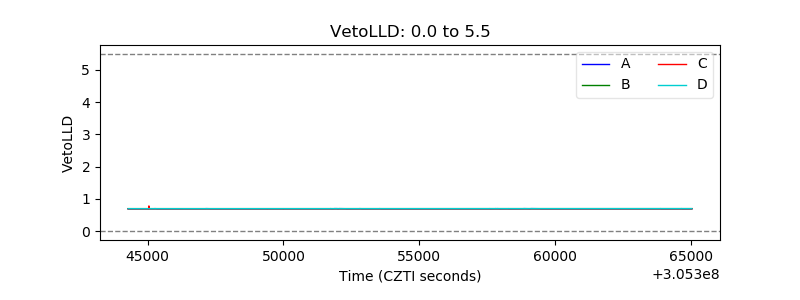 |
| Alpha Counter | 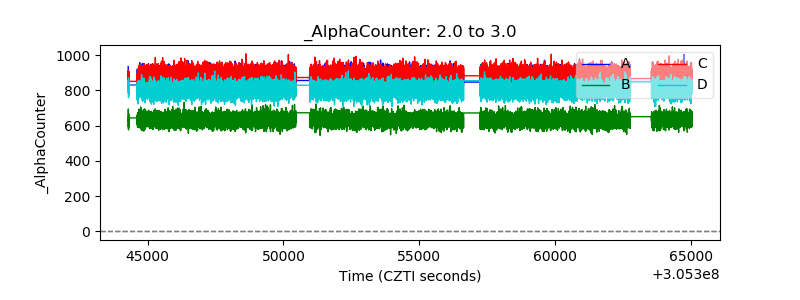 |
| _CPM_Rate | 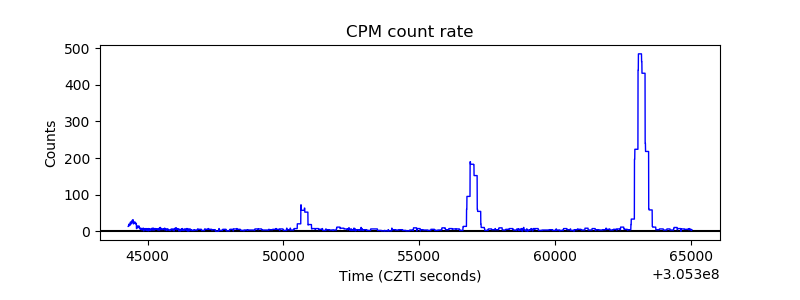 |
| CZT Counter | 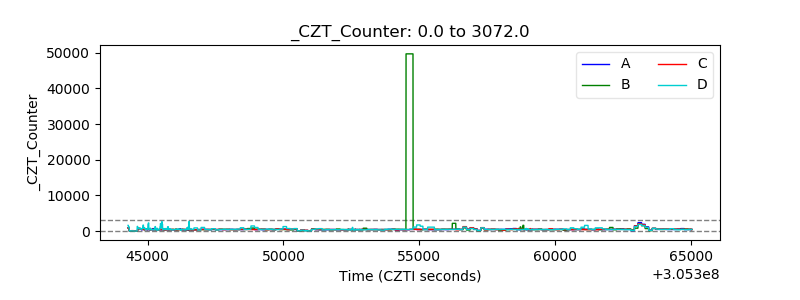 |
| +2.5 Volts monitor |  |
| +5 Volts monitor |  |
| _ROLL_ROT |  |
| _Roll_DEC | 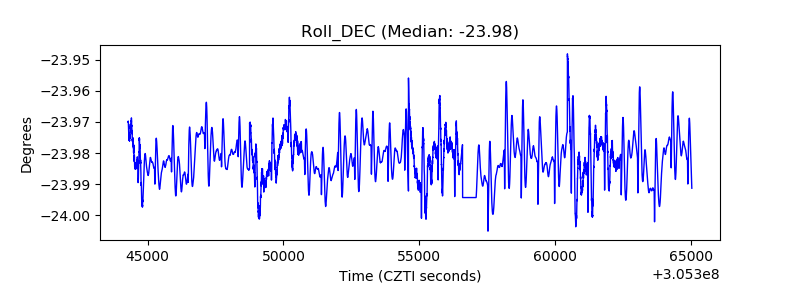 |
| _Roll_RA | 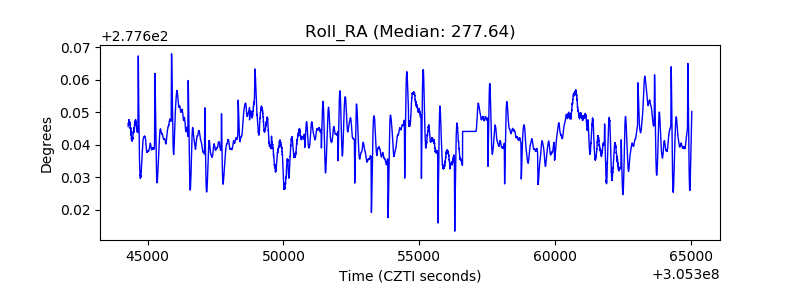 |
| Veto Counter | 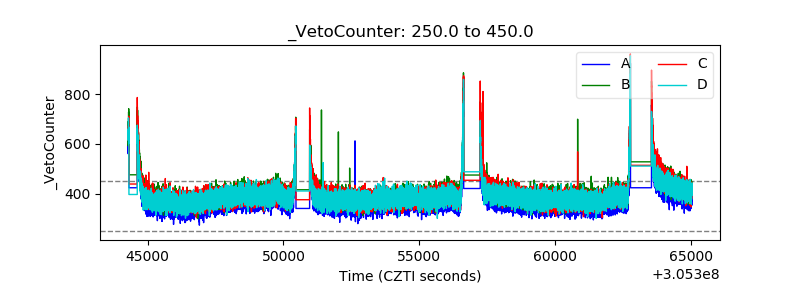 |