| Param | Original file | Final file |
|---|---|---|
| Filename | modeM0/AS1T03_140T01_9000003142_21289cztM0_level2.evt | modeM0/AS1T03_140T01_9000003142_21289cztM0_level2_quad_clean.evt |
| Size (bytes) | 485,380,800 | 93,323,520 |
| Size | 462.9 MB | 89.0 MB |
| Events in quadrant A | 3,491,624 | 606,128 |
| Events in quadrant B | 3,358,249 | 611,954 |
| Events in quadrant C | 3,265,814 | 591,563 |
| Events in quadrant D | 4,143,866 | 564,102 |
| Mode M0 | |||
|---|---|---|---|
| Quadrant | BADHDUFLAG | Total packets | Discarded packets |
| A | 0 | 14535 | 2 |
| B | 0 | 14045 | 2 |
| C | 0 | 13821 | 2 |
| D | 0 | 16438 | 2 |
| Mode M9 | |||
|---|---|---|---|
| Quadrant | BADHDUFLAG | Total packets | Discarded packets |
| A | 0 | 15 | 0 |
| B | 0 | 16 | 0 |
| C | 0 | 16 | 0 |
| D | 0 | 16 | 0 |
| Mode SS | |||
|---|---|---|---|
| Quadrant | BADHDUFLAG | Total packets | Discarded packets |
| A | 0 | 132 | 0 |
| B | 0 | 132 | 0 |
| C | 0 | 132 | 0 |
| D | 0 | 132 | 0 |
| Quadrant | Total seconds | Saturated seconds | Saturation percentage |
|---|---|---|---|
| A | 6485 | 102 | 1.572860% |
| B | 6485 | 81 | 1.249036% |
| C | 6485 | 99 | 1.526600% |
| D | 6485 | 258 | 3.978412% |
Noise dominated data is calculated using 1-second bins in cleaned event files. If a bin has >2000 counts, and if more than 50% of those come from <1% of pixels, then it is considered to be noise-dominated and hence unusable.
| Quadrant | # 1 sec bins | Bins with >0 counts | Bins with >2000 counts | High rate bins dominated by noise | Noise dominated (total time) | Noise dominated (detector-on time) | Marked lightcurve |
|---|---|---|---|---|---|---|---|
| A | 7605 | 6485 | 34 | 34 | 0.45% | 0.52% | 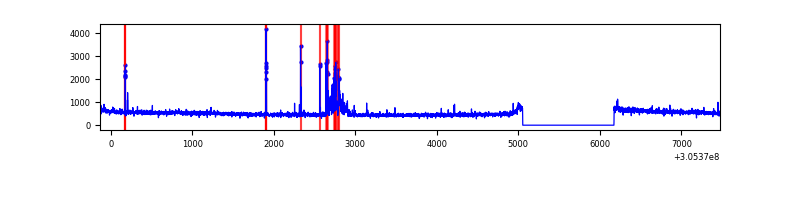 |
| B | 7605 | 6485 | 3 | 3 | 0.04% | 0.05% | 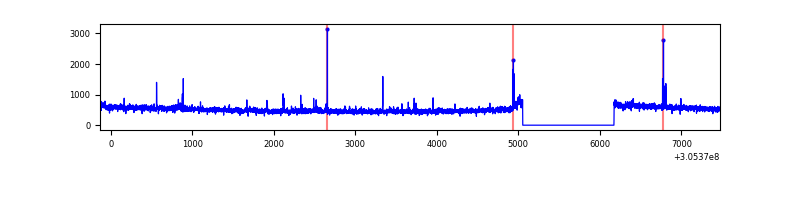 |
| C | 7605 | 6485 | 0 | 0 | 0.00% | 0.00% | 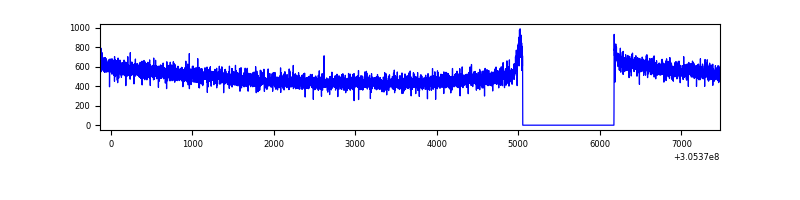 |
| D | 7605 | 6485 | 202 | 202 | 2.66% | 3.11% | 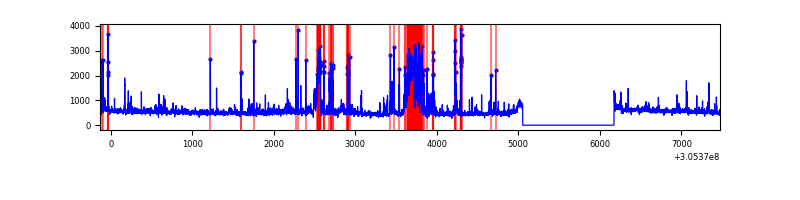 |
Top three noisy pixels from each quadrant. If the there are fewer than three noisy pixels in the level2.evt file, extra rows are filled as -1
| Pixel properties | Quadrant properties | ||||||
|---|---|---|---|---|---|---|---|
| Quadrant | DetID | PixID | Counts | Sigma | Mean | Median | Sigma |
| A | 9 | 143 | 181224 | 1065.7 | 846 | 830 | 169.3 |
| A | 4 | 2 | 24058 | 137.22 | 846 | 830 | 169.3 |
| A | 5 | 16 | 15356 | 85.81 | 846 | 830 | 169.3 |
| B | 0 | 230 | 40678 | 250.57 | 836 | 818 | 159.1 |
| B | 3 | 64 | 19136 | 115.15 | 836 | 818 | 159.1 |
| B | 12 | 111 | 18742 | 112.67 | 836 | 818 | 159.1 |
| C | 14 | 238 | 128597 | 687.6 | 803 | 810 | 185.8 |
| C | 13 | 61 | 5607 | 25.81 | 803 | 810 | 185.8 |
| C | 3 | 233 | 5514 | 25.31 | 803 | 810 | 185.8 |
| D | 7 | 38 | 531580 | 2717.54 | 812 | 791 | 195.3 |
| D | 1 | 52 | 148036 | 753.87 | 812 | 791 | 195.3 |
| D | 13 | 153 | 145665 | 741.73 | 812 | 791 | 195.3 |
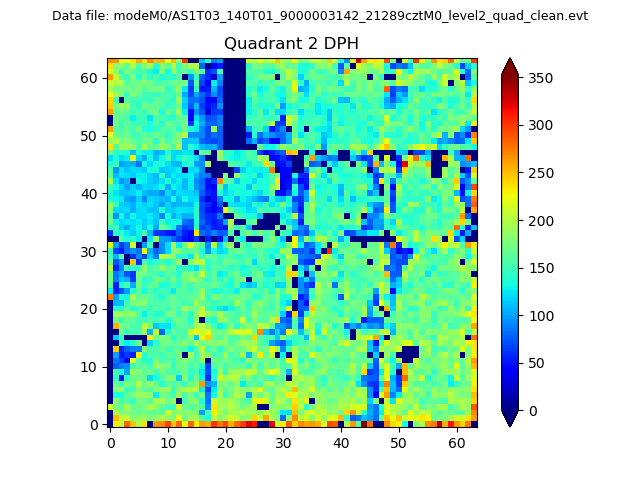
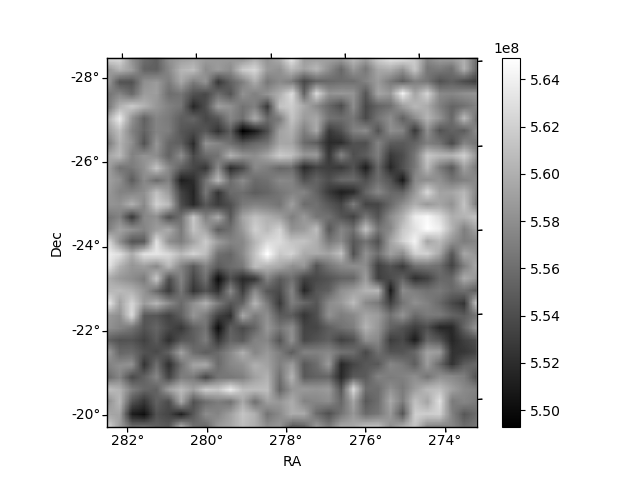
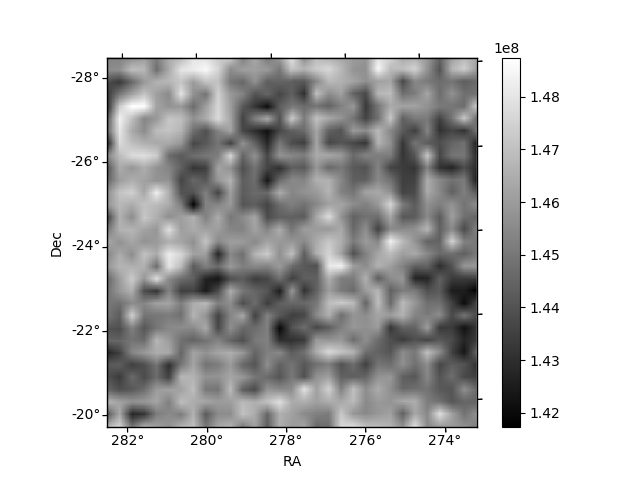
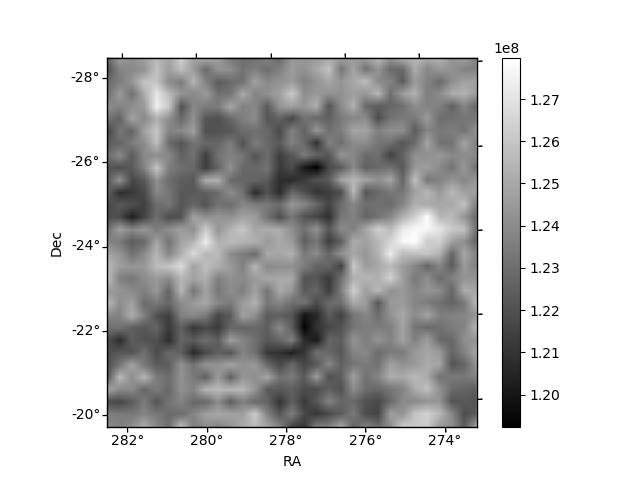
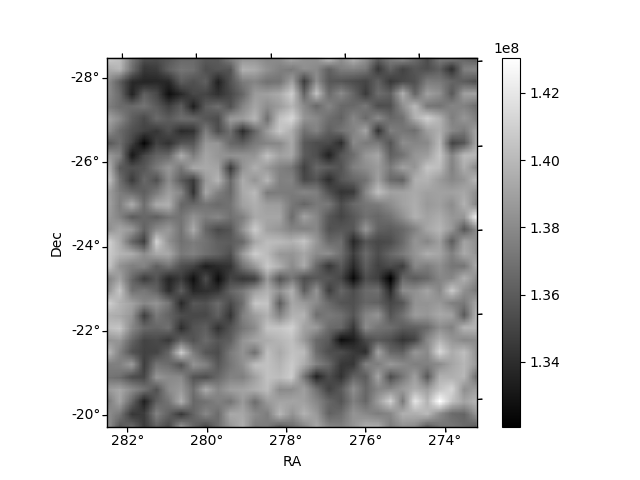
Histogram calculated using DETX and DETY for each event in the final _common_clean file
| Quadrant A | 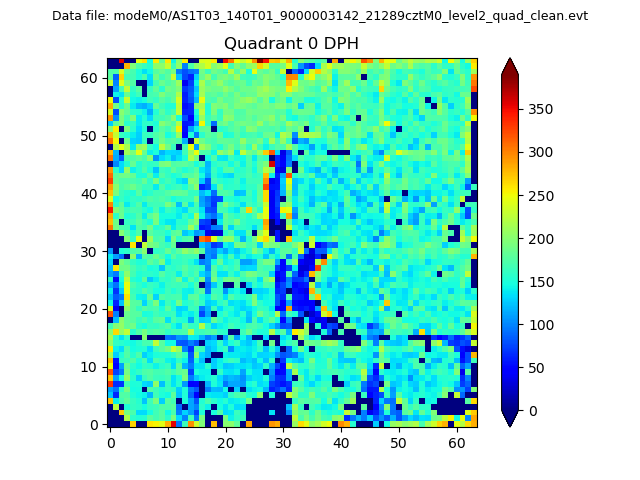 |
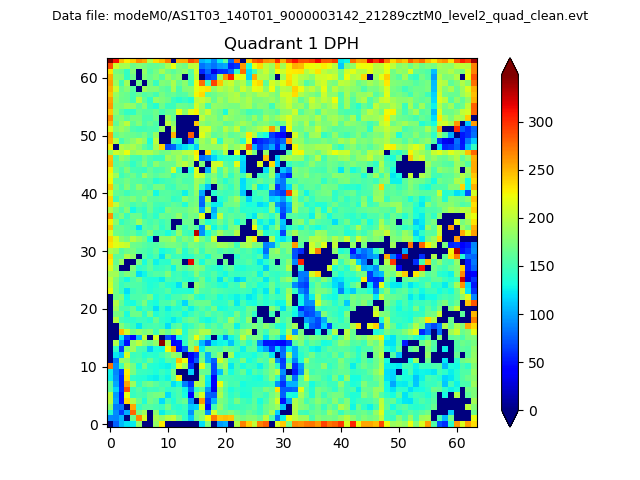 |
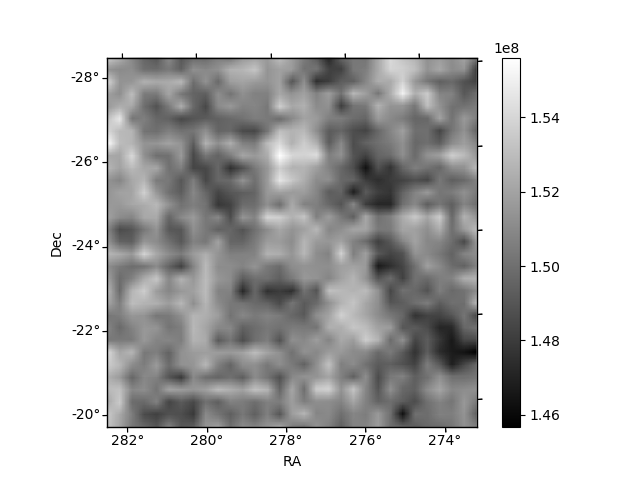
Quadrant B |
|---|---|---|---|
| Quadrant D | 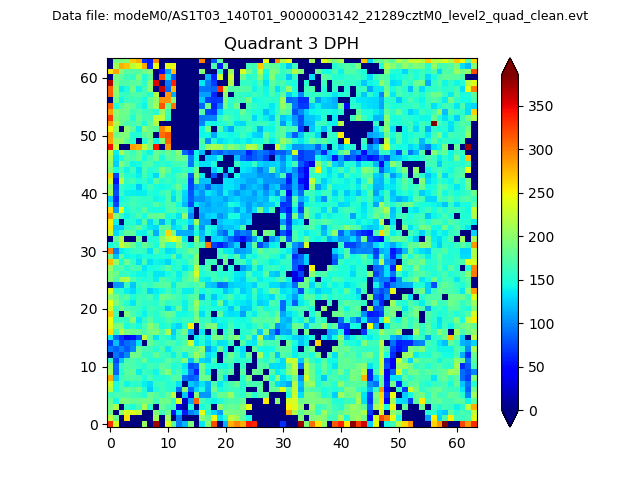 |
 |
Quadrant C |
| Plot type | Count rate plots | Images |
|---|---|---|
| Comparison with Poisson distribution Blue bars denote a histogram of data divided into 1 sec bins. Red curve is a Poisson curve with rate = median count rate of data. |
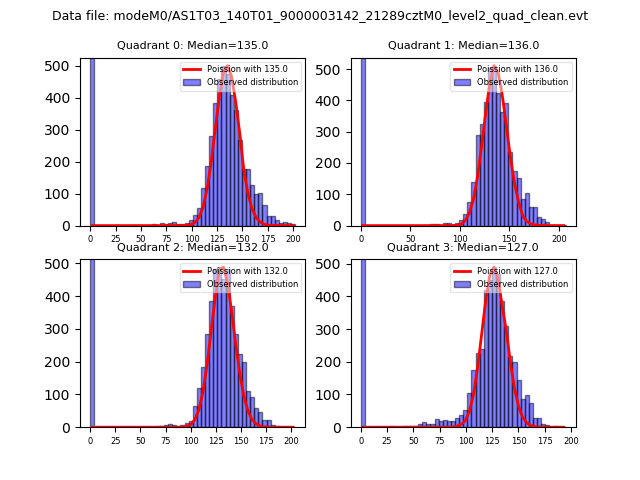 |
 |
| Quadrant-wise count rates Data is divided into 100 sec bins |
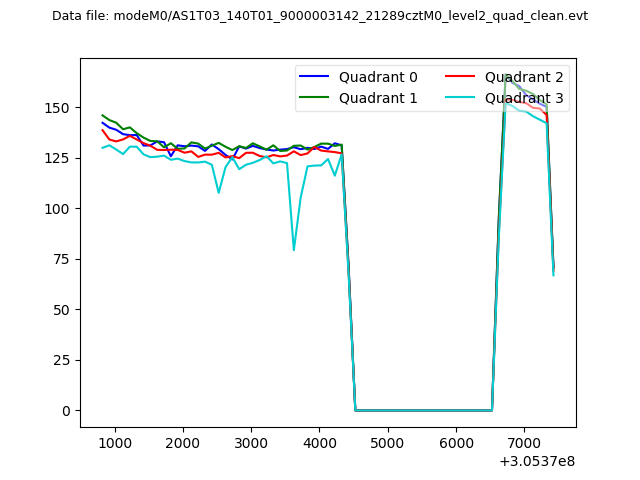 |
|
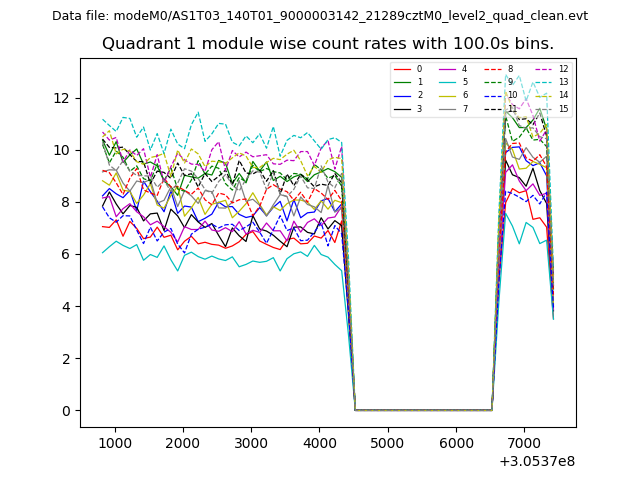
| Module-wise count rates for Quadrant A Data is divided into 100 sec bins |
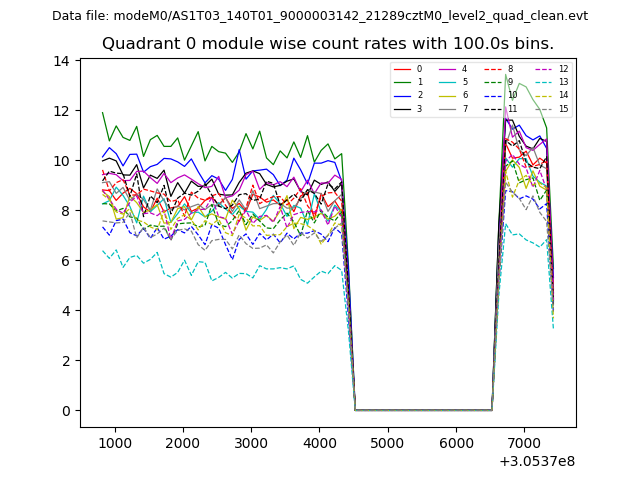 |
 |
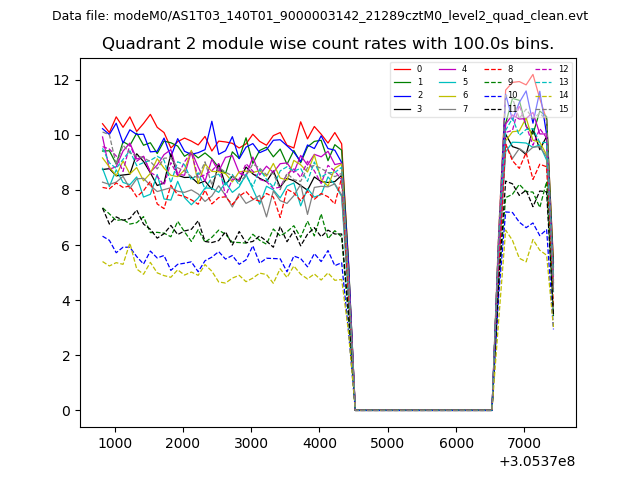
| Module-wise count rates for Quadrant B Data is divided into 100 sec bins |
 |
 |
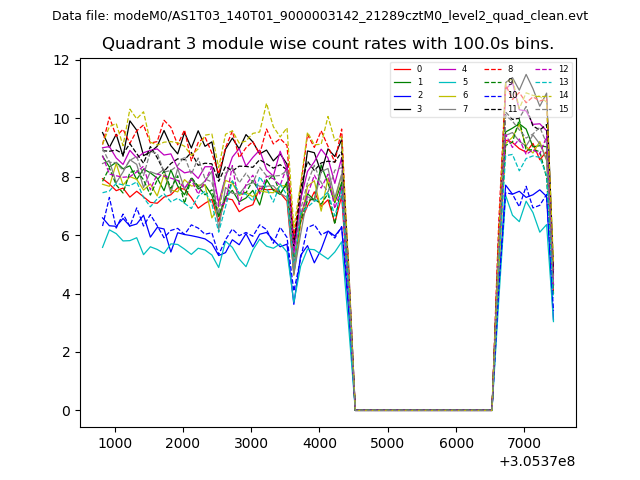
| Module-wise count rates for Quadrant C Data is divided into 100 sec bins |
 |
 |
| Module-wise count rates for Quadrant D Data is divided into 100 sec bins |
 |
 |
| Parameter | Plot |
|---|---|
| CZT HV Monitor | 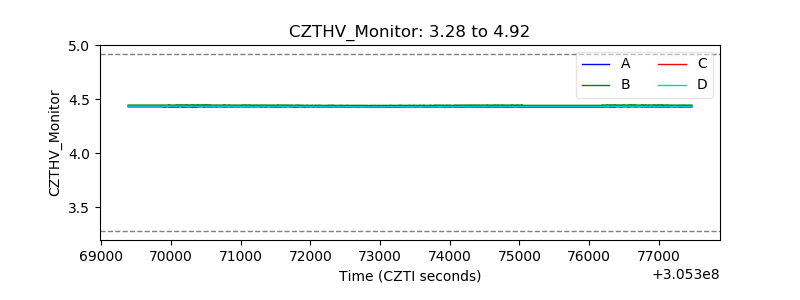 |
| D_VDD | 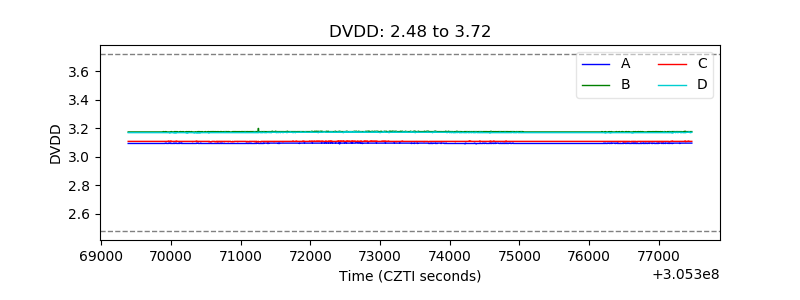 |
| Temperature 1 |  |
| Veto HV Monitor | 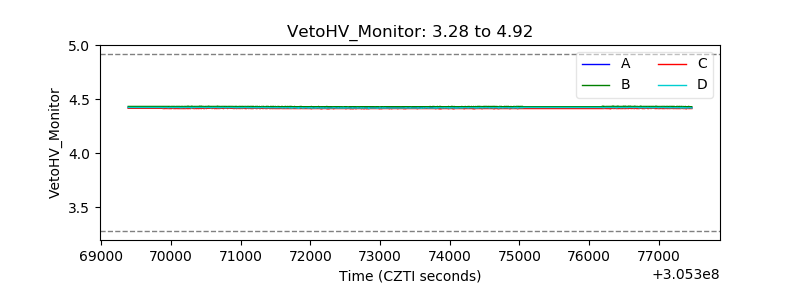 |
| Veto LLD | 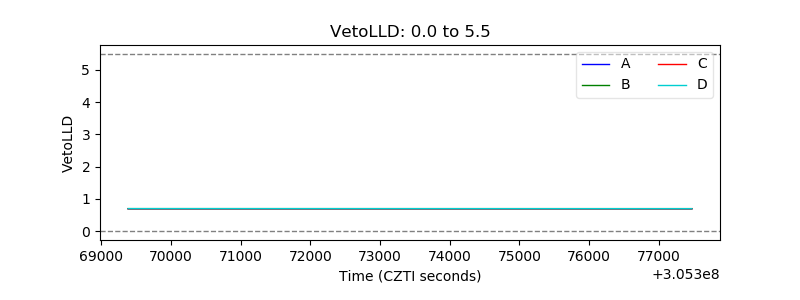 |
| Alpha Counter | 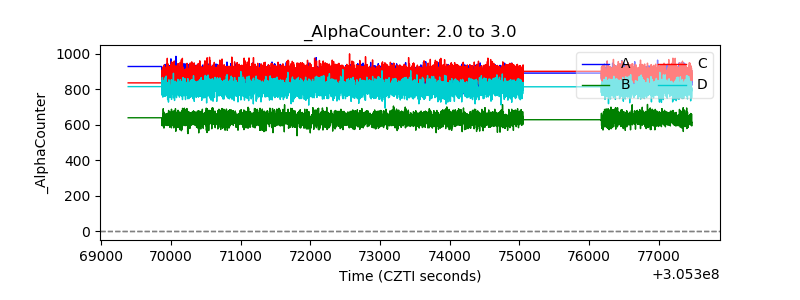 |
| _CPM_Rate | 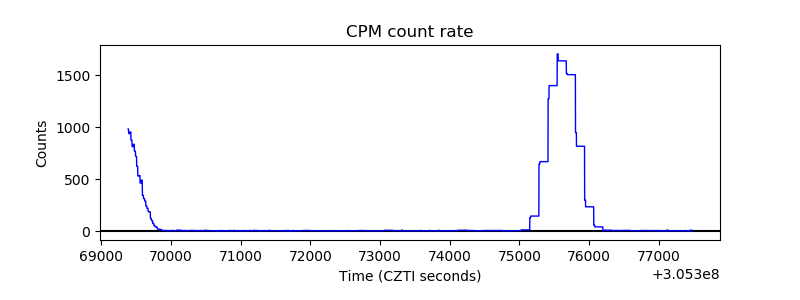 |
| CZT Counter | 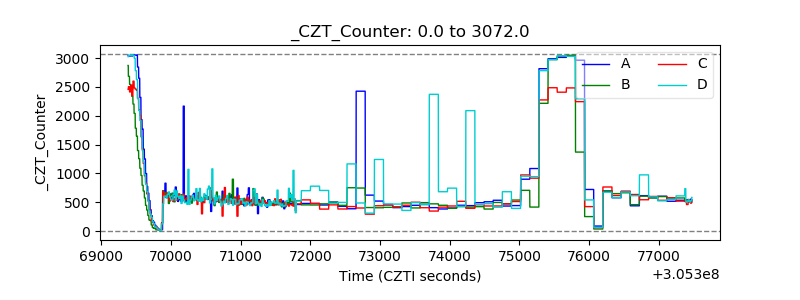 |
| +2.5 Volts monitor |  |
| +5 Volts monitor |  |
| _ROLL_ROT | 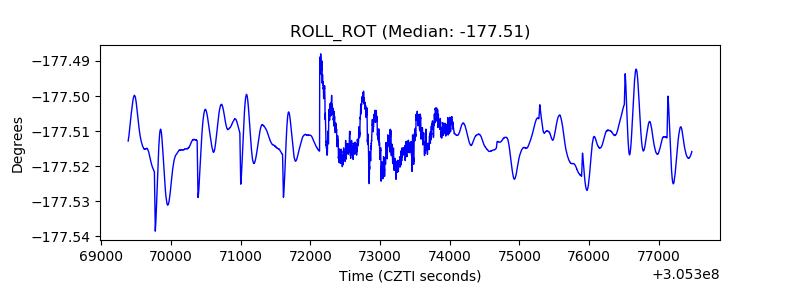 |
| _Roll_DEC | 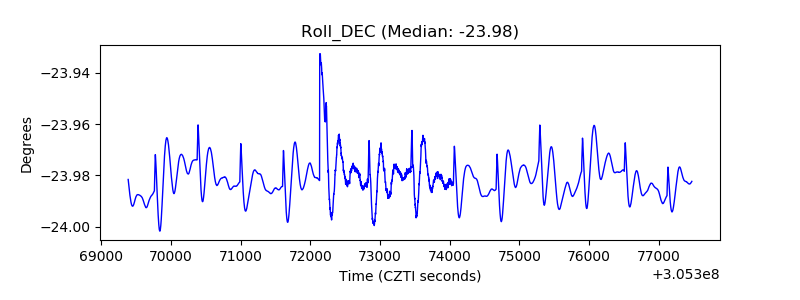 |
| _Roll_RA | 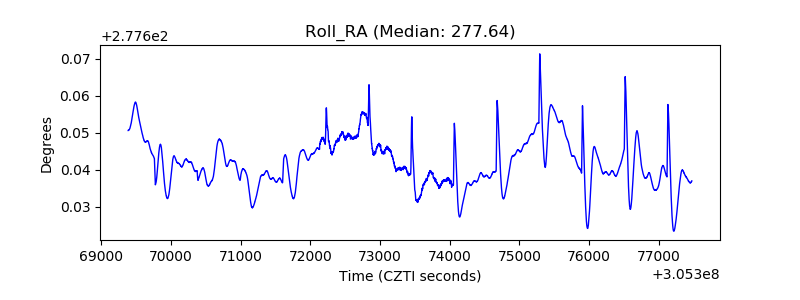 |
| Veto Counter | 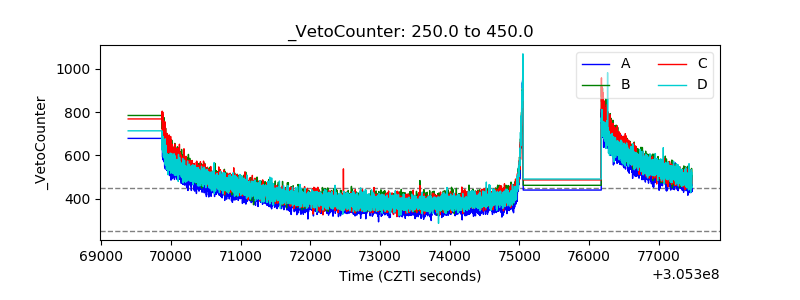 |