| Param | Original file | Final file |
|---|---|---|
| Filename | modeM0/AS1T03_140T01_9000003142_21291cztM0_level2.evt | modeM0/AS1T03_140T01_9000003142_21291cztM0_level2_quad_clean.evt |
| Size (bytes) | 477,005,760 | 117,912,960 |
| Size | 454.9 MB | 112.5 MB |
| Events in quadrant A | 3,360,009 | 811,930 |
| Events in quadrant B | 3,612,334 | 800,326 |
| Events in quadrant C | 3,266,273 | 769,561 |
| Events in quadrant D | 3,784,793 | 755,068 |
| Mode M0 | |||
|---|---|---|---|
| Quadrant | BADHDUFLAG | Total packets | Discarded packets |
| A | 0 | 14079 | 1 |
| B | 0 | 14698 | 1 |
| C | 0 | 13717 | 1 |
| D | 0 | 15350 | 1 |
| Mode M9 | |||
|---|---|---|---|
| Quadrant | BADHDUFLAG | Total packets | Discarded packets |
| A | 0 | 13 | 0 |
| B | 0 | 13 | 0 |
| C | 0 | 13 | 0 |
| D | 0 | 13 | 0 |
| Mode SS | |||
|---|---|---|---|
| Quadrant | BADHDUFLAG | Total packets | Discarded packets |
| A | 0 | 126 | 0 |
| B | 0 | 126 | 0 |
| C | 0 | 126 | 0 |
| D | 0 | 126 | 0 |
| Quadrant | Total seconds | Saturated seconds | Saturation percentage |
|---|---|---|---|
| A | 6227 | 80 | 1.284728% |
| B | 6227 | 172 | 2.762165% |
| C | 6227 | 100 | 1.605910% |
| D | 6227 | 130 | 2.087683% |
Noise dominated data is calculated using 1-second bins in cleaned event files. If a bin has >2000 counts, and if more than 50% of those come from <1% of pixels, then it is considered to be noise-dominated and hence unusable.
| Quadrant | # 1 sec bins | Bins with >0 counts | Bins with >2000 counts | High rate bins dominated by noise | Noise dominated (total time) | Noise dominated (detector-on time) | Marked lightcurve |
|---|---|---|---|---|---|---|---|
| A | 7527 | 6227 | 4 | 4 | 0.05% | 0.06% | 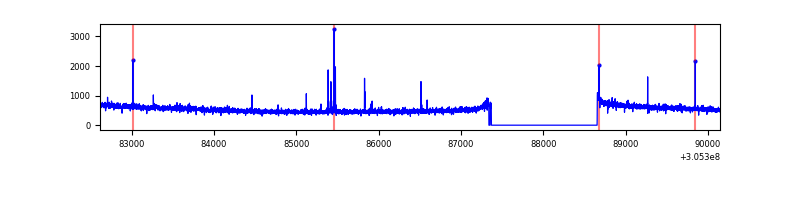 |
| B | 7527 | 6228 | 89 | 89 | 1.18% | 1.43% | 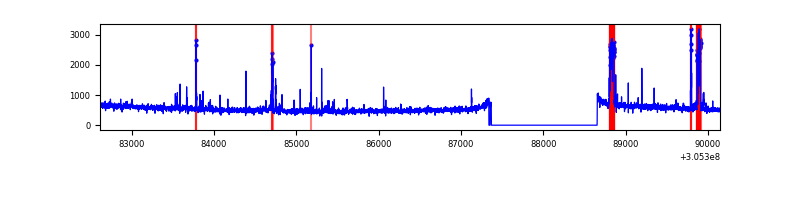 |
| C | 7527 | 6228 | 0 | 0 | 0.00% | 0.00% |  |
| D | 7527 | 6228 | 75 | 75 | 1.00% | 1.20% | 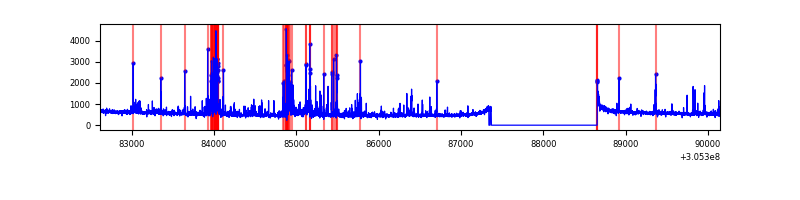 |
Top three noisy pixels from each quadrant. If the there are fewer than three noisy pixels in the level2.evt file, extra rows are filled as -1
| Pixel properties | Quadrant properties | ||||||
|---|---|---|---|---|---|---|---|
| Quadrant | DetID | PixID | Counts | Sigma | Mean | Median | Sigma |
| A | 5 | 16 | 21102 | 117.85 | 860 | 846 | 171.9 |
| A | 13 | 254 | 10581 | 56.64 | 860 | 846 | 171.9 |
| A | 4 | 2 | 10057 | 53.59 | 860 | 846 | 171.9 |
| B | 3 | 64 | 285892 | 1835.54 | 834 | 819 | 155.3 |
| B | 0 | 190 | 23623 | 146.83 | 834 | 819 | 155.3 |
| B | 12 | 111 | 17554 | 107.75 | 834 | 819 | 155.3 |
| C | 14 | 238 | 129489 | 696.14 | 801 | 808 | 184.8 |
| C | 3 | 233 | 12785 | 64.79 | 801 | 808 | 184.8 |
| C | 13 | 61 | 5719 | 26.57 | 801 | 808 | 184.8 |
| D | 1 | 52 | 233833 | 1189.99 | 822 | 800 | 195.8 |
| D | 7 | 38 | 192287 | 977.84 | 822 | 800 | 195.8 |
| D | 12 | 235 | 100681 | 510.05 | 822 | 800 | 195.8 |
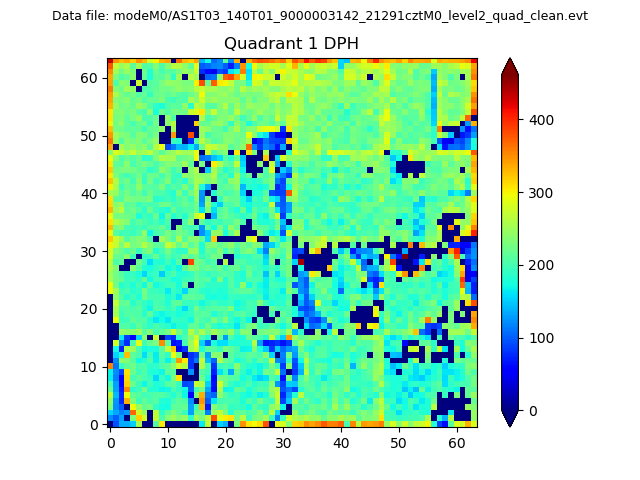
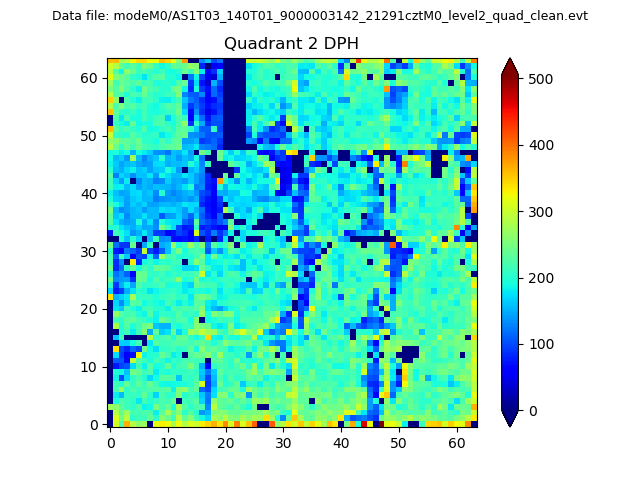
Histogram calculated using DETX and DETY for each event in the final _common_clean file
| Quadrant A | 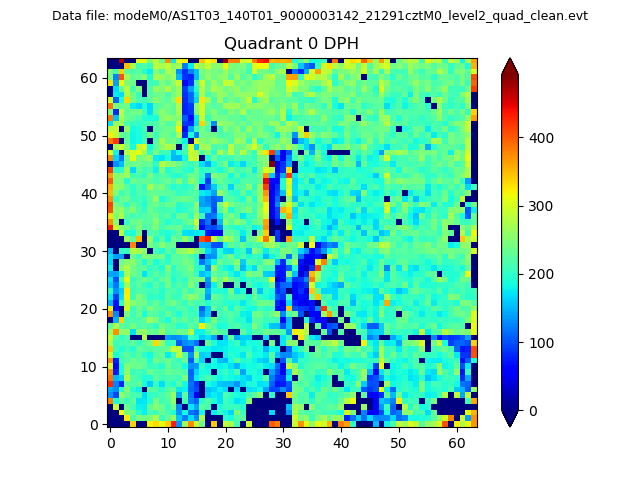 |
 |
Quadrant B |
|---|---|---|---|
| Quadrant D | 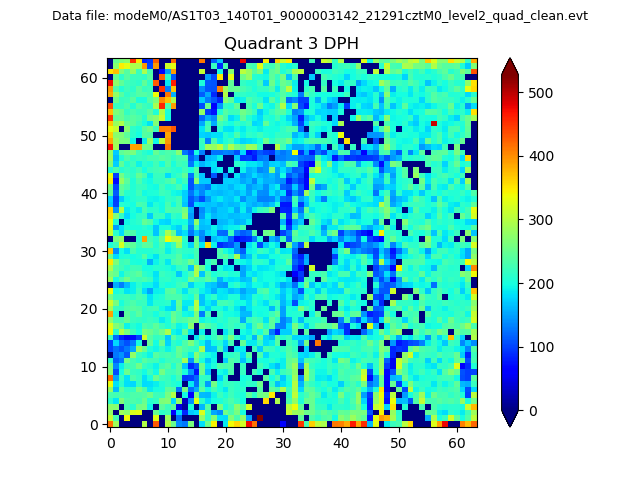 |
 |
Quadrant C |
| Plot type | Count rate plots | Images |
|---|---|---|
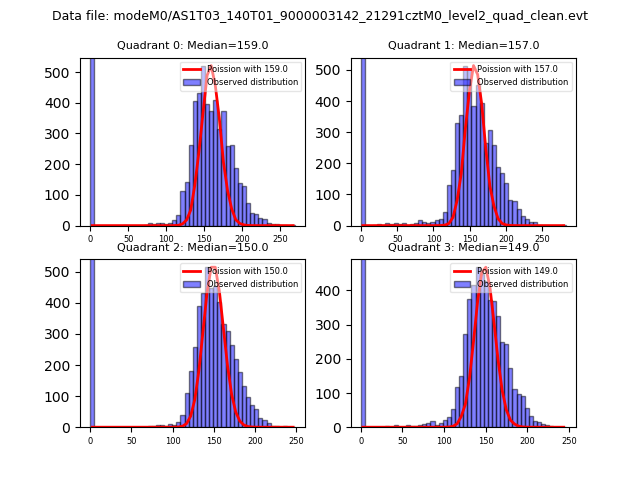
| Comparison with Poisson distribution Blue bars denote a histogram of data divided into 1 sec bins. Red curve is a Poisson curve with rate = median count rate of data. |
 |
 |
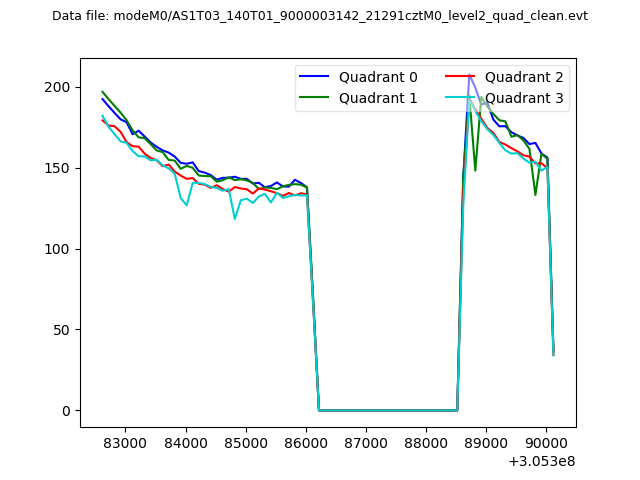
| Quadrant-wise count rates Data is divided into 100 sec bins |
 |
|
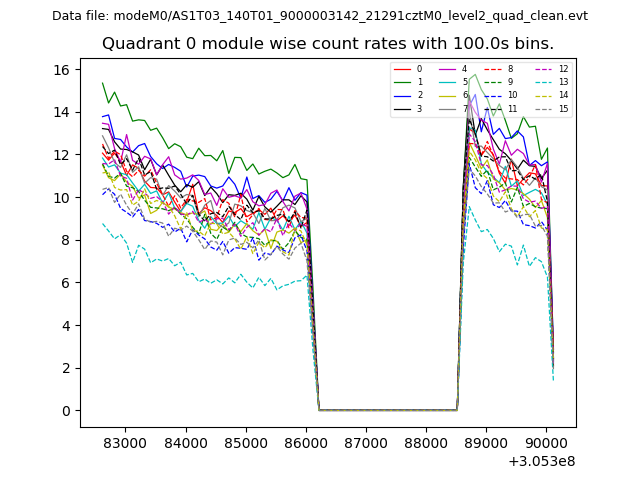
| Module-wise count rates for Quadrant A Data is divided into 100 sec bins |
 |
 |
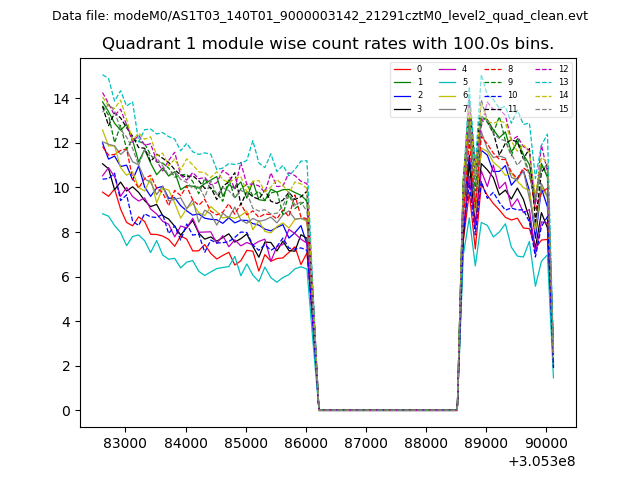
| Module-wise count rates for Quadrant B Data is divided into 100 sec bins |
 |
 |
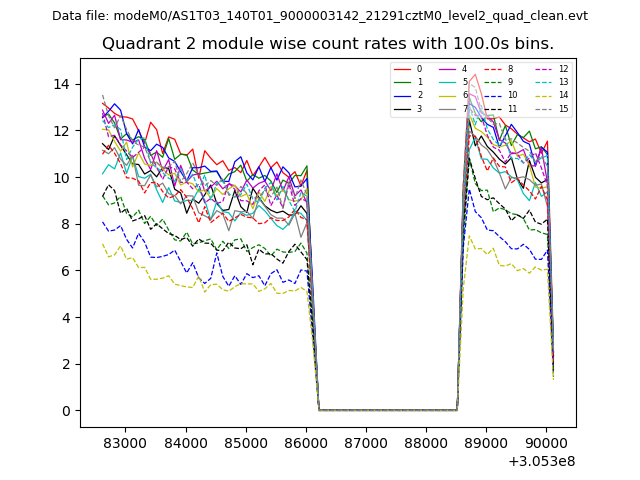
| Module-wise count rates for Quadrant C Data is divided into 100 sec bins |
 |
 |
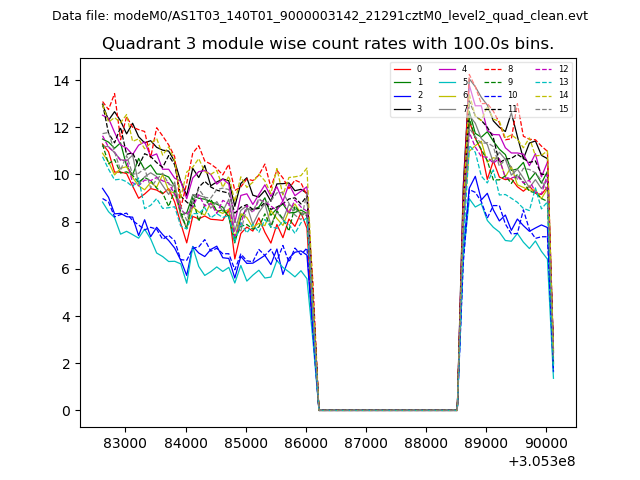
| Module-wise count rates for Quadrant D Data is divided into 100 sec bins |
 |
 |
| Parameter | Plot |
|---|---|
| CZT HV Monitor | 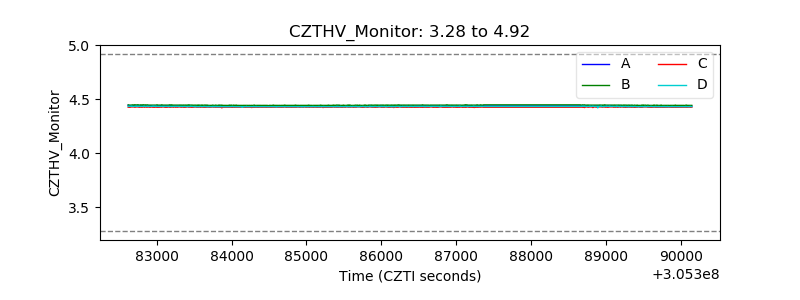 |
| D_VDD |  |
| Temperature 1 | 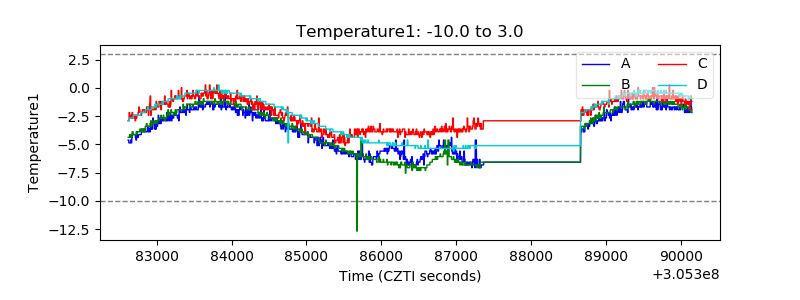 |
| Veto HV Monitor | 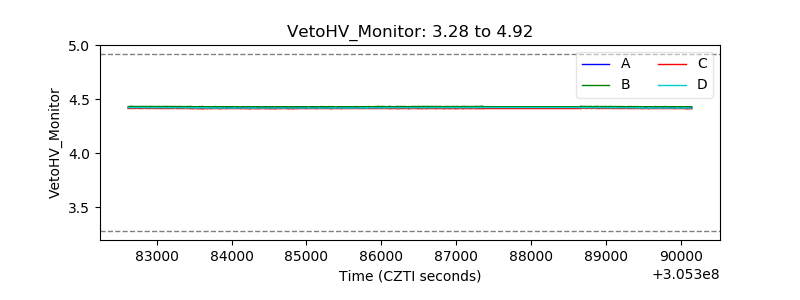 |
| Veto LLD | 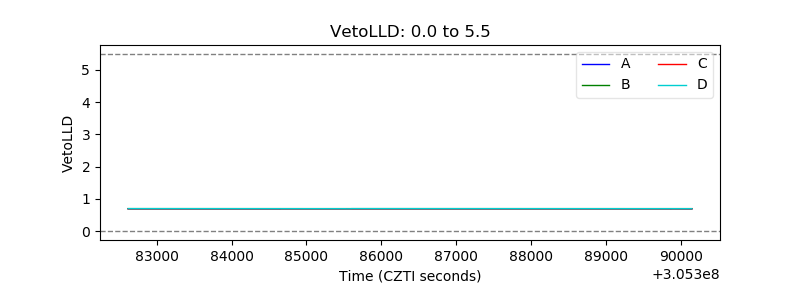 |
| Alpha Counter | 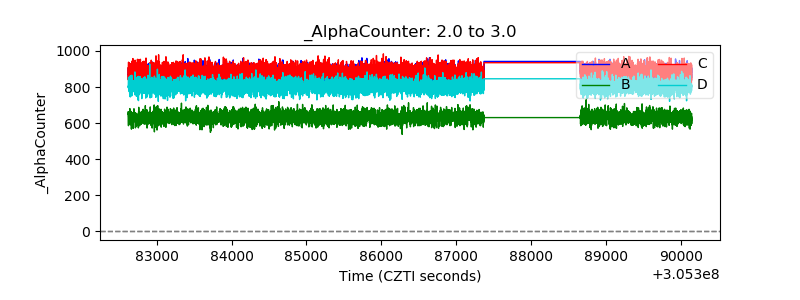 |
| _CPM_Rate | 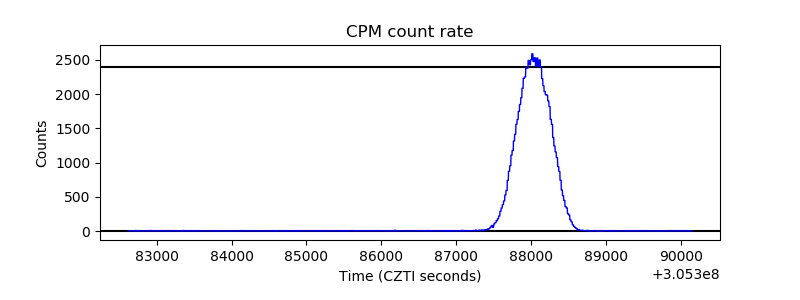 |
| CZT Counter | 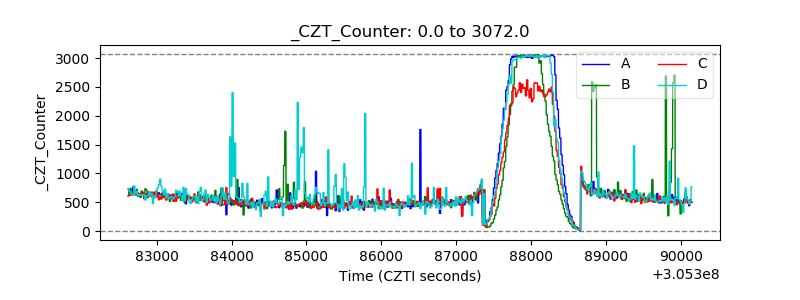 |
| +2.5 Volts monitor |  |
| +5 Volts monitor |  |
| _ROLL_ROT | 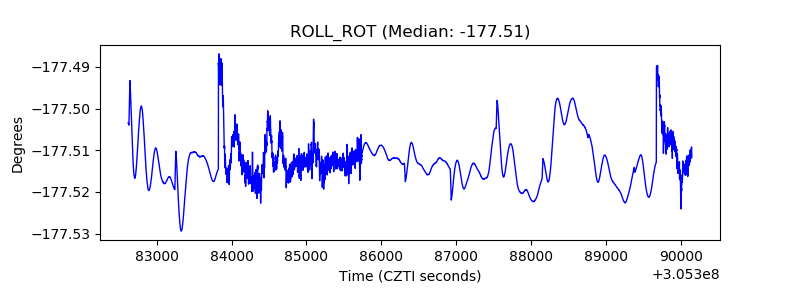 |
| _Roll_DEC | 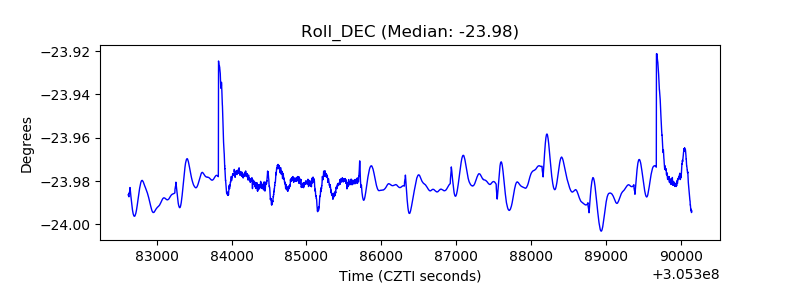 |
| _Roll_RA | 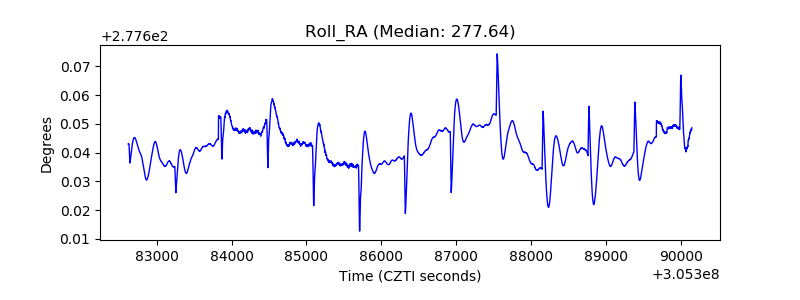 |
| Veto Counter | 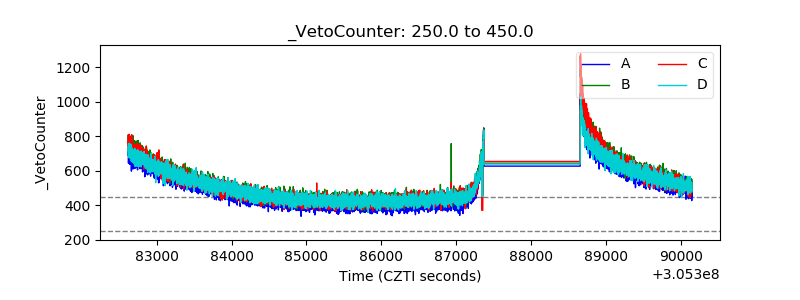 |