| Param | Original file | Final file |
|---|---|---|
| Filename | modeM0/AS1T03_140T01_9000003142_21292cztM0_level2.evt | modeM0/AS1T03_140T01_9000003142_21292cztM0_level2_quad_clean.evt |
| Size (bytes) | 446,592,960 | 86,304,960 |
| Size | 425.9 MB | 82.3 MB |
| Events in quadrant A | 2,815,792 | 586,636 |
| Events in quadrant B | 3,038,761 | 578,212 |
| Events in quadrant C | 2,704,080 | 556,677 |
| Events in quadrant D | 4,601,645 | 516,371 |
| Mode M0 | |||
|---|---|---|---|
| Quadrant | BADHDUFLAG | Total packets | Discarded packets |
| A | 0 | 11878 | 135 |
| B | 0 | 12600 | 151 |
| C | 0 | 11525 | 153 |
| D | 0 | 17497 | 184 |
| Mode M9 | |||
|---|---|---|---|
| Quadrant | BADHDUFLAG | Total packets | Discarded packets |
| A | 0 | 13 | 0 |
| B | 0 | 13 | 0 |
| C | 0 | 13 | 0 |
| D | 0 | 13 | 0 |
| Mode SS | |||
|---|---|---|---|
| Quadrant | BADHDUFLAG | Total packets | Discarded packets |
| A | 0 | 110 | 0 |
| B | 0 | 110 | 0 |
| C | 0 | 110 | 0 |
| D | 0 | 110 | 0 |
| Quadrant | Total seconds | Saturated seconds | Saturation percentage |
|---|---|---|---|
| A | 5367 | 106 | 1.975033% |
| B | 5363 | 192 | 3.580086% |
| C | 5356 | 128 | 2.389843% |
| D | 5360 | 487 | 9.085821% |
Noise dominated data is calculated using 1-second bins in cleaned event files. If a bin has >2000 counts, and if more than 50% of those come from <1% of pixels, then it is considered to be noise-dominated and hence unusable.
| Quadrant | # 1 sec bins | Bins with >0 counts | Bins with >2000 counts | High rate bins dominated by noise | Noise dominated (total time) | Noise dominated (detector-on time) | Marked lightcurve |
|---|---|---|---|---|---|---|---|
| A | 6731 | 5391 | 6 | 6 | 0.09% | 0.11% | 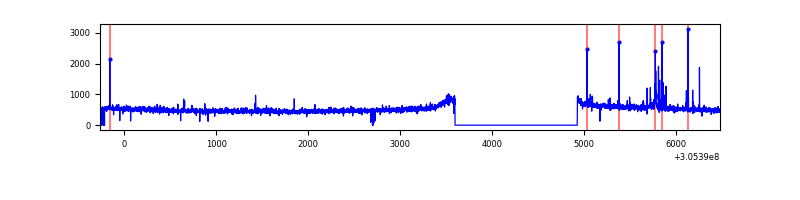 |
| B | 6724 | 5386 | 78 | 78 | 1.16% | 1.45% | 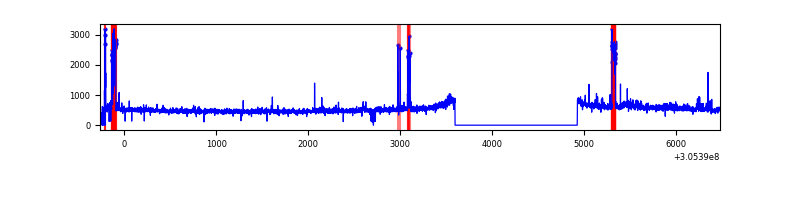 |
| C | 6742 | 5387 | 0 | 0 | 0.00% | 0.00% | 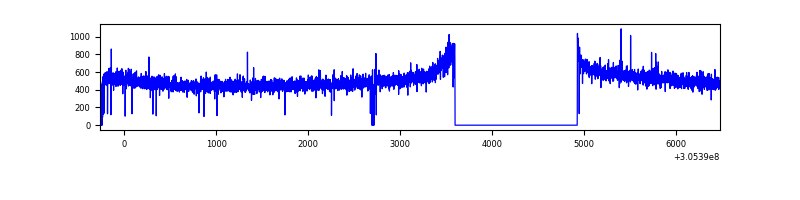 |
| D | 6738 | 5384 | 426 | 426 | 6.32% | 7.91% | 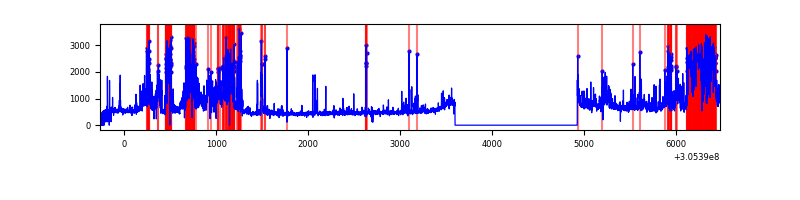 |
Top three noisy pixels from each quadrant. If the there are fewer than three noisy pixels in the level2.evt file, extra rows are filled as -1
| Pixel properties | Quadrant properties | ||||||
|---|---|---|---|---|---|---|---|
| Quadrant | DetID | PixID | Counts | Sigma | Mean | Median | Sigma |
| A | 5 | 16 | 25974 | 176.92 | 711 | 700 | 142.9 |
| A | 9 | 143 | 24239 | 164.77 | 711 | 700 | 142.9 |
| A | 15 | 236 | 20405 | 137.93 | 711 | 700 | 142.9 |
| B | 3 | 64 | 155966 | 1182.84 | 692 | 676 | 131.3 |
| B | 0 | 189 | 118362 | 896.41 | 692 | 676 | 131.3 |
| B | 0 | 229 | 25069 | 185.8 | 692 | 676 | 131.3 |
| C | 14 | 238 | 107382 | 697.89 | 663 | 667 | 152.9 |
| C | 3 | 233 | 11344 | 69.83 | 663 | 667 | 152.9 |
| C | 13 | 61 | 4699 | 26.37 | 663 | 667 | 152.9 |
| D | 7 | 38 | 1632851 | 10173.5 | 661 | 642 | 160.4 |
| D | 12 | 235 | 177292 | 1101.05 | 661 | 642 | 160.4 |
| D | 1 | 52 | 134615 | 835.05 | 661 | 642 | 160.4 |
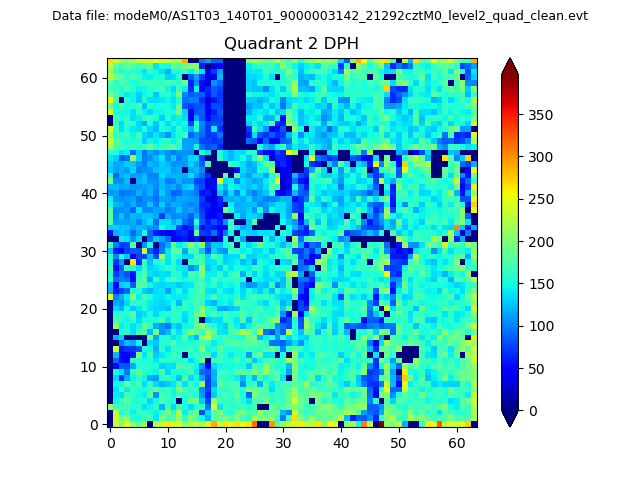
Histogram calculated using DETX and DETY for each event in the final _common_clean file
| Quadrant A | 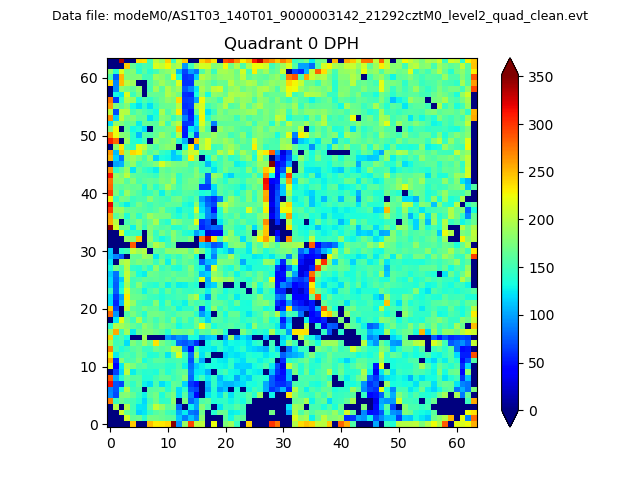 |
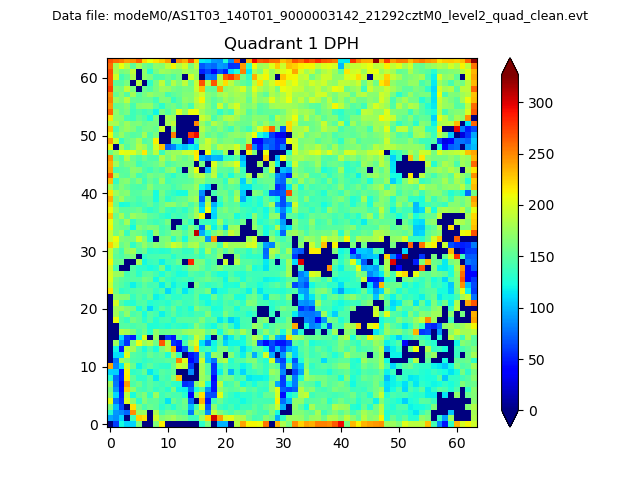 |
Quadrant B |
|---|---|---|---|
| Quadrant D | 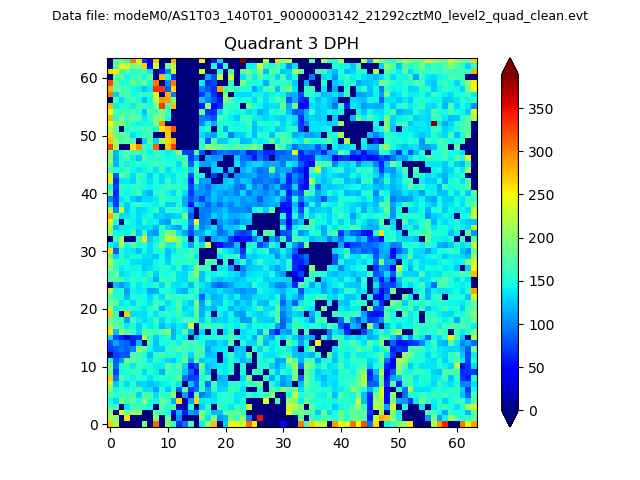 |
 |
Quadrant C |
| Plot type | Count rate plots | Images |
|---|---|---|
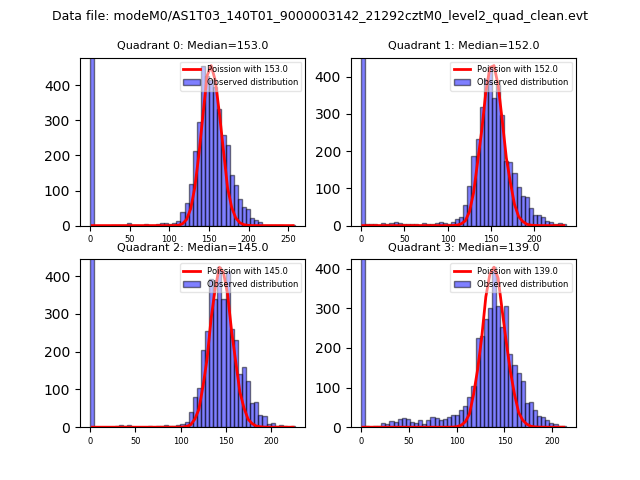
| Comparison with Poisson distribution Blue bars denote a histogram of data divided into 1 sec bins. Red curve is a Poisson curve with rate = median count rate of data. |
 |
 |
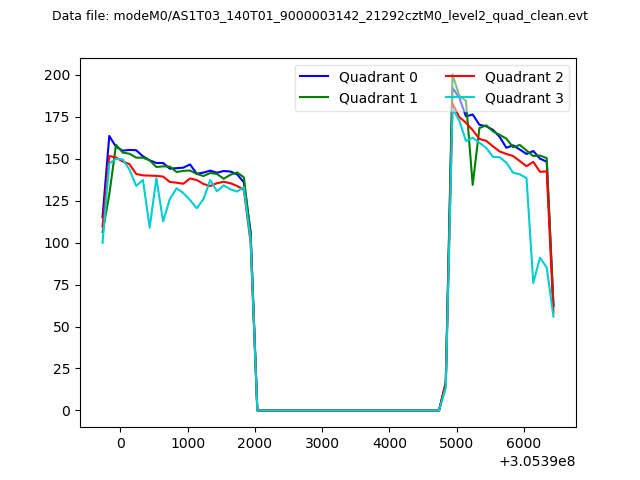
| Quadrant-wise count rates Data is divided into 100 sec bins |
 |
|
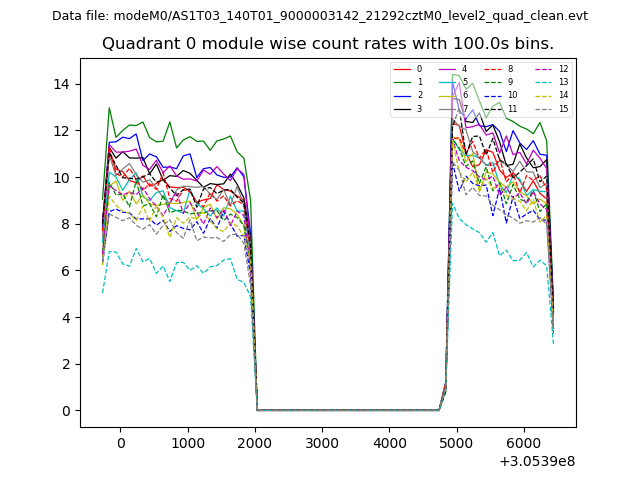
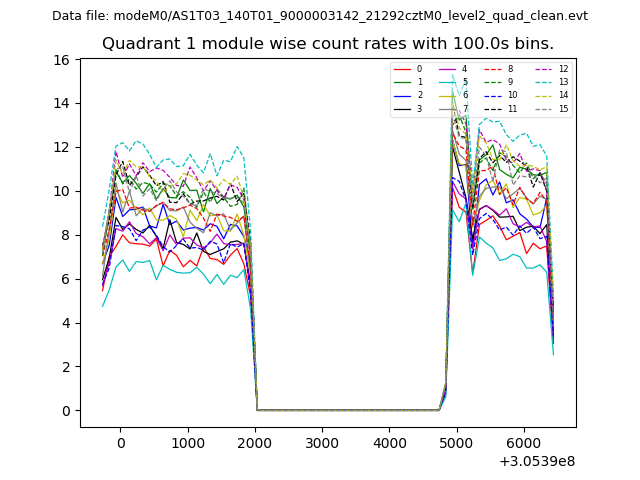
| Module-wise count rates for Quadrant A Data is divided into 100 sec bins |
 |
 |
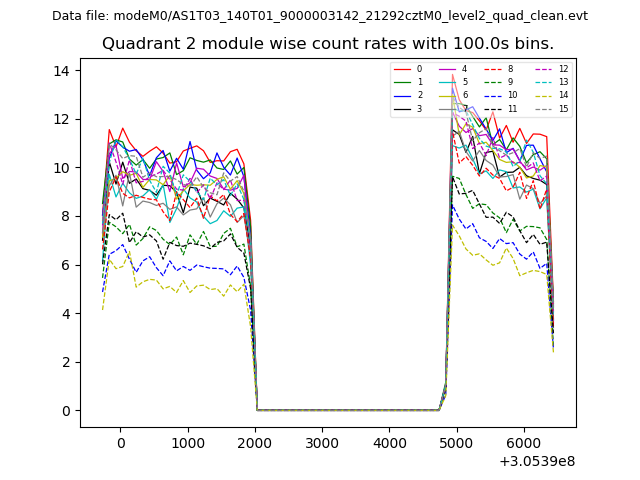
| Module-wise count rates for Quadrant B Data is divided into 100 sec bins |
 |
 |
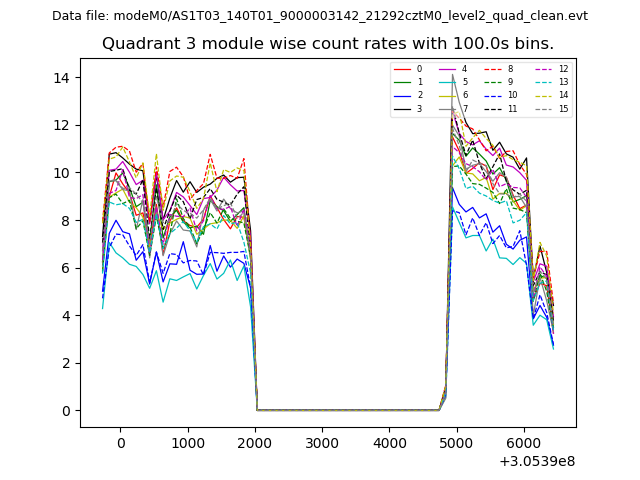
| Module-wise count rates for Quadrant C Data is divided into 100 sec bins |
 |
 |
| Module-wise count rates for Quadrant D Data is divided into 100 sec bins |
 |
 |
| Parameter | Plot |
|---|---|
| CZT HV Monitor | 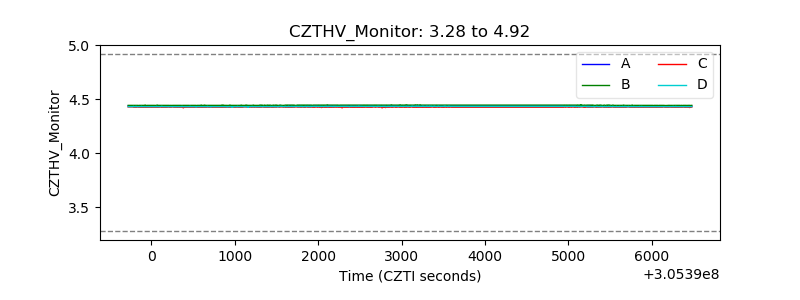 |
| D_VDD | 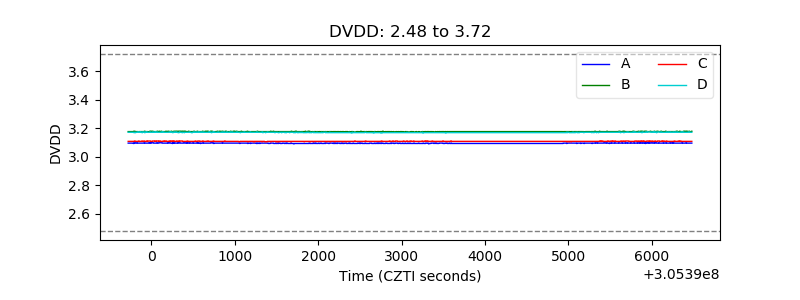 |
| Temperature 1 |  |
| Veto HV Monitor | 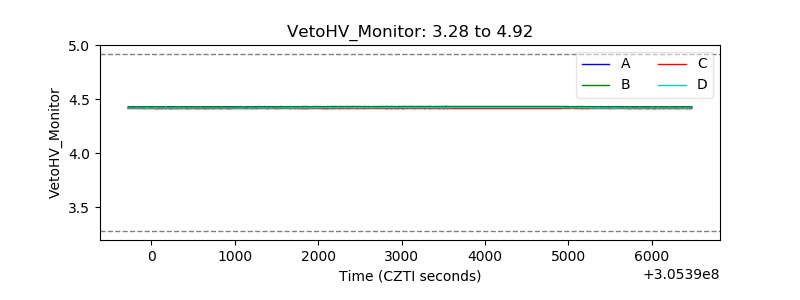 |
| Veto LLD | 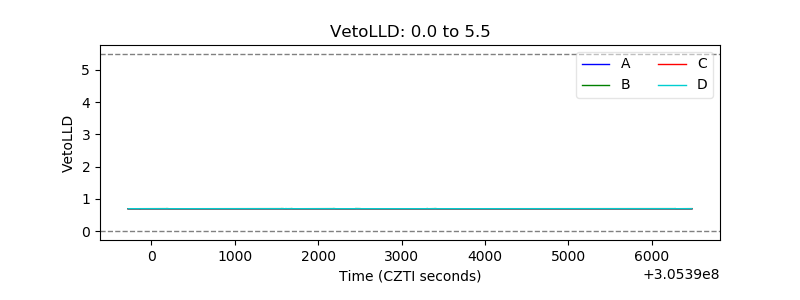 |
| Alpha Counter | 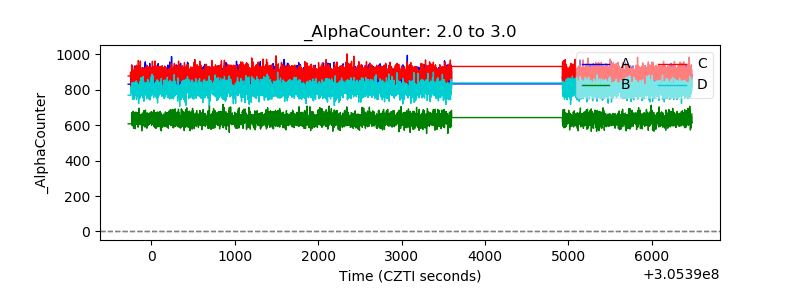 |
| _CPM_Rate | 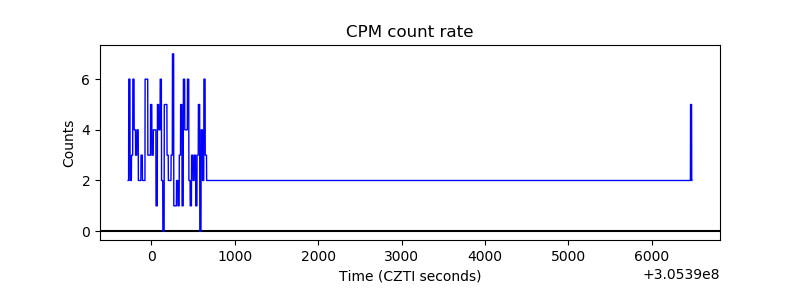 |
| CZT Counter | 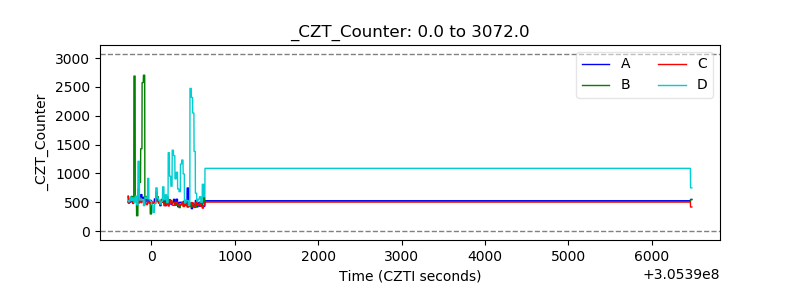 |
| +2.5 Volts monitor |  |
| +5 Volts monitor | 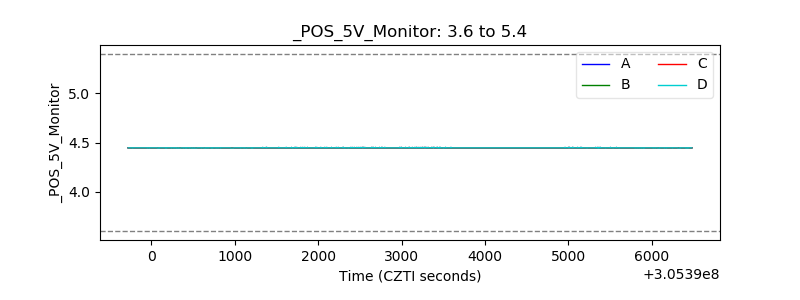 |
| _ROLL_ROT | 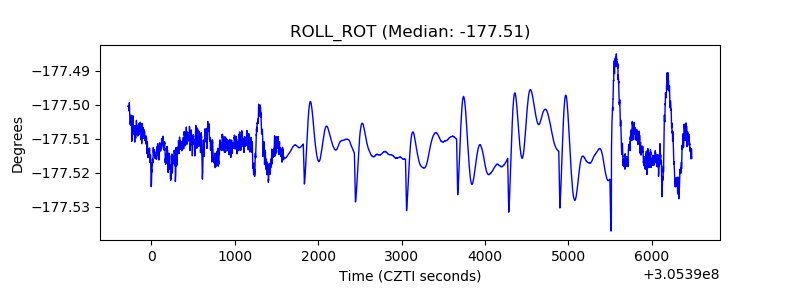 |
| _Roll_DEC | 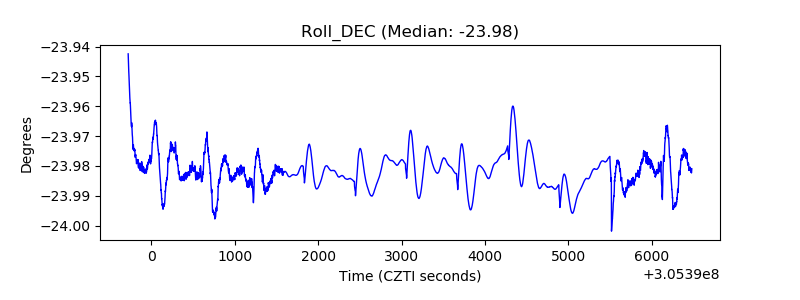 |
| _Roll_RA | 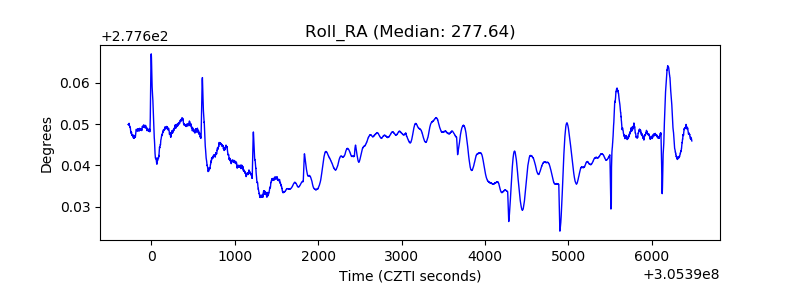 |
| Veto Counter | 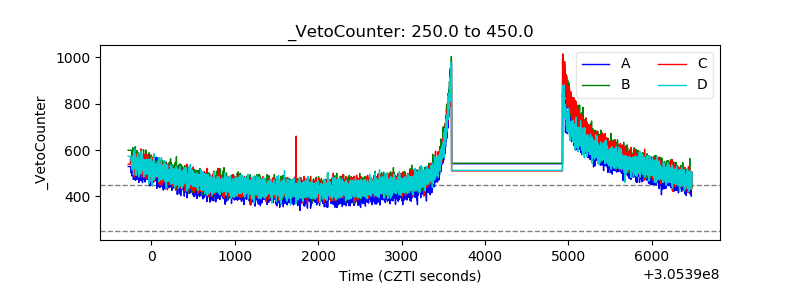 |