| Param | Original file | Final file |
|---|---|---|
| Filename | modeM0/AS1T03_140T01_9000003142_21293cztM0_level2.evt | modeM0/AS1T03_140T01_9000003142_21293cztM0_level2_quad_clean.evt |
| Size (bytes) | 857,113,920 | 153,832,320 |
| Size | 817.4 MB | 146.7 MB |
| Events in quadrant A | 5,385,661 | 1,028,513 |
| Events in quadrant B | 5,716,586 | 1,022,708 |
| Events in quadrant C | 5,221,816 | 983,195 |
| Events in quadrant D | 8,929,484 | 903,253 |
| Mode M0 | |||
|---|---|---|---|
| Quadrant | BADHDUFLAG | Total packets | Discarded packets |
| A | 0 | 22545 | 3 |
| B | 0 | 23518 | 3 |
| C | 0 | 22020 | 3 |
| D | 0 | 33583 | 3 |
| Mode M9 | |||
|---|---|---|---|
| Quadrant | BADHDUFLAG | Total packets | Discarded packets |
| A | 0 | 25 | 0 |
| B | 0 | 25 | 0 |
| C | 0 | 25 | 0 |
| D | 0 | 25 | 0 |
| Mode SS | |||
|---|---|---|---|
| Quadrant | BADHDUFLAG | Total packets | Discarded packets |
| A | 0 | 216 | 0 |
| B | 0 | 216 | 0 |
| C | 0 | 216 | 0 |
| D | 0 | 216 | 0 |
| Quadrant | Total seconds | Saturated seconds | Saturation percentage |
|---|---|---|---|
| A | 10403 | 192 | 1.845621% |
| B | 10403 | 293 | 2.816495% |
| C | 10402 | 245 | 2.355316% |
| D | 10402 | 972 | 9.344357% |
Noise dominated data is calculated using 1-second bins in cleaned event files. If a bin has >2000 counts, and if more than 50% of those come from <1% of pixels, then it is considered to be noise-dominated and hence unusable.
| Quadrant | # 1 sec bins | Bins with >0 counts | Bins with >2000 counts | High rate bins dominated by noise | Noise dominated (total time) | Noise dominated (detector-on time) | Marked lightcurve |
|---|---|---|---|---|---|---|---|
| A | 13038 | 10404 | 15 | 15 | 0.12% | 0.14% | 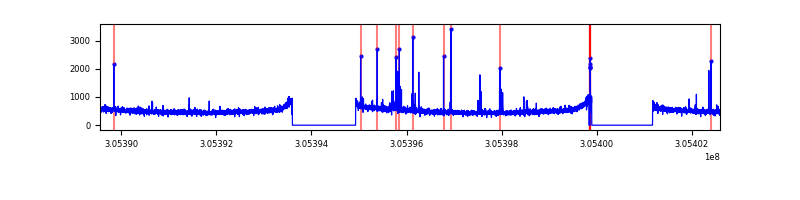 |
| B | 13038 | 10404 | 88 | 88 | 0.67% | 0.85% | 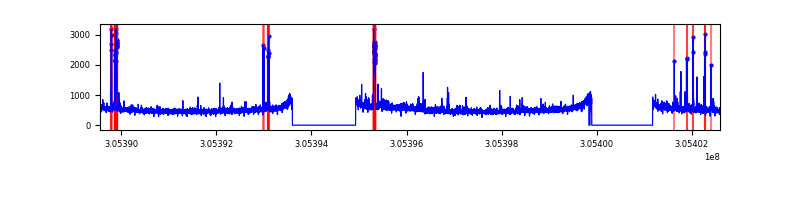 |
| C | 13037 | 10403 | 0 | 0 | 0.00% | 0.00% | 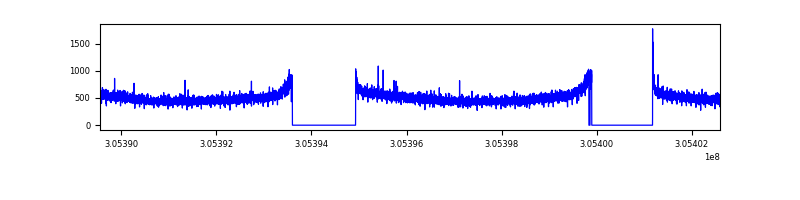 |
| D | 13037 | 10403 | 872 | 872 | 6.69% | 8.38% |  |
Top three noisy pixels from each quadrant. If the there are fewer than three noisy pixels in the level2.evt file, extra rows are filled as -1
| Pixel properties | Quadrant properties | ||||||
|---|---|---|---|---|---|---|---|
| Quadrant | DetID | PixID | Counts | Sigma | Mean | Median | Sigma |
| A | 5 | 16 | 66819 | 241.65 | 1361 | 1338 | 271.0 |
| A | 15 | 236 | 35474 | 125.97 | 1361 | 1338 | 271.0 |
| A | 9 | 143 | 33872 | 120.06 | 1361 | 1338 | 271.0 |
| B | 3 | 64 | 202821 | 803.72 | 1340 | 1312 | 250.7 |
| B | 0 | 189 | 162080 | 641.22 | 1340 | 1312 | 250.7 |
| B | 0 | 229 | 32745 | 125.37 | 1340 | 1312 | 250.7 |
| C | 14 | 238 | 205565 | 693.66 | 1278 | 1289 | 294.5 |
| C | 3 | 233 | 23428 | 75.18 | 1278 | 1289 | 294.5 |
| C | 0 | 10 | 13408 | 41.15 | 1278 | 1289 | 294.5 |
| D | 7 | 38 | 2924949 | 9500.96 | 1270 | 1234 | 307.7 |
| D | 1 | 52 | 530464 | 1719.8 | 1270 | 1234 | 307.7 |
| D | 12 | 235 | 242499 | 784.02 | 1270 | 1234 | 307.7 |
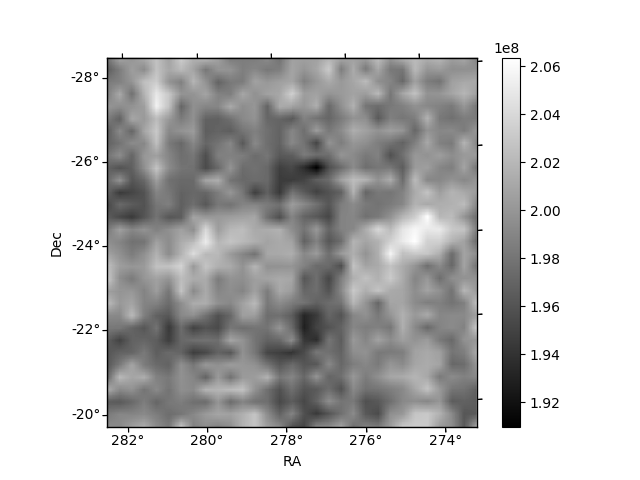
Histogram calculated using DETX and DETY for each event in the final _common_clean file
| Quadrant A |  |
 |
Quadrant B |
|---|---|---|---|
| Quadrant D | 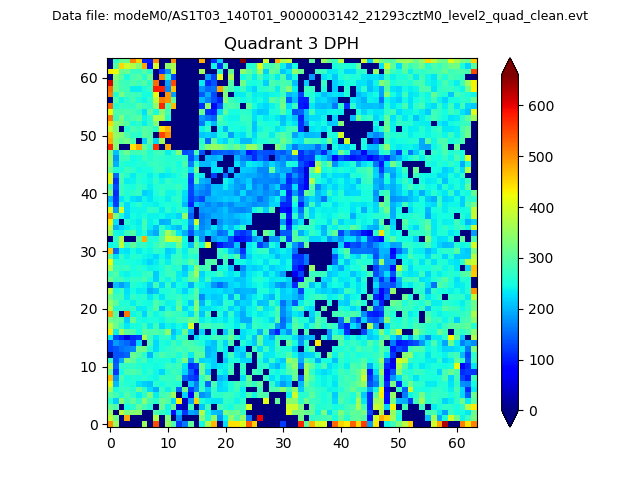 |
 |
Quadrant C |
| Plot type | Count rate plots | Images |
|---|---|---|
| Comparison with Poisson distribution Blue bars denote a histogram of data divided into 1 sec bins. Red curve is a Poisson curve with rate = median count rate of data. |
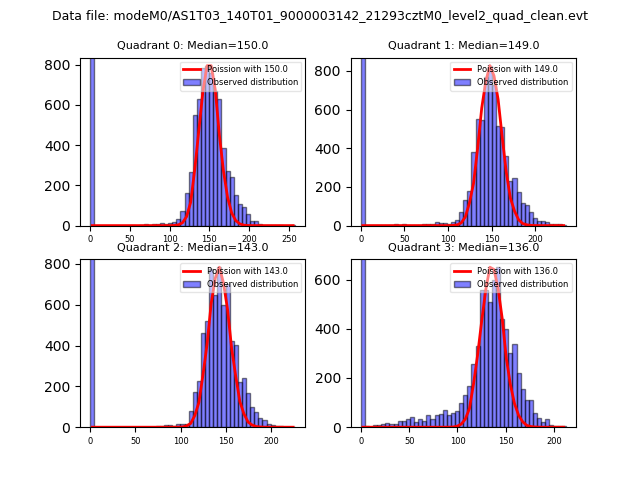 |
 |
| Quadrant-wise count rates Data is divided into 100 sec bins |
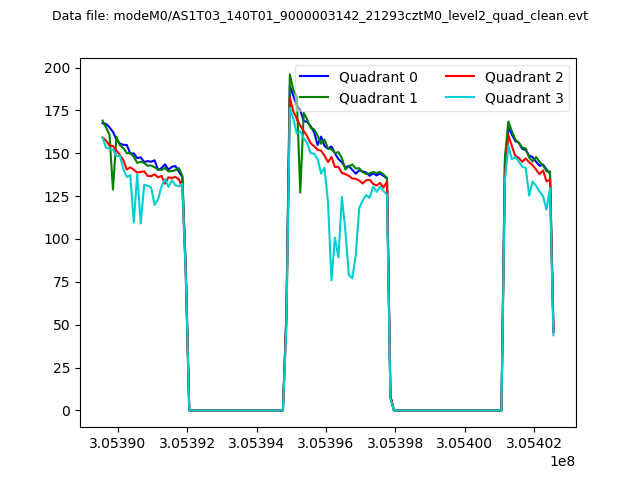 |
|
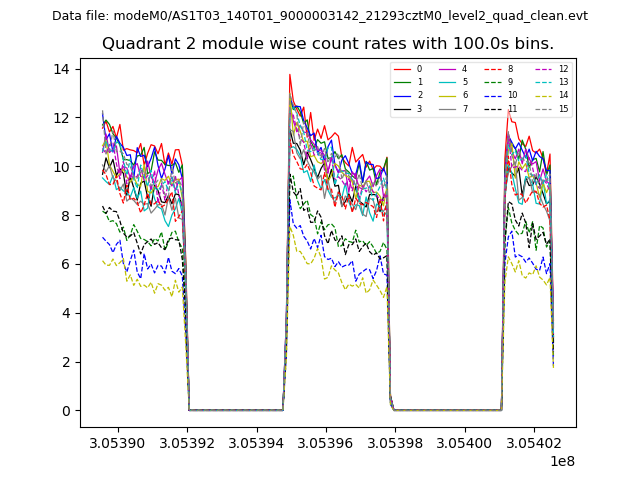
| Module-wise count rates for Quadrant A Data is divided into 100 sec bins |
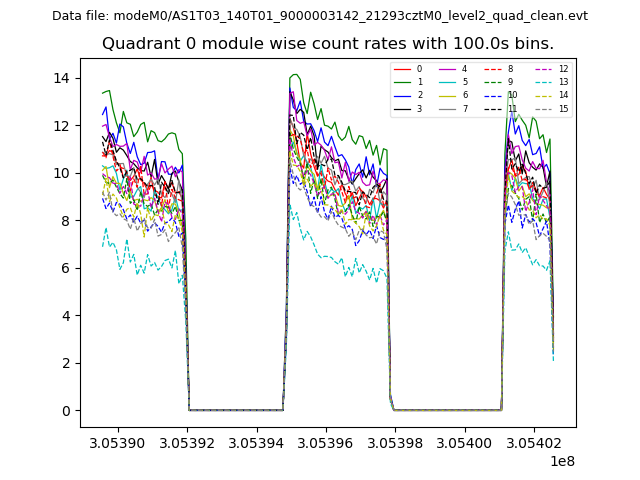 |
 |
| Module-wise count rates for Quadrant B Data is divided into 100 sec bins |
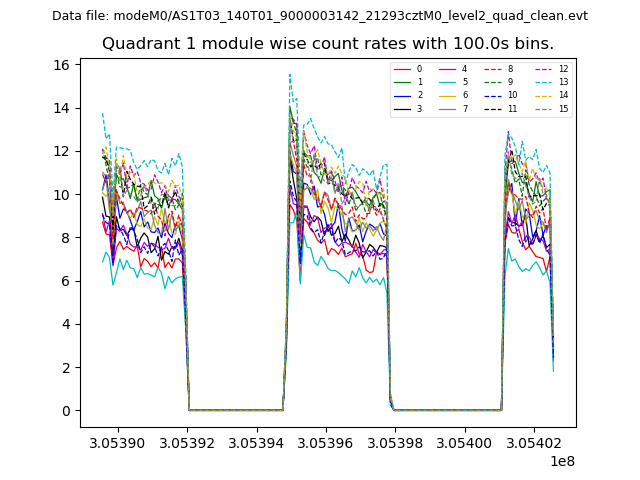 |
 |
| Module-wise count rates for Quadrant C Data is divided into 100 sec bins |
 |
 |
| Module-wise count rates for Quadrant D Data is divided into 100 sec bins |
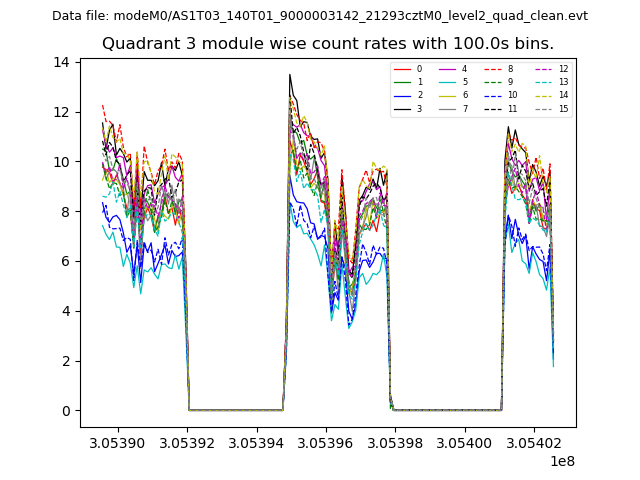 |
 |
| Parameter | Plot |
|---|---|
| CZT HV Monitor | 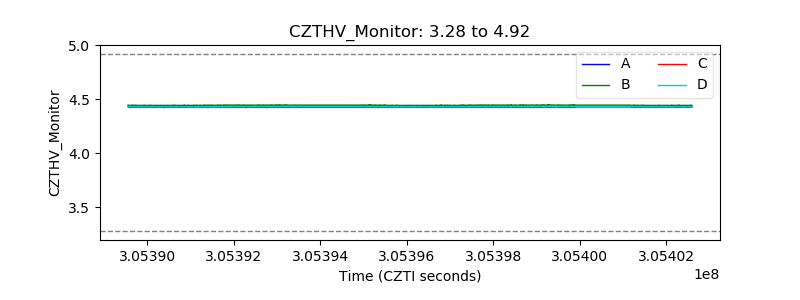 |
| D_VDD | 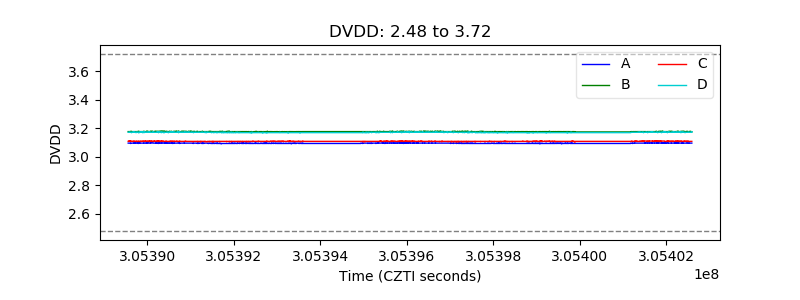 |
| Temperature 1 | 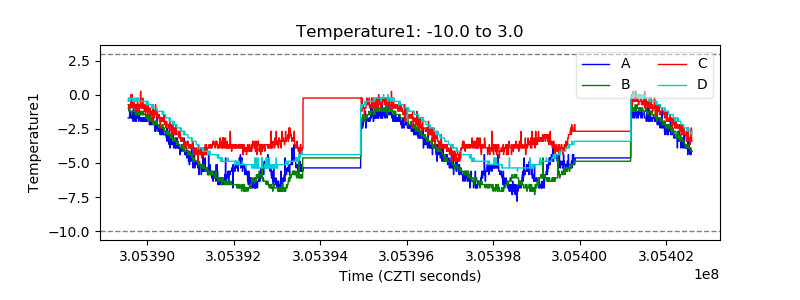 |
| Veto HV Monitor | 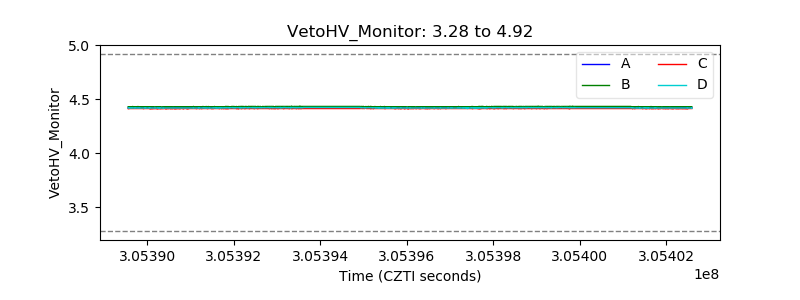 |
| Veto LLD | 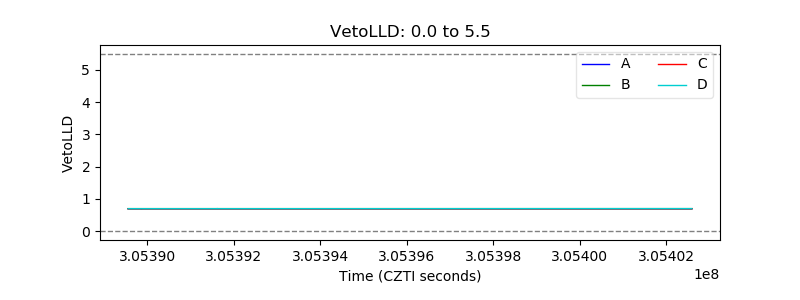 |
| Alpha Counter | 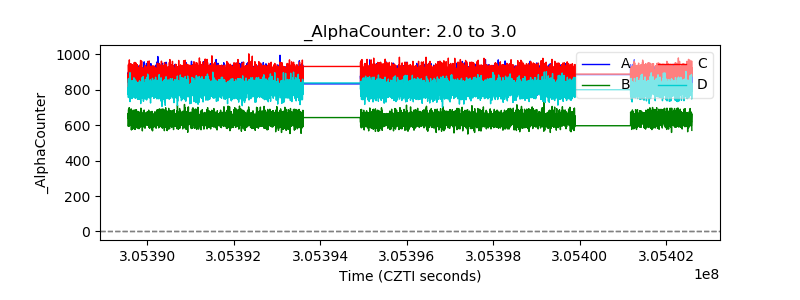 |
| _CPM_Rate | 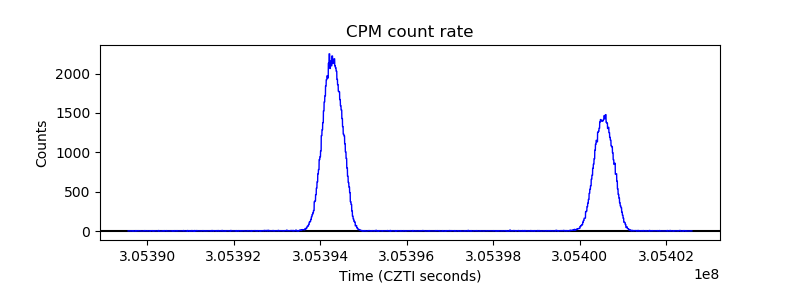 |
| CZT Counter |  |
| +2.5 Volts monitor |  |
| +5 Volts monitor |  |
| _ROLL_ROT | 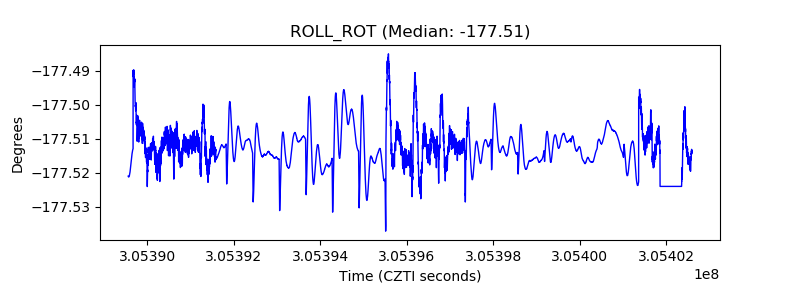 |
| _Roll_DEC | 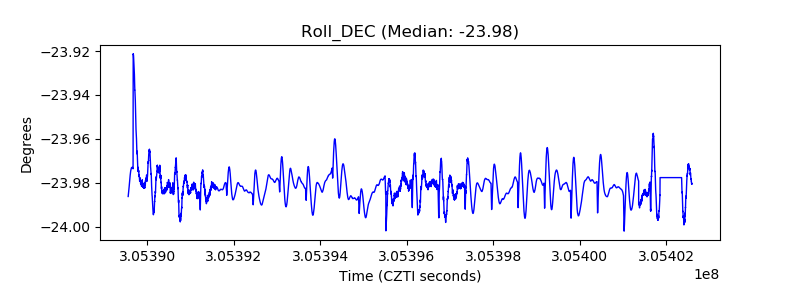 |
| _Roll_RA | 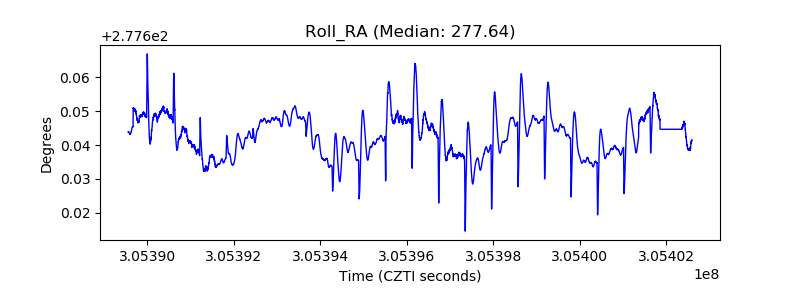 |
| Veto Counter | 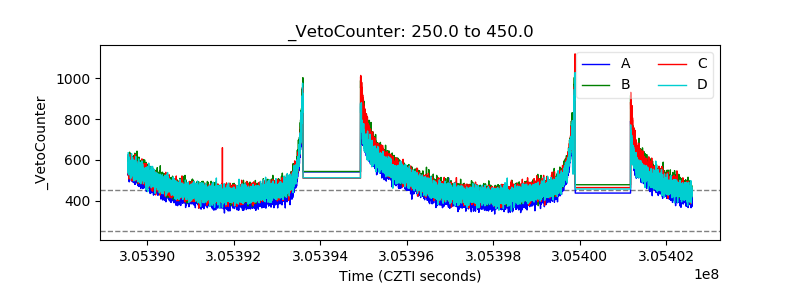 |