| Param | Original file | Final file |
|---|---|---|
| Filename | modeM0/AS1T03_140T01_9000003142_21294cztM0_level2.evt | modeM0/AS1T03_140T01_9000003142_21294cztM0_level2_quad_clean.evt |
| Size (bytes) | 493,565,760 | 90,288,000 |
| Size | 470.7 MB | 86.1 MB |
| Events in quadrant A | 3,179,455 | 588,363 |
| Events in quadrant B | 3,353,817 | 595,023 |
| Events in quadrant C | 3,284,079 | 569,412 |
| Events in quadrant D | 4,701,434 | 540,330 |
| Mode M0 | |||
|---|---|---|---|
| Quadrant | BADHDUFLAG | Total packets | Discarded packets |
| A | 0 | 13492 | 2 |
| B | 0 | 14013 | 2 |
| C | 0 | 13890 | 2 |
| D | 0 | 18381 | 3 |
| Mode M9 | |||
|---|---|---|---|
| Quadrant | BADHDUFLAG | Total packets | Discarded packets |
| A | 0 | 12 | 0 |
| B | 0 | 13 | 0 |
| C | 0 | 13 | 0 |
| D | 0 | 13 | 0 |
| Mode SS | |||
|---|---|---|---|
| Quadrant | BADHDUFLAG | Total packets | Discarded packets |
| A | 0 | 128 | 0 |
| B | 0 | 128 | 0 |
| C | 0 | 128 | 0 |
| D | 0 | 128 | 0 |
| Quadrant | Total seconds | Saturated seconds | Saturation percentage |
|---|---|---|---|
| A | 6322 | 51 | 0.806707% |
| B | 6322 | 78 | 1.233787% |
| C | 6322 | 108 | 1.708320% |
| D | 6321 | 263 | 4.160734% |
Noise dominated data is calculated using 1-second bins in cleaned event files. If a bin has >2000 counts, and if more than 50% of those come from <1% of pixels, then it is considered to be noise-dominated and hence unusable.
| Quadrant | # 1 sec bins | Bins with >0 counts | Bins with >2000 counts | High rate bins dominated by noise | Noise dominated (total time) | Noise dominated (detector-on time) | Marked lightcurve |
|---|---|---|---|---|---|---|---|
| A | 7447 | 6322 | 3 | 3 | 0.04% | 0.05% | 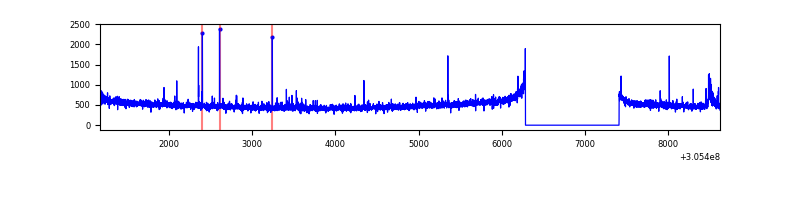 |
| B | 7447 | 6322 | 11 | 11 | 0.15% | 0.17% | 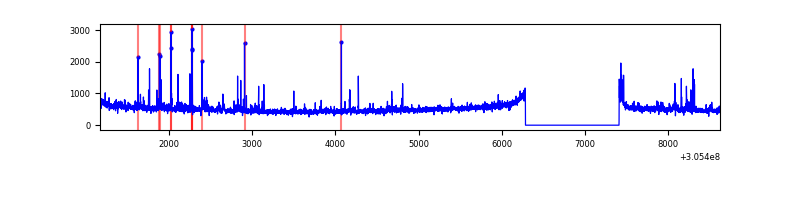 |
| C | 7447 | 6323 | 0 | 0 | 0.00% | 0.00% | 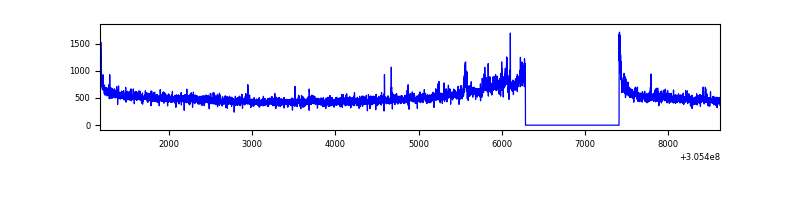 |
| D | 7446 | 6322 | 255 | 255 | 3.42% | 4.03% | 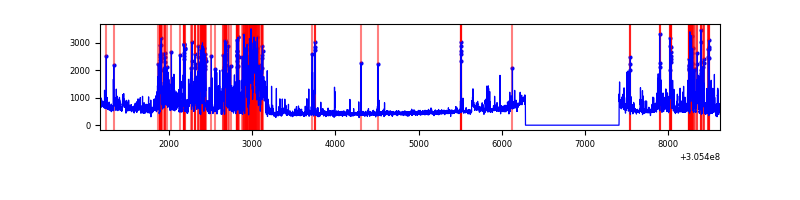 |
Top three noisy pixels from each quadrant. If the there are fewer than three noisy pixels in the level2.evt file, extra rows are filled as -1
| Pixel properties | Quadrant properties | ||||||
|---|---|---|---|---|---|---|---|
| Quadrant | DetID | PixID | Counts | Sigma | Mean | Median | Sigma |
| A | 9 | 143 | 52634 | 318.82 | 804 | 786 | 162.6 |
| A | 12 | 96 | 18340 | 107.94 | 804 | 786 | 162.6 |
| A | 13 | 254 | 9360 | 52.72 | 804 | 786 | 162.6 |
| B | 3 | 64 | 77448 | 503.02 | 799 | 781 | 152.4 |
| B | 0 | 190 | 74204 | 481.74 | 799 | 781 | 152.4 |
| B | 0 | 245 | 20643 | 130.32 | 799 | 781 | 152.4 |
| C | 3 | 233 | 187328 | 1052.64 | 758 | 764 | 177.2 |
| C | 14 | 238 | 120580 | 676.03 | 758 | 764 | 177.2 |
| C | 0 | 10 | 21832 | 118.87 | 758 | 764 | 177.2 |
| D | 7 | 38 | 1371584 | 7351.81 | 761 | 740 | 186.5 |
| D | 1 | 52 | 146196 | 780.08 | 761 | 740 | 186.5 |
| D | 12 | 235 | 74512 | 395.64 | 761 | 740 | 186.5 |
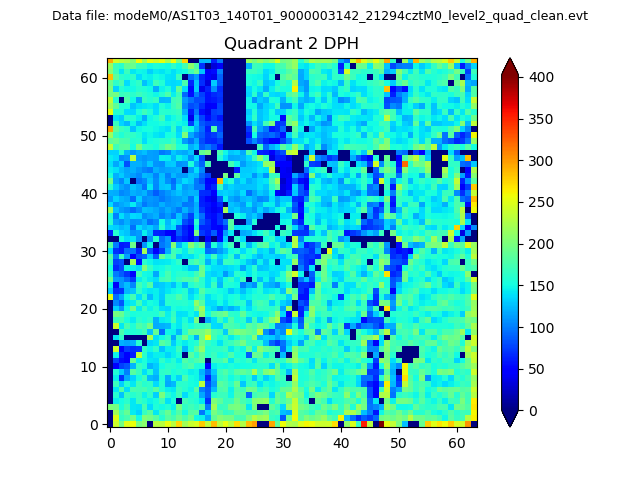
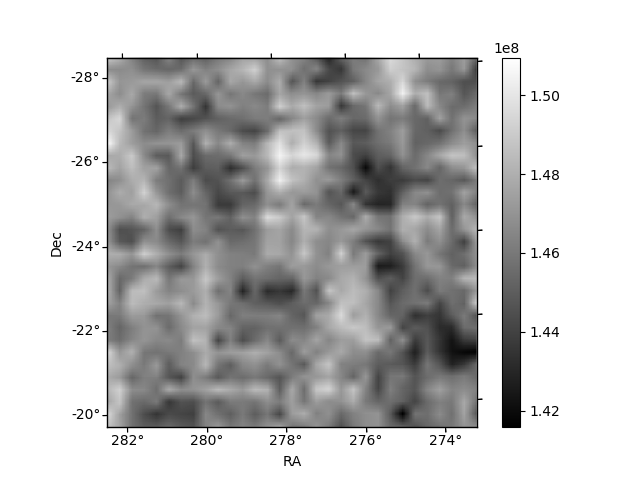
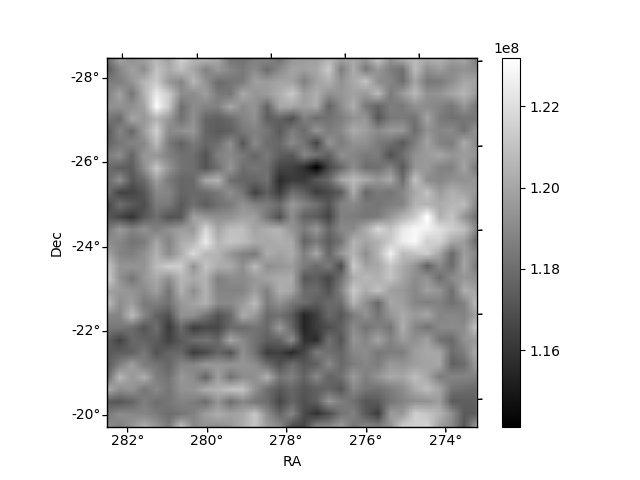
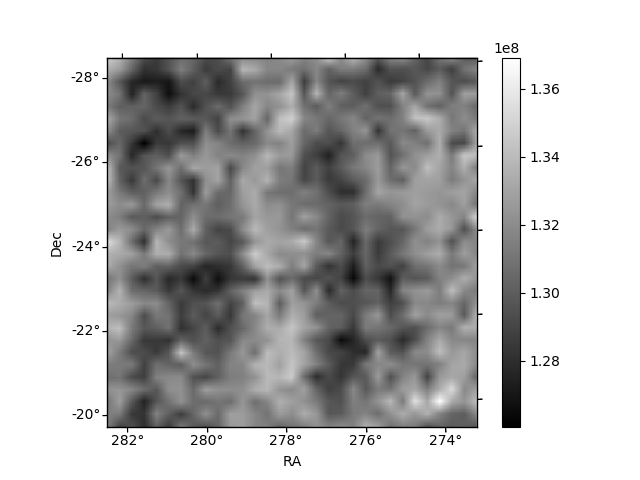
Histogram calculated using DETX and DETY for each event in the final _common_clean file
| Quadrant A | 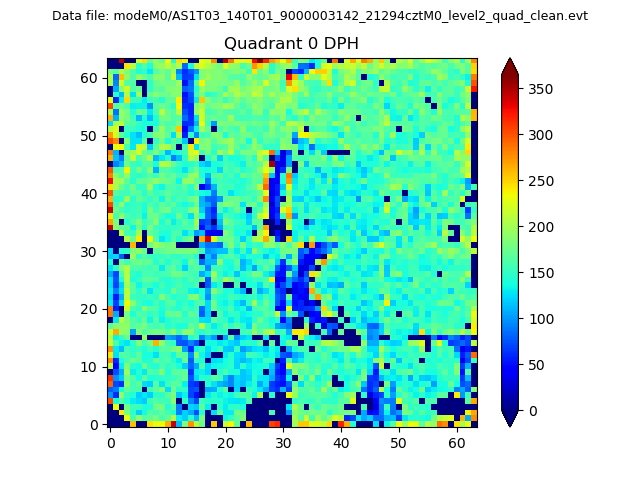 |
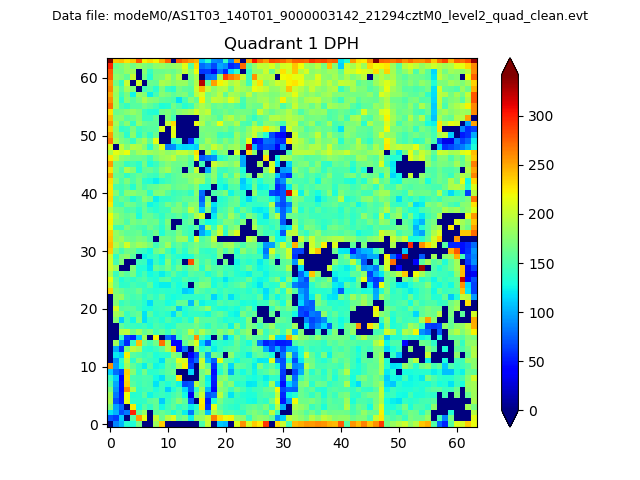 |
Quadrant B |
|---|---|---|---|
| Quadrant D | 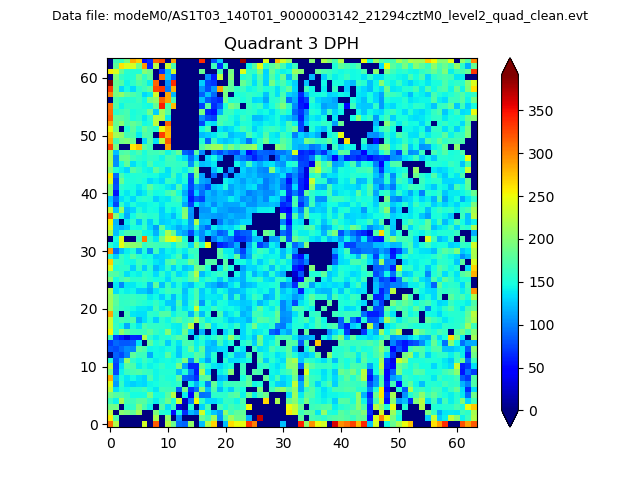 |
 |
Quadrant C |
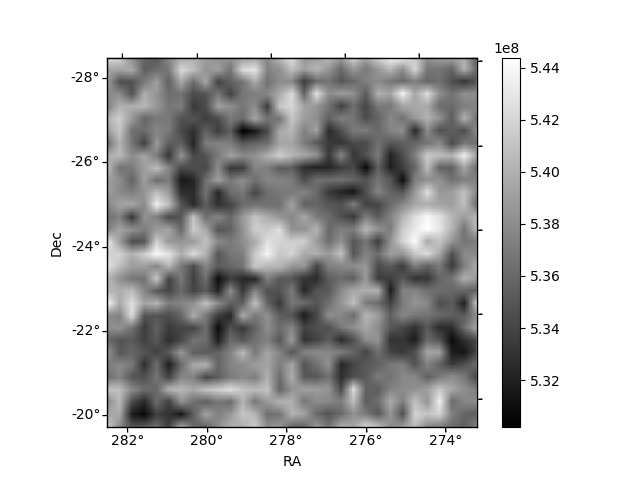
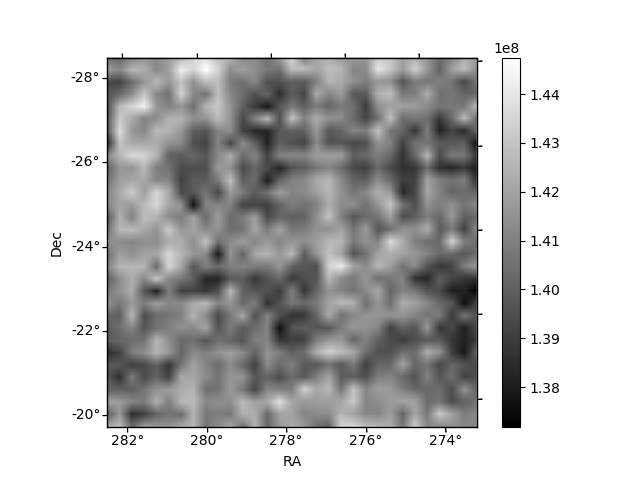
| Plot type | Count rate plots | Images |
|---|---|---|
| Comparison with Poisson distribution Blue bars denote a histogram of data divided into 1 sec bins. Red curve is a Poisson curve with rate = median count rate of data. |
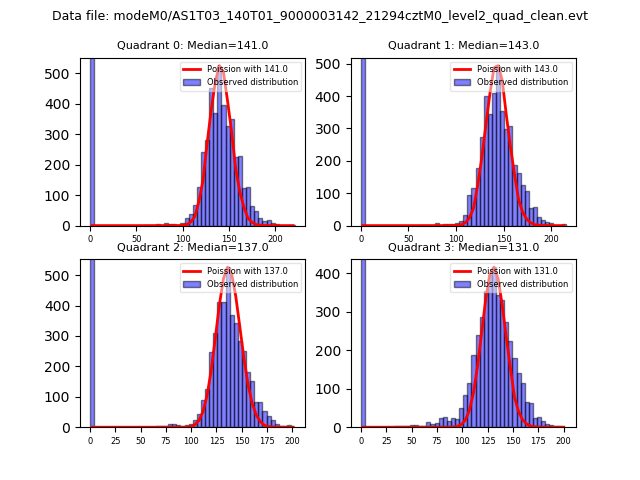 |
 |
| Quadrant-wise count rates Data is divided into 100 sec bins |
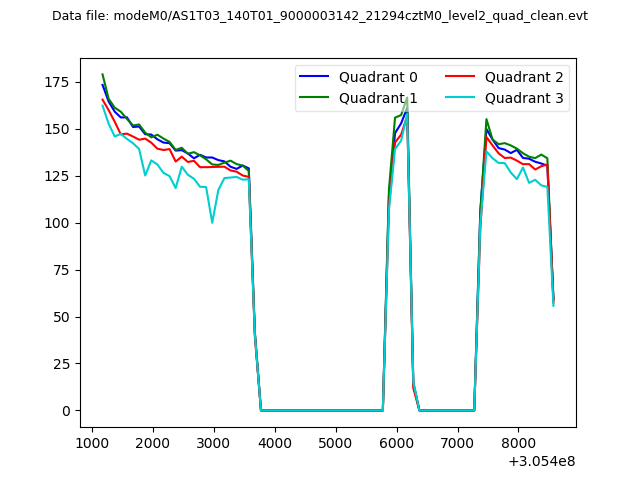 |
|
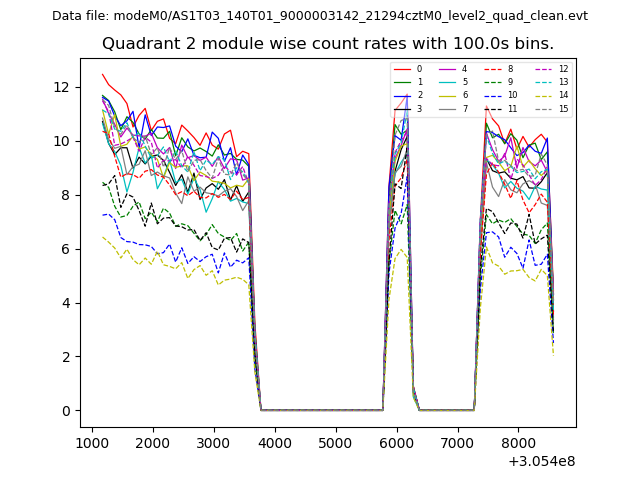
| Module-wise count rates for Quadrant A Data is divided into 100 sec bins |
 |
 |
| Module-wise count rates for Quadrant B Data is divided into 100 sec bins |
 |
 |
| Module-wise count rates for Quadrant C Data is divided into 100 sec bins |
 |
 |
| Module-wise count rates for Quadrant D Data is divided into 100 sec bins |
 |
 |
| Parameter | Plot |
|---|---|
| CZT HV Monitor | 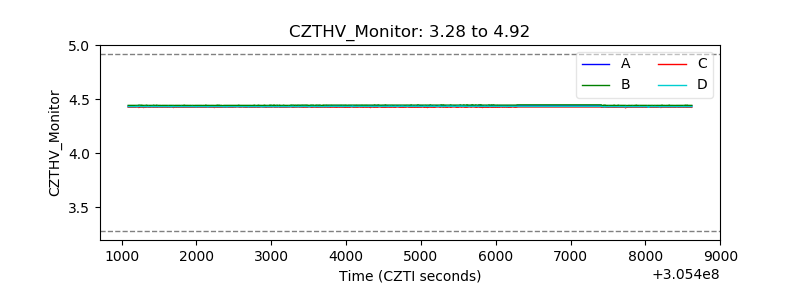 |
| D_VDD | 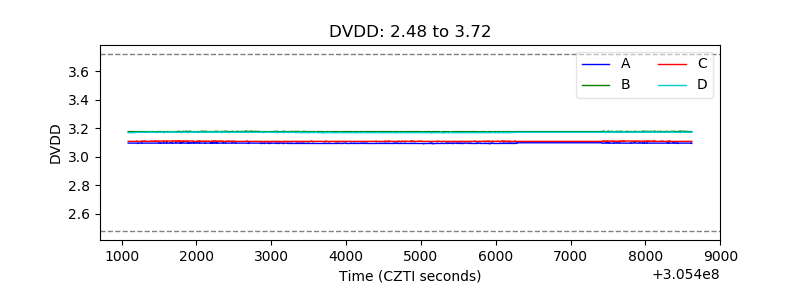 |
| Temperature 1 | 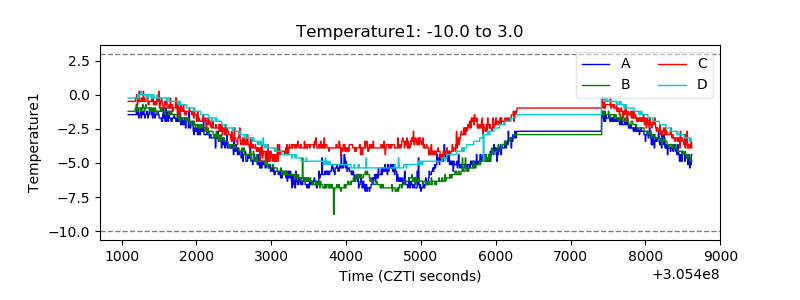 |
| Veto HV Monitor | 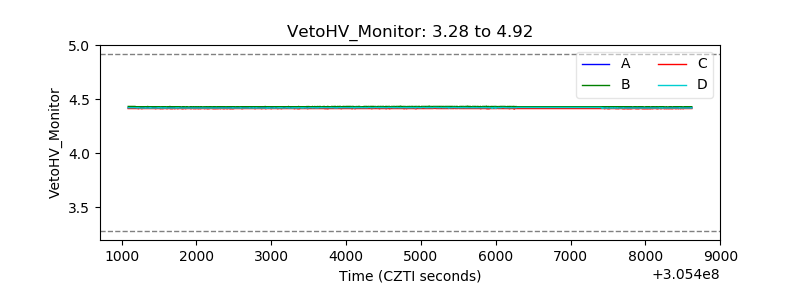 |
| Veto LLD |  |
| Alpha Counter | 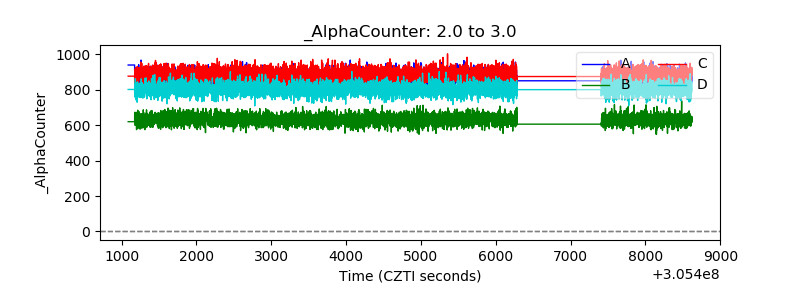 |
| _CPM_Rate | 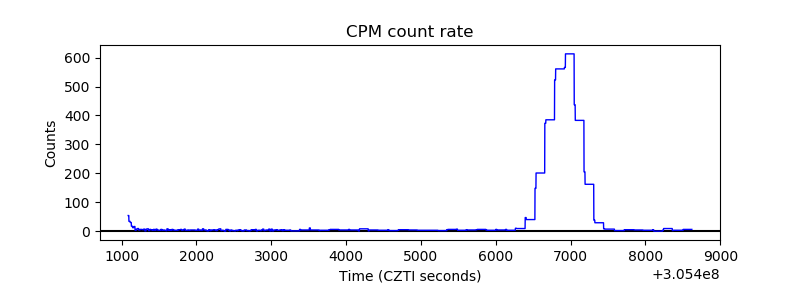 |
| CZT Counter | 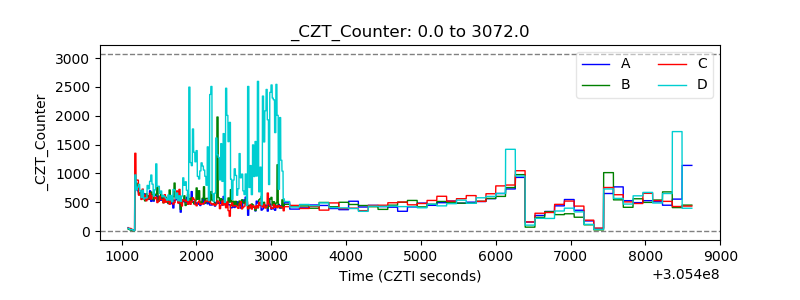 |
| +2.5 Volts monitor |  |
| +5 Volts monitor |  |
| _ROLL_ROT |  |
| _Roll_DEC | 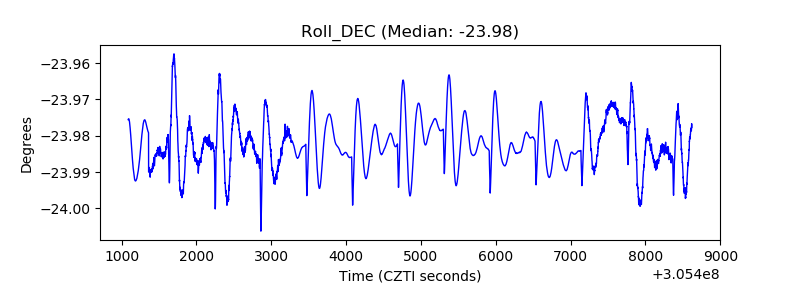 |
| _Roll_RA | 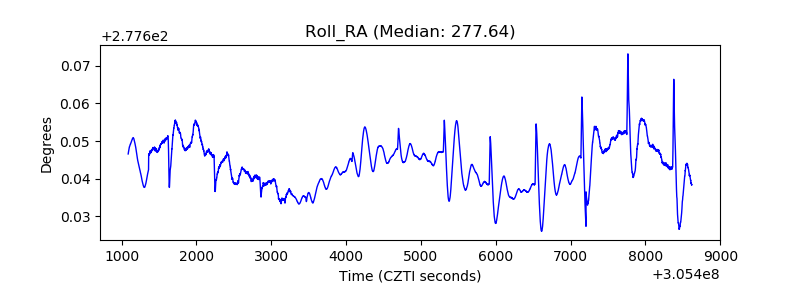 |
| Veto Counter | 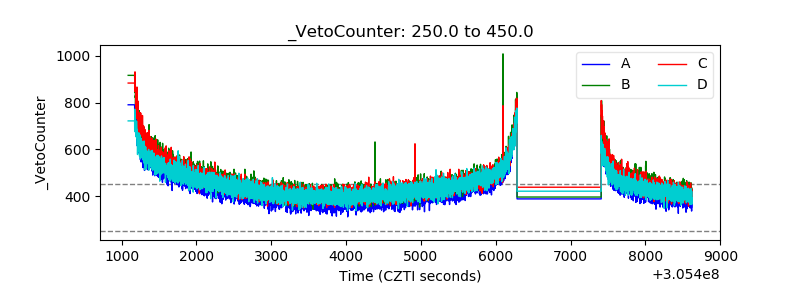 |