| Param | Original file | Final file |
|---|---|---|
| Filename | modeM0/AS1T03_140T01_9000003142_21295cztM0_level2.evt | modeM0/AS1T03_140T01_9000003142_21295cztM0_level2_quad_clean.evt |
| Size (bytes) | 573,586,560 | 95,333,760 |
| Size | 547.0 MB | 90.9 MB |
| Events in quadrant A | 3,447,864 | 627,378 |
| Events in quadrant B | 3,521,059 | 635,979 |
| Events in quadrant C | 3,690,442 | 613,155 |
| Events in quadrant D | 6,248,368 | 533,976 |
| Mode M0 | |||
|---|---|---|---|
| Quadrant | BADHDUFLAG | Total packets | Discarded packets |
| A | 0 | 14703 | 2 |
| B | 0 | 14858 | 2 |
| C | 0 | 15491 | 2 |
| D | 0 | 23295 | 2 |
| Mode M9 | |||
|---|---|---|---|
| Quadrant | BADHDUFLAG | Total packets | Discarded packets |
| A | 0 | 20 | 0 |
| B | 0 | 20 | 0 |
| C | 0 | 20 | 0 |
| D | 0 | 20 | 0 |
| Mode SS | |||
|---|---|---|---|
| Quadrant | BADHDUFLAG | Total packets | Discarded packets |
| A | 0 | 138 | 0 |
| B | 0 | 138 | 0 |
| C | 0 | 138 | 0 |
| D | 0 | 138 | 0 |
| Quadrant | Total seconds | Saturated seconds | Saturation percentage |
|---|---|---|---|
| A | 6843 | 67 | 0.979103% |
| B | 6844 | 112 | 1.636470% |
| C | 6844 | 146 | 2.133255% |
| D | 6844 | 969 | 14.158387% |
Noise dominated data is calculated using 1-second bins in cleaned event files. If a bin has >2000 counts, and if more than 50% of those come from <1% of pixels, then it is considered to be noise-dominated and hence unusable.
| Quadrant | # 1 sec bins | Bins with >0 counts | Bins with >2000 counts | High rate bins dominated by noise | Noise dominated (total time) | Noise dominated (detector-on time) | Marked lightcurve |
|---|---|---|---|---|---|---|---|
| A | 8708 | 6844 | 9 | 9 | 0.10% | 0.13% |  |
| B | 8709 | 6845 | 19 | 19 | 0.22% | 0.28% |  |
| C | 8709 | 6846 | 2 | 2 | 0.02% | 0.03% | 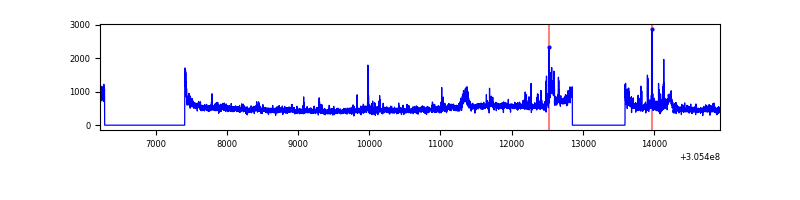 |
| D | 8709 | 6846 | 870 | 870 | 9.99% | 12.71% | 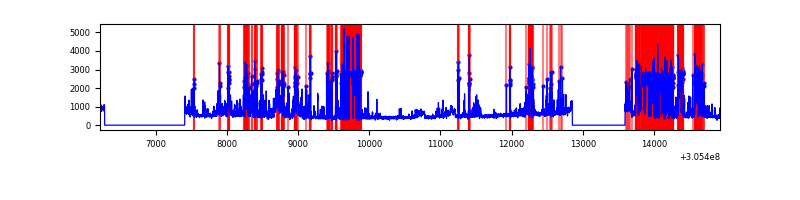 |
Top three noisy pixels from each quadrant. If the there are fewer than three noisy pixels in the level2.evt file, extra rows are filled as -1
| Pixel properties | Quadrant properties | ||||||
|---|---|---|---|---|---|---|---|
| Quadrant | DetID | PixID | Counts | Sigma | Mean | Median | Sigma |
| A | 9 | 143 | 158635 | 914.16 | 847 | 829 | 172.6 |
| A | 5 | 16 | 11503 | 61.83 | 847 | 829 | 172.6 |
| A | 13 | 254 | 9706 | 51.42 | 847 | 829 | 172.6 |
| B | 0 | 190 | 70277 | 424.93 | 844 | 823 | 163.4 |
| B | 3 | 64 | 65201 | 393.87 | 844 | 823 | 163.4 |
| B | 6 | 36 | 25465 | 150.76 | 844 | 823 | 163.4 |
| C | 3 | 233 | 420969 | 2214.22 | 803 | 809 | 189.8 |
| C | 14 | 238 | 125353 | 656.34 | 803 | 809 | 189.8 |
| C | 0 | 10 | 14624 | 72.8 | 803 | 809 | 189.8 |
| D | 1 | 52 | 2175946 | 11950.7 | 745 | 721 | 182.0 |
| D | 7 | 38 | 883667 | 4850.91 | 745 | 721 | 182.0 |
| D | 12 | 235 | 98889 | 539.34 | 745 | 721 | 182.0 |
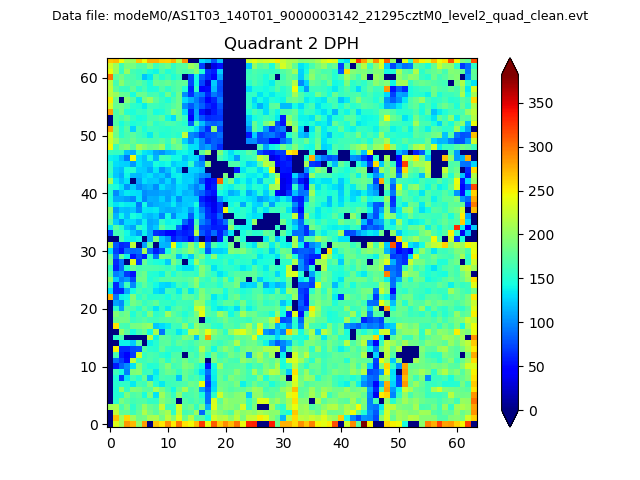
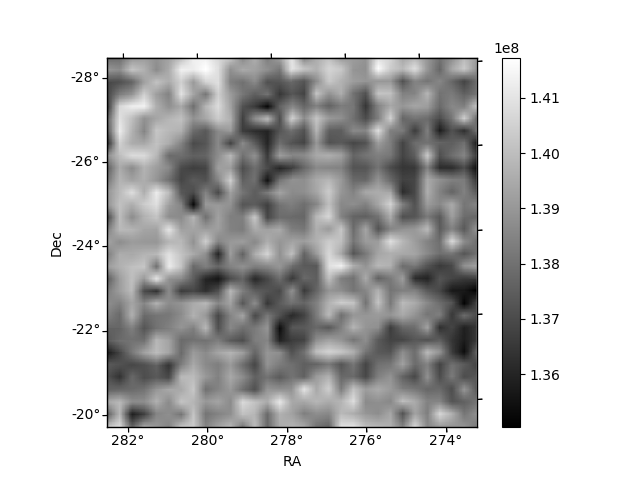
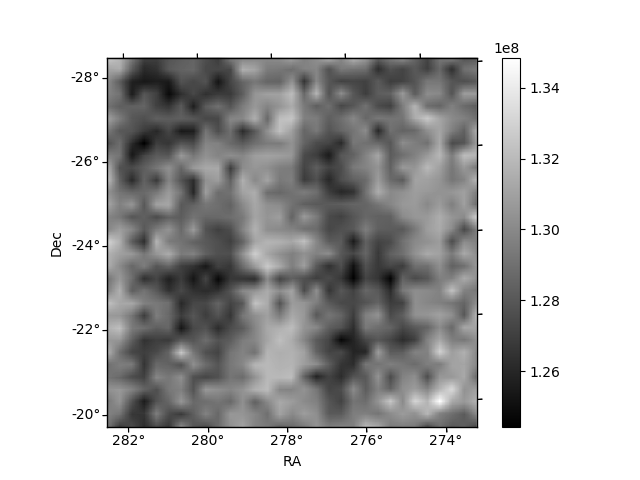
Histogram calculated using DETX and DETY for each event in the final _common_clean file
| Quadrant A | 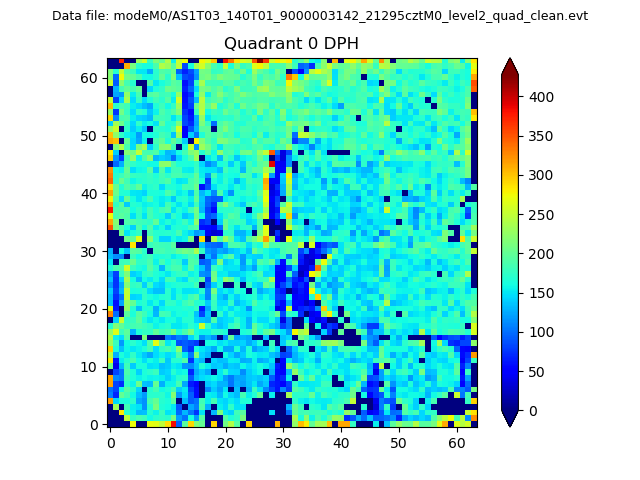 |
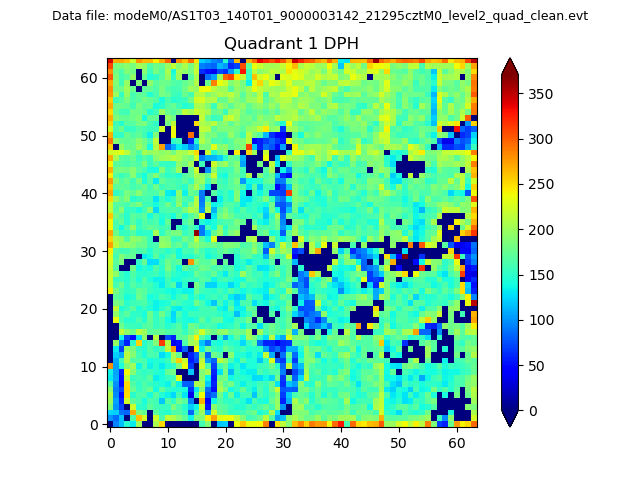 |
Quadrant B |
|---|---|---|---|
| Quadrant D | 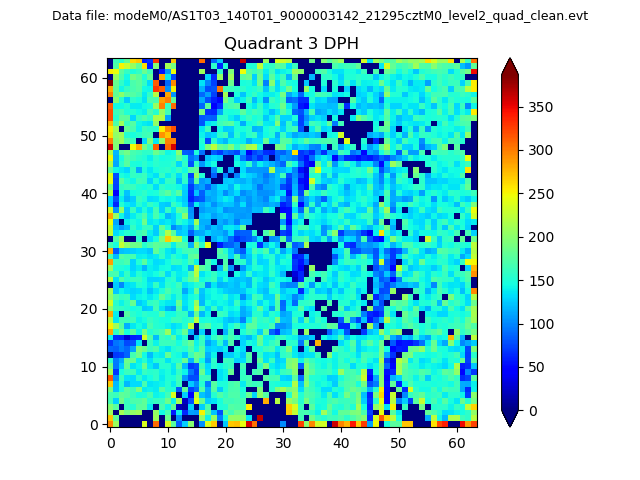 |
 |
Quadrant C |
| Plot type | Count rate plots | Images |
|---|---|---|
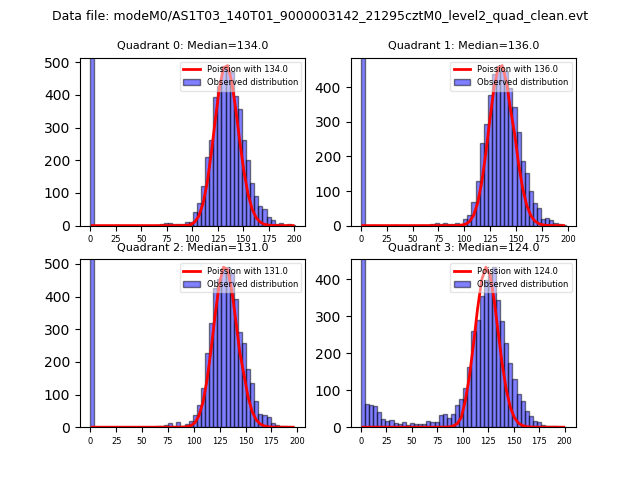
| Comparison with Poisson distribution Blue bars denote a histogram of data divided into 1 sec bins. Red curve is a Poisson curve with rate = median count rate of data. |
 |
 |
| Quadrant-wise count rates Data is divided into 100 sec bins |
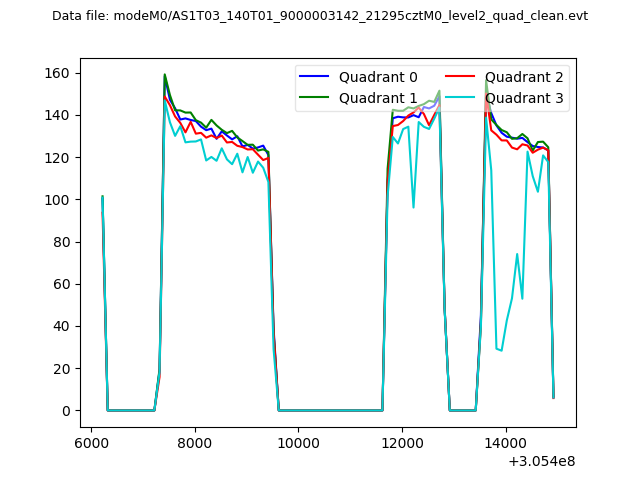 |
|
| Module-wise count rates for Quadrant A Data is divided into 100 sec bins |
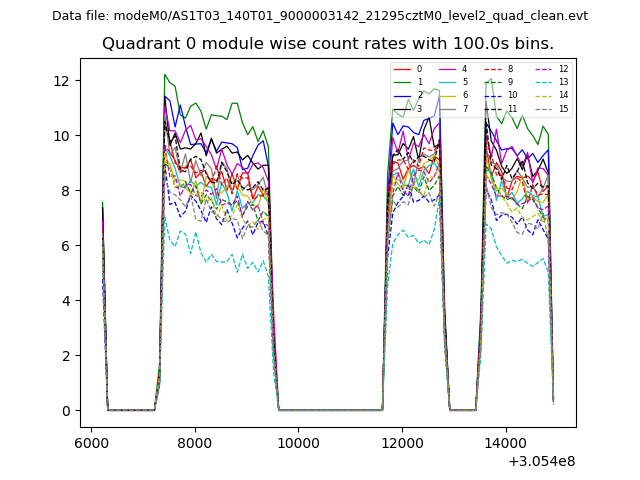 |
 |
| Module-wise count rates for Quadrant B Data is divided into 100 sec bins |
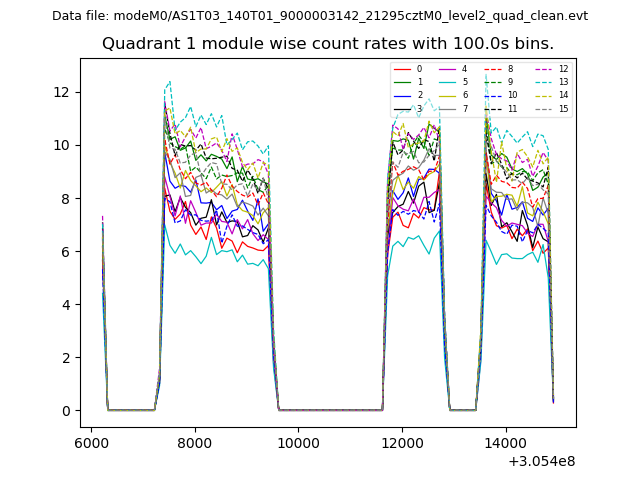 |
 |
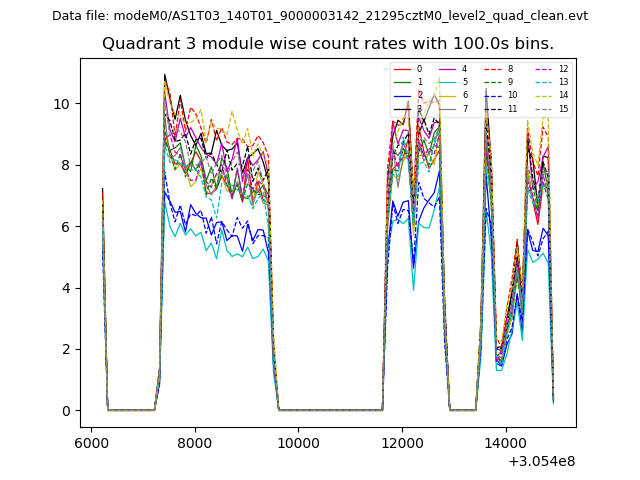
| Module-wise count rates for Quadrant C Data is divided into 100 sec bins |
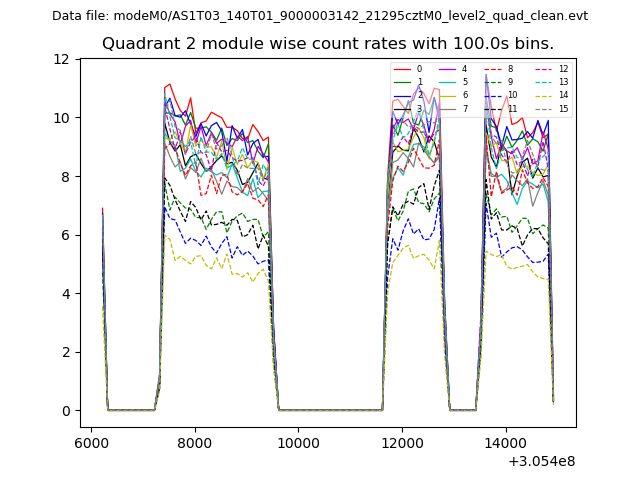 |
 |
| Module-wise count rates for Quadrant D Data is divided into 100 sec bins |
 |
 |
| Parameter | Plot |
|---|---|
| CZT HV Monitor | 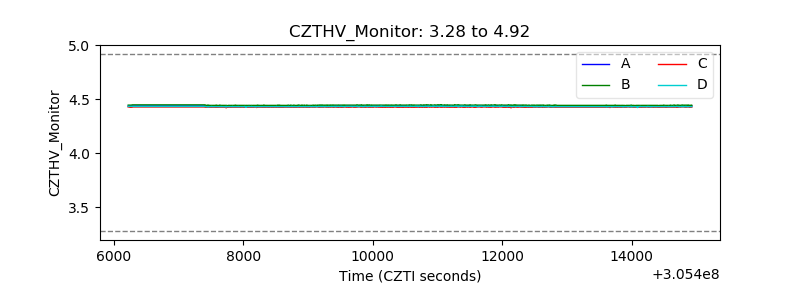 |
| D_VDD | 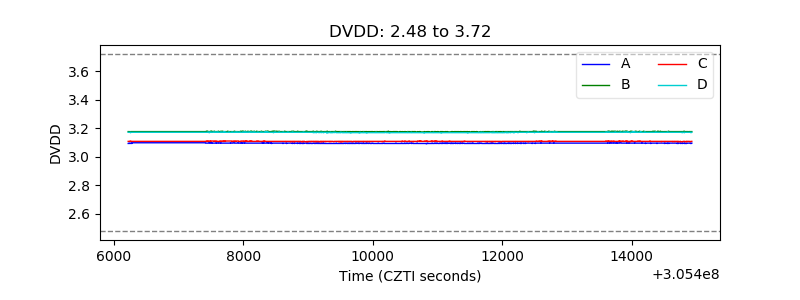 |
| Temperature 1 | 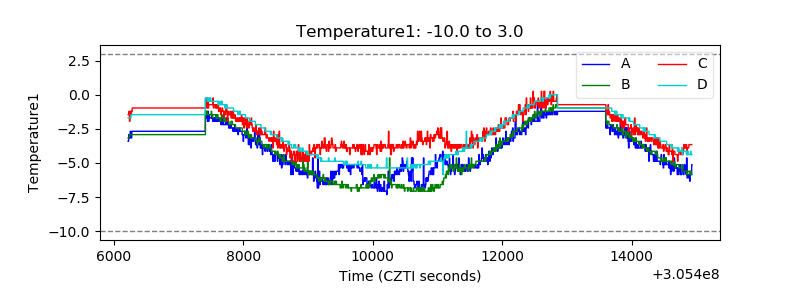 |
| Veto HV Monitor | 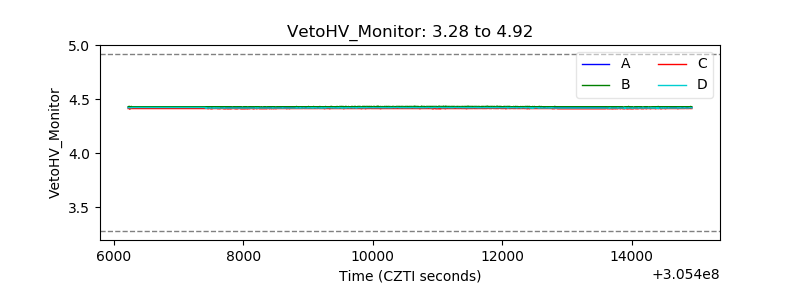 |
| Veto LLD | 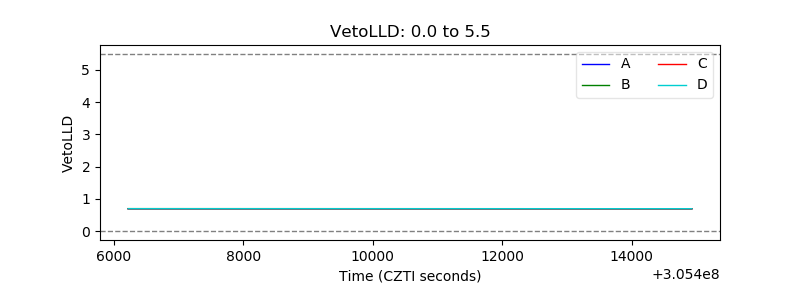 |
| Alpha Counter | 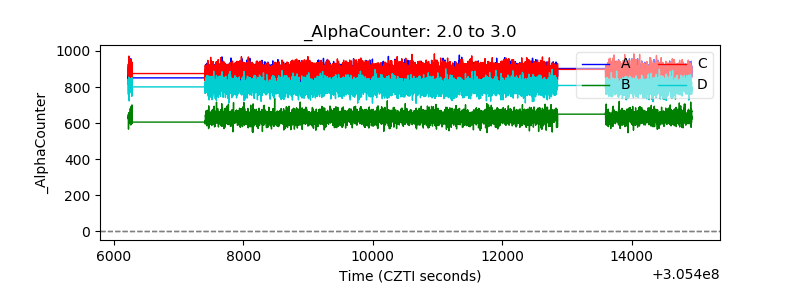 |
| _CPM_Rate | 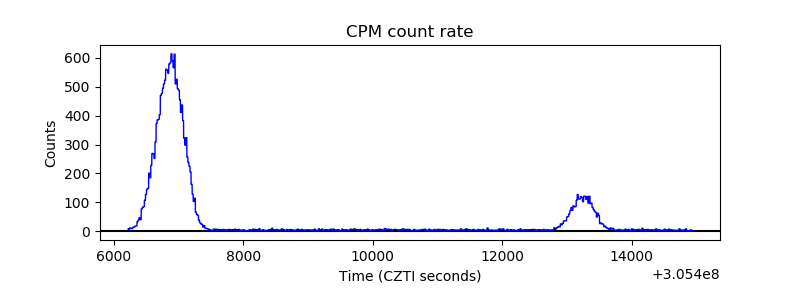 |
| CZT Counter | 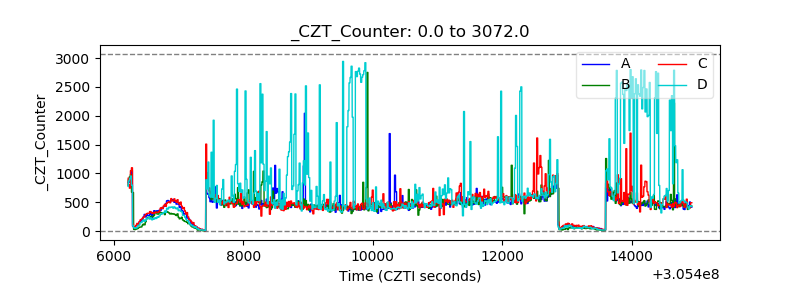 |
| +2.5 Volts monitor |  |
| +5 Volts monitor |  |
| _ROLL_ROT | 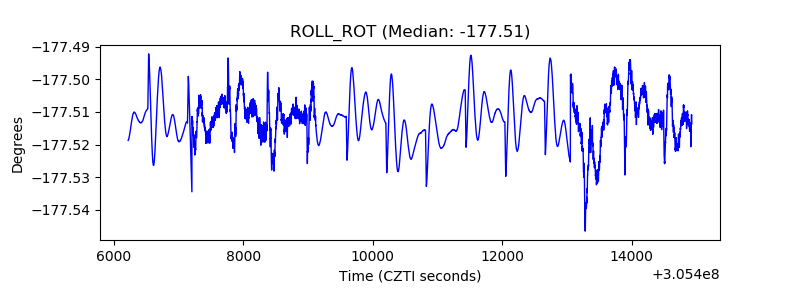 |
| _Roll_DEC | 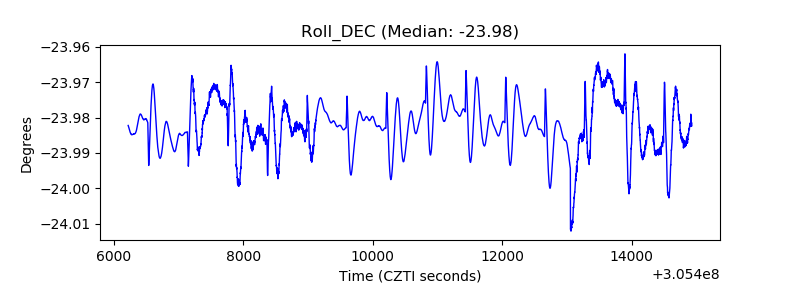 |
| _Roll_RA | 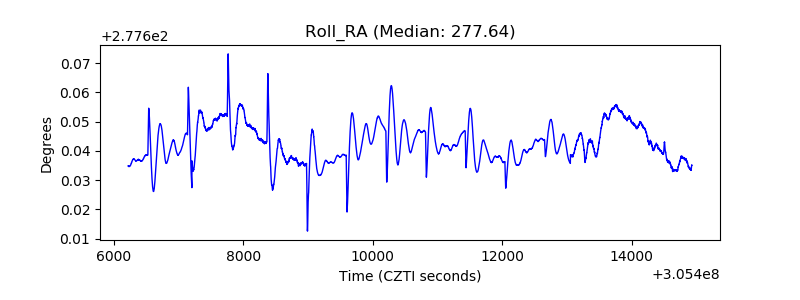 |
| Veto Counter | 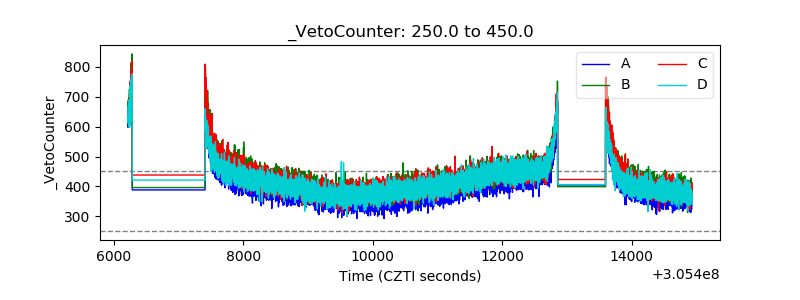 |