| Param | Original file | Final file |
|---|---|---|
| Filename | modeM0/AS1T03_140T01_9000003142_21296cztM0_level2.evt | modeM0/AS1T03_140T01_9000003142_21296cztM0_level2_quad_clean.evt |
| Size (bytes) | 597,985,920 | 101,033,280 |
| Size | 570.3 MB | 96.4 MB |
| Events in quadrant A | 3,498,926 | 668,286 |
| Events in quadrant B | 3,730,977 | 671,496 |
| Events in quadrant C | 3,600,205 | 651,768 |
| Events in quadrant D | 6,781,030 | 555,643 |
| Mode M0 | |||
|---|---|---|---|
| Quadrant | BADHDUFLAG | Total packets | Discarded packets |
| A | 0 | 15284 | 2 |
| B | 0 | 15901 | 3 |
| C | 0 | 15471 | 2 |
| D | 0 | 25232 | 2 |
| Mode M9 | |||
|---|---|---|---|
| Quadrant | BADHDUFLAG | Total packets | Discarded packets |
| A | 0 | 5 | 0 |
| B | 0 | 6 | 0 |
| C | 0 | 6 | 0 |
| D | 0 | 6 | 0 |
| Mode SS | |||
|---|---|---|---|
| Quadrant | BADHDUFLAG | Total packets | Discarded packets |
| A | 0 | 148 | 0 |
| B | 0 | 148 | 0 |
| C | 0 | 148 | 0 |
| D | 0 | 148 | 0 |
| Quadrant | Total seconds | Saturated seconds | Saturation percentage |
|---|---|---|---|
| A | 7360 | 44 | 0.597826% |
| B | 7359 | 89 | 1.209403% |
| C | 7359 | 102 | 1.386058% |
| D | 7359 | 1213 | 16.483218% |
Noise dominated data is calculated using 1-second bins in cleaned event files. If a bin has >2000 counts, and if more than 50% of those come from <1% of pixels, then it is considered to be noise-dominated and hence unusable.
| Quadrant | # 1 sec bins | Bins with >0 counts | Bins with >2000 counts | High rate bins dominated by noise | Noise dominated (total time) | Noise dominated (detector-on time) | Marked lightcurve |
|---|---|---|---|---|---|---|---|
| A | 7730 | 7363 | 0 | 0 | 0.00% | 0.00% | 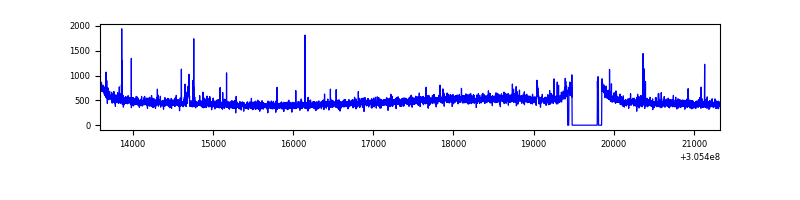 |
| B | 7729 | 7362 | 9 | 9 | 0.12% | 0.12% | 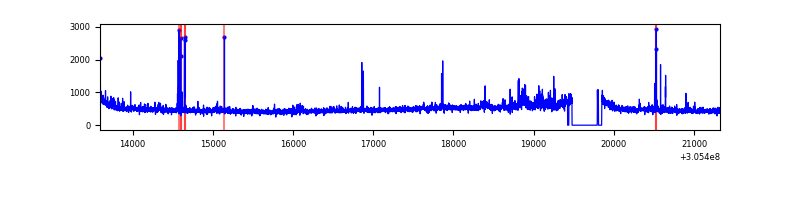 |
| C | 7729 | 7361 | 1 | 1 | 0.01% | 0.01% | 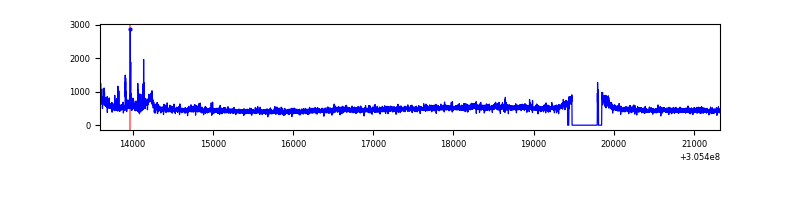 |
| D | 7729 | 7362 | 1130 | 1130 | 14.62% | 15.35% | 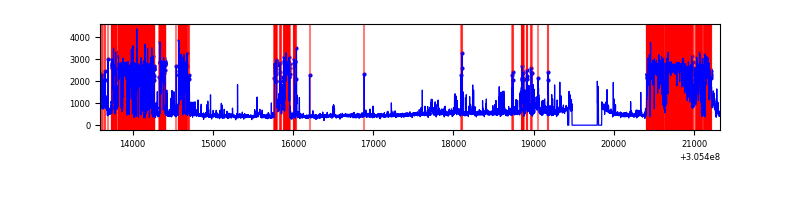 |
Top three noisy pixels from each quadrant. If the there are fewer than three noisy pixels in the level2.evt file, extra rows are filled as -1
| Pixel properties | Quadrant properties | ||||||
|---|---|---|---|---|---|---|---|
| Quadrant | DetID | PixID | Counts | Sigma | Mean | Median | Sigma |
| A | 9 | 143 | 53623 | 293.81 | 888 | 872 | 179.5 |
| A | 5 | 16 | 13548 | 70.6 | 888 | 872 | 179.5 |
| A | 13 | 254 | 10596 | 54.16 | 888 | 872 | 179.5 |
| B | 0 | 229 | 52518 | 304.48 | 889 | 868 | 169.6 |
| B | 3 | 64 | 36074 | 207.54 | 889 | 868 | 169.6 |
| B | 0 | 190 | 29737 | 170.18 | 889 | 868 | 169.6 |
| C | 3 | 233 | 156461 | 779.23 | 847 | 851 | 199.7 |
| C | 14 | 238 | 133679 | 665.15 | 847 | 851 | 199.7 |
| C | 13 | 61 | 5858 | 25.07 | 847 | 851 | 199.7 |
| D | 13 | 174 | 1560447 | 8113.48 | 789 | 764 | 192.2 |
| D | 1 | 52 | 1327430 | 6901.33 | 789 | 764 | 192.2 |
| D | 7 | 38 | 377603 | 1960.32 | 789 | 764 | 192.2 |
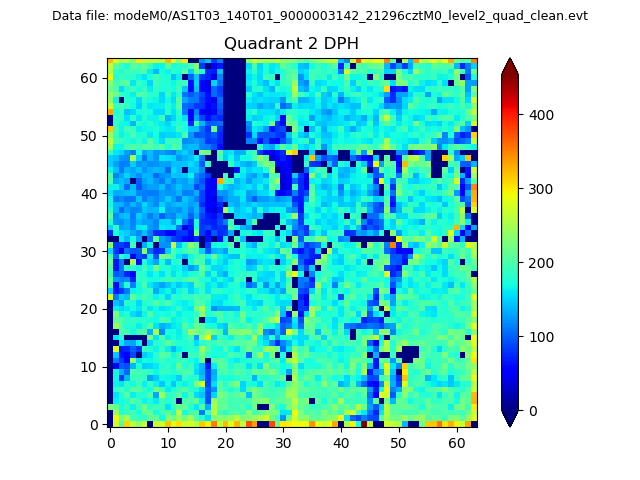
Histogram calculated using DETX and DETY for each event in the final _common_clean file
| Quadrant A | 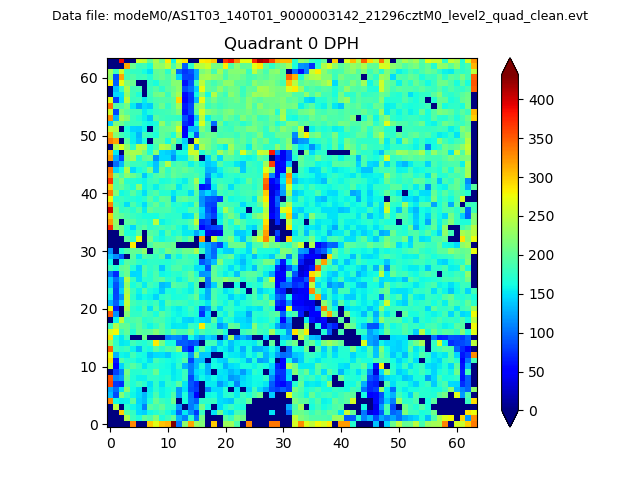 |
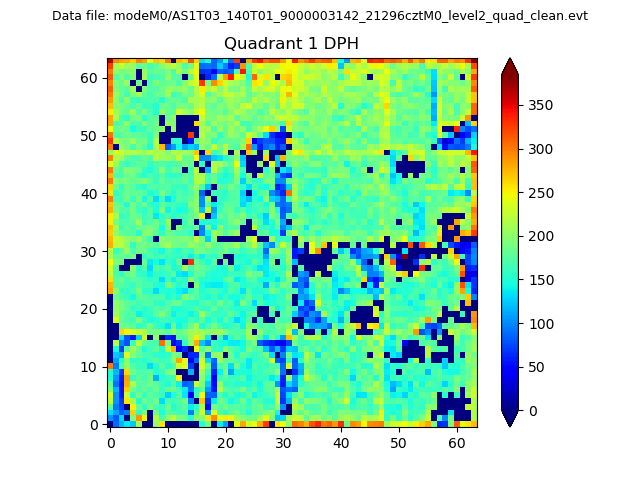 |
Quadrant B |
|---|---|---|---|
| Quadrant D | 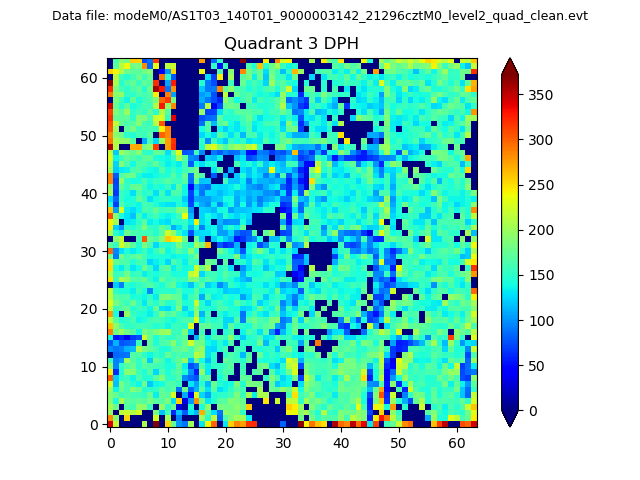 |
 |
Quadrant C |
| Plot type | Count rate plots | Images |
|---|---|---|
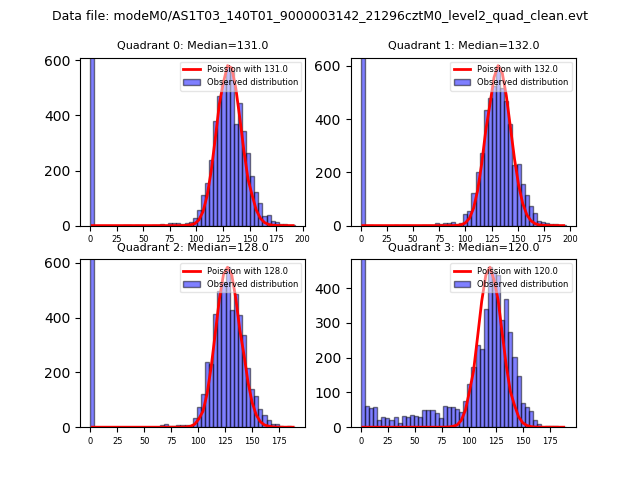
| Comparison with Poisson distribution Blue bars denote a histogram of data divided into 1 sec bins. Red curve is a Poisson curve with rate = median count rate of data. |
 |
 |
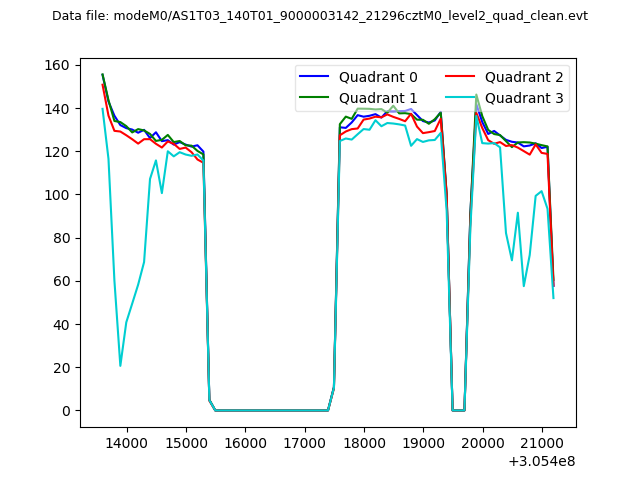
| Quadrant-wise count rates Data is divided into 100 sec bins |
 |
|
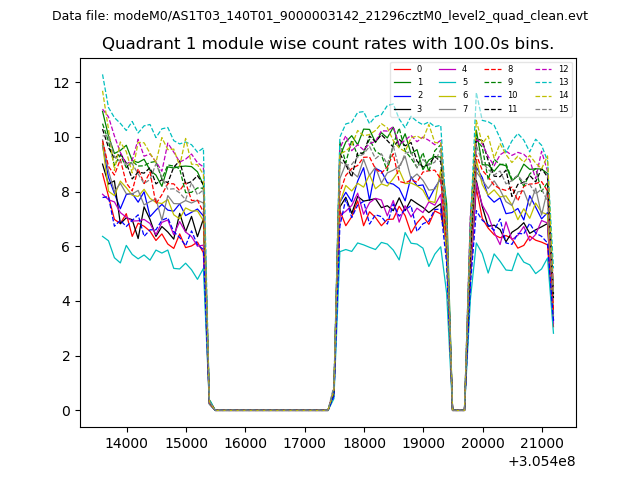
| Module-wise count rates for Quadrant A Data is divided into 100 sec bins |
 |
 |
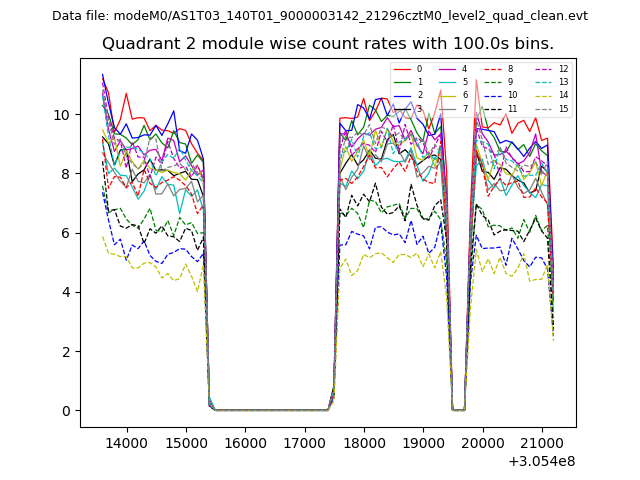
| Module-wise count rates for Quadrant B Data is divided into 100 sec bins |
 |
 |
| Module-wise count rates for Quadrant C Data is divided into 100 sec bins |
 |
 |
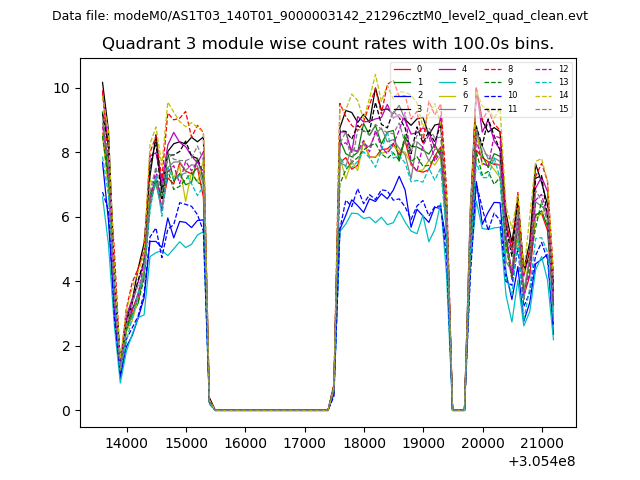
| Module-wise count rates for Quadrant D Data is divided into 100 sec bins |
 |
 |
| Parameter | Plot |
|---|---|
| CZT HV Monitor | 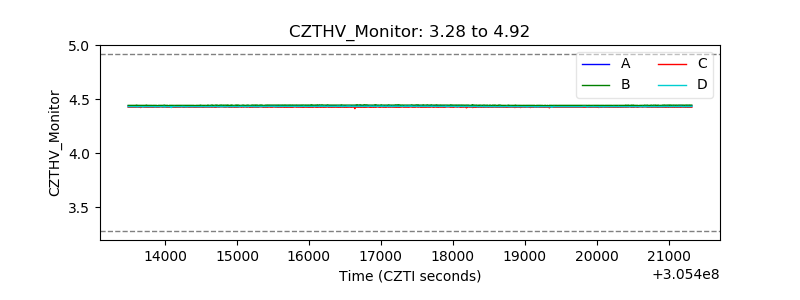 |
| D_VDD | 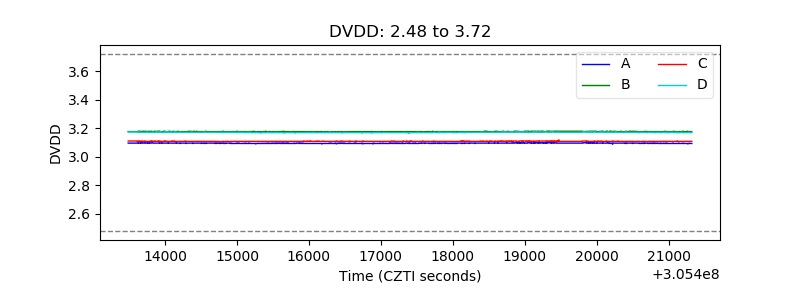 |
| Temperature 1 | 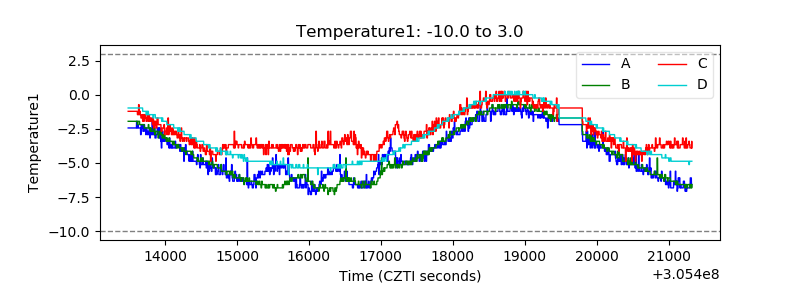 |
| Veto HV Monitor | 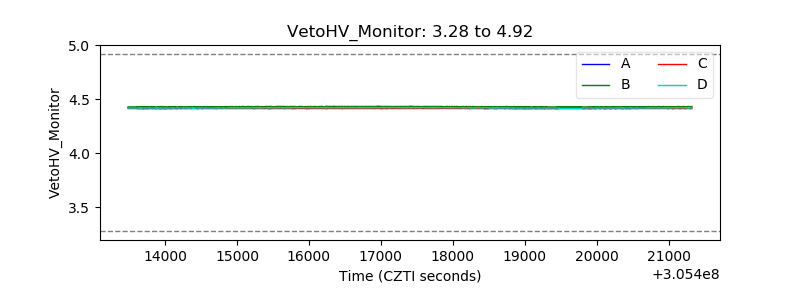 |
| Veto LLD | 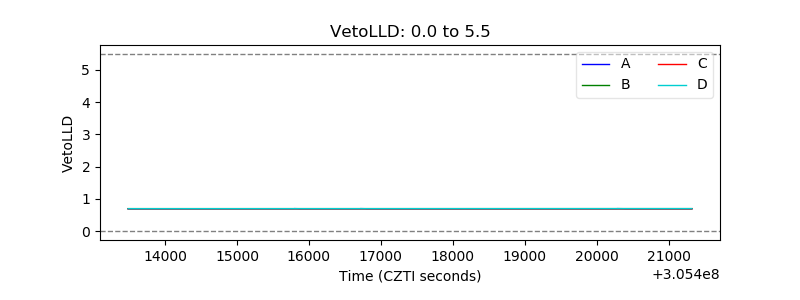 |
| Alpha Counter | 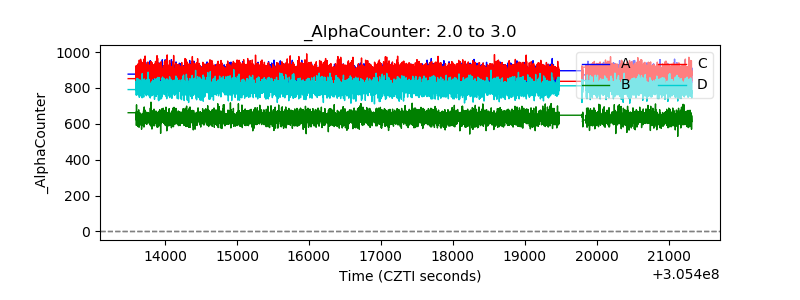 |
| _CPM_Rate | 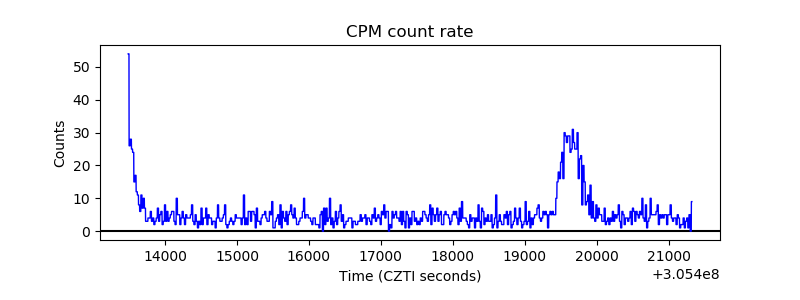 |
| CZT Counter | 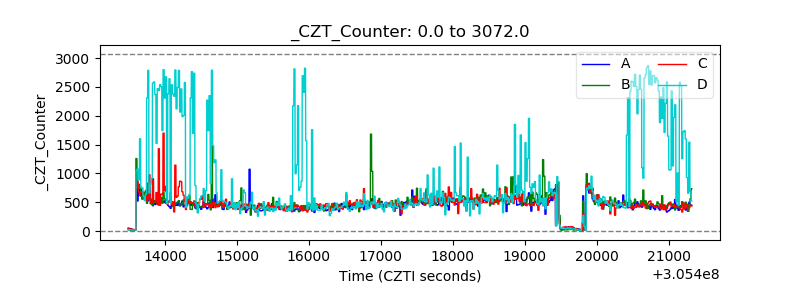 |
| +2.5 Volts monitor |  |
| +5 Volts monitor |  |
| _ROLL_ROT | 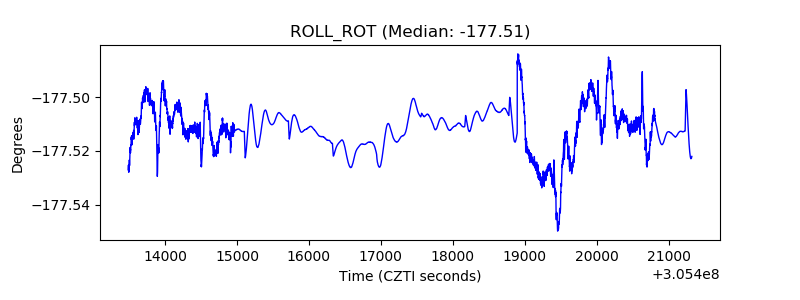 |
| _Roll_DEC |  |
| _Roll_RA | 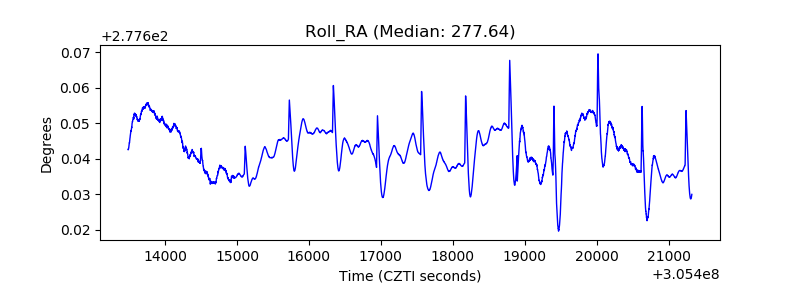 |
| Veto Counter |  |