| Param | Original file | Final file |
|---|---|---|
| Filename | modeM0/AS1T03_140T01_9000003142_21297cztM0_level2.evt | modeM0/AS1T03_140T01_9000003142_21297cztM0_level2_quad_clean.evt |
| Size (bytes) | 588,389,760 | 100,203,840 |
| Size | 561.1 MB | 95.6 MB |
| Events in quadrant A | 3,875,289 | 637,922 |
| Events in quadrant B | 3,849,080 | 648,581 |
| Events in quadrant C | 3,890,703 | 627,872 |
| Events in quadrant D | 5,681,865 | 584,184 |
| Mode M0 | |||
|---|---|---|---|
| Quadrant | BADHDUFLAG | Total packets | Discarded packets |
| A | 0 | 16712 | 2 |
| B | 0 | 16467 | 2 |
| C | 0 | 16571 | 2 |
| D | 0 | 22237 | 2 |
| Mode M9 | |||
|---|---|---|---|
| Quadrant | BADHDUFLAG | Total packets | Discarded packets |
| A | 0 | 7 | 0 |
| B | 0 | 7 | 0 |
| C | 0 | 7 | 0 |
| D | 0 | 7 | 0 |
| Mode SS | |||
|---|---|---|---|
| Quadrant | BADHDUFLAG | Total packets | Discarded packets |
| A | 0 | 156 | 0 |
| B | 0 | 156 | 0 |
| C | 0 | 156 | 0 |
| D | 0 | 156 | 0 |
| Quadrant | Total seconds | Saturated seconds | Saturation percentage |
|---|---|---|---|
| A | 7706 | 141 | 1.829743% |
| B | 7706 | 144 | 1.868674% |
| C | 7707 | 167 | 2.166861% |
| D | 7707 | 712 | 9.238355% |
Noise dominated data is calculated using 1-second bins in cleaned event files. If a bin has >2000 counts, and if more than 50% of those come from <1% of pixels, then it is considered to be noise-dominated and hence unusable.
| Quadrant | # 1 sec bins | Bins with >0 counts | Bins with >2000 counts | High rate bins dominated by noise | Noise dominated (total time) | Noise dominated (detector-on time) | Marked lightcurve |
|---|---|---|---|---|---|---|---|
| A | 8331 | 7709 | 32 | 32 | 0.38% | 0.42% | 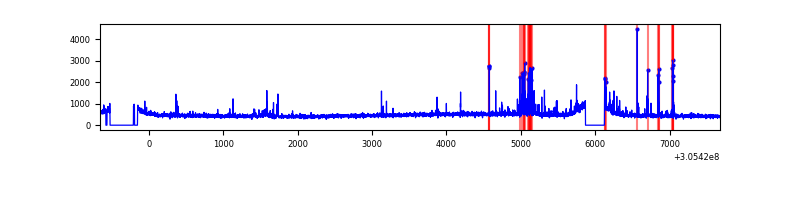 |
| B | 8331 | 7709 | 7 | 7 | 0.08% | 0.09% | 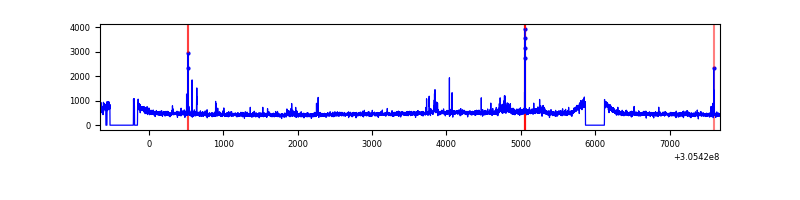 |
| C | 8332 | 7709 | 4 | 4 | 0.05% | 0.05% | 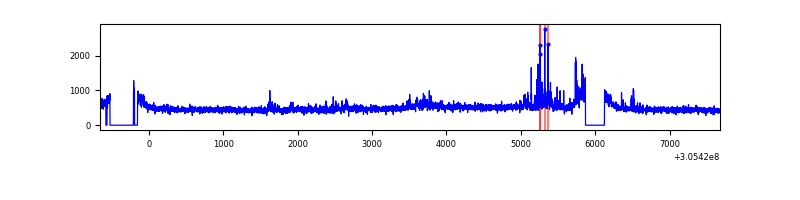 |
| D | 8332 | 7711 | 606 | 606 | 7.27% | 7.86% | 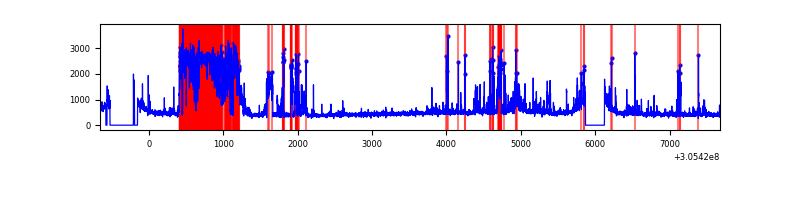 |
Top three noisy pixels from each quadrant. If the there are fewer than three noisy pixels in the level2.evt file, extra rows are filled as -1
| Pixel properties | Quadrant properties | ||||||
|---|---|---|---|---|---|---|---|
| Quadrant | DetID | PixID | Counts | Sigma | Mean | Median | Sigma |
| A | 5 | 16 | 154561 | 811.67 | 933 | 913 | 189.3 |
| A | 9 | 143 | 73178 | 381.75 | 933 | 913 | 189.3 |
| A | 10 | 253 | 43376 | 224.32 | 933 | 913 | 189.3 |
| B | 0 | 230 | 40867 | 221.93 | 935 | 911 | 180.0 |
| B | 3 | 64 | 40766 | 221.36 | 935 | 911 | 180.0 |
| B | 0 | 245 | 28178 | 151.45 | 935 | 911 | 180.0 |
| C | 3 | 233 | 274871 | 1289.2 | 892 | 895 | 212.5 |
| C | 14 | 238 | 138823 | 649.02 | 892 | 895 | 212.5 |
| C | 13 | 61 | 6276 | 25.32 | 892 | 895 | 212.5 |
| D | 13 | 174 | 1754119 | 8186.32 | 879 | 853 | 214.2 |
| D | 1 | 52 | 313497 | 1459.79 | 879 | 853 | 214.2 |
| D | 12 | 235 | 147274 | 683.67 | 879 | 853 | 214.2 |
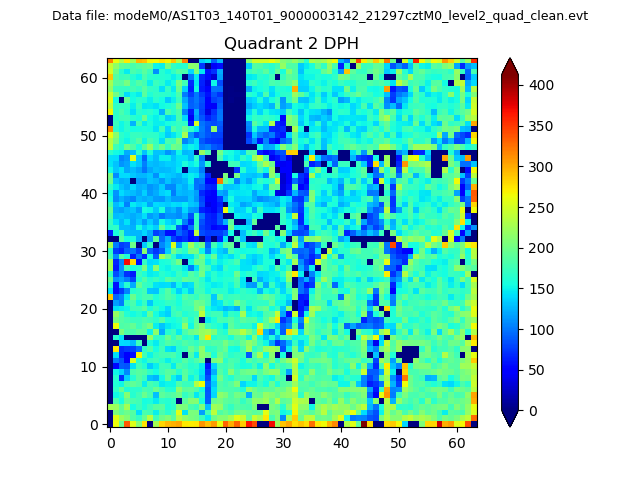
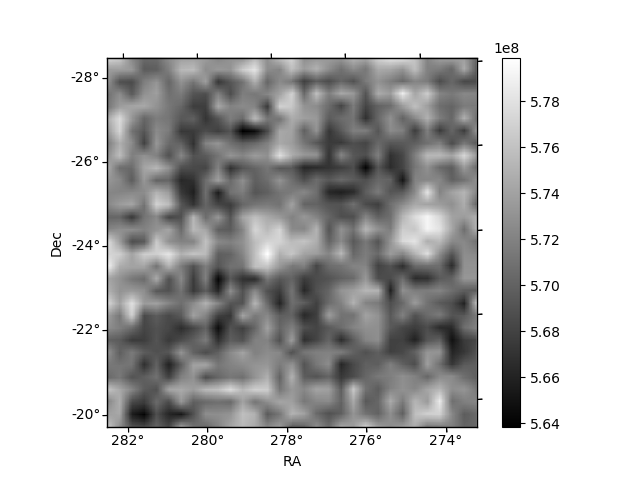
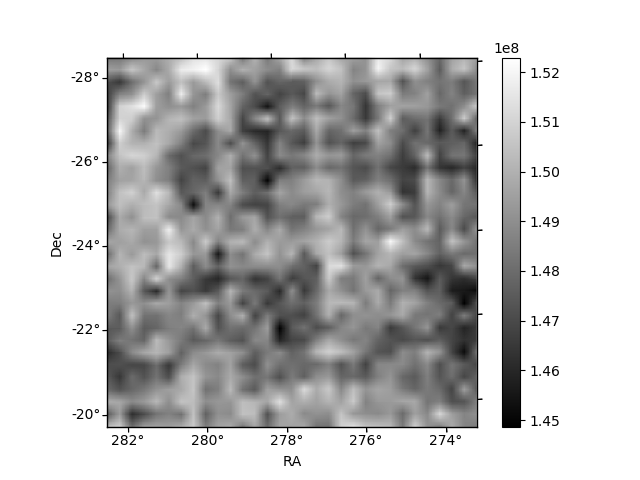
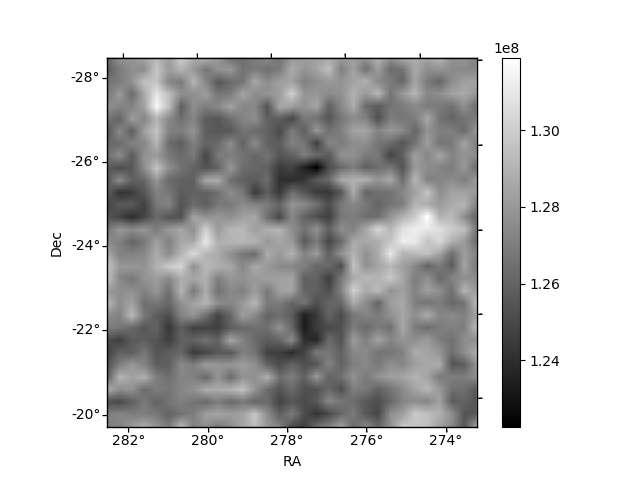
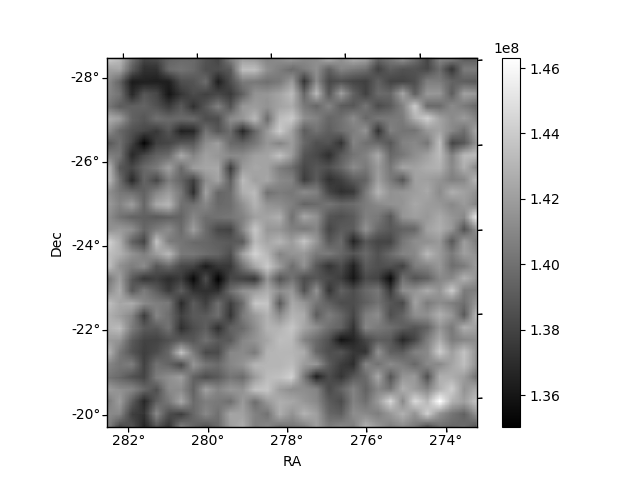
Histogram calculated using DETX and DETY for each event in the final _common_clean file
| Quadrant A | 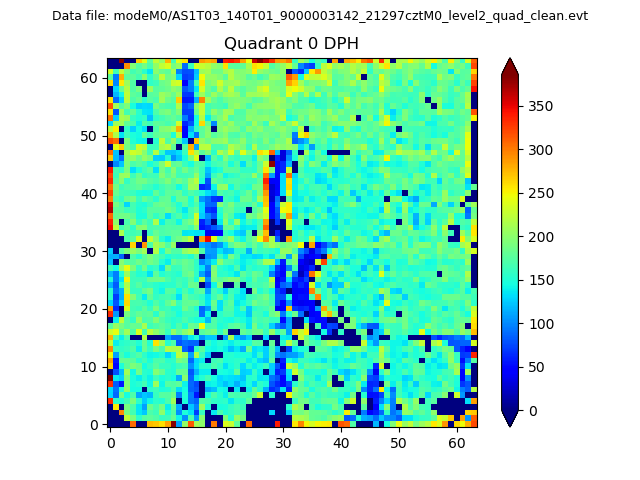 |
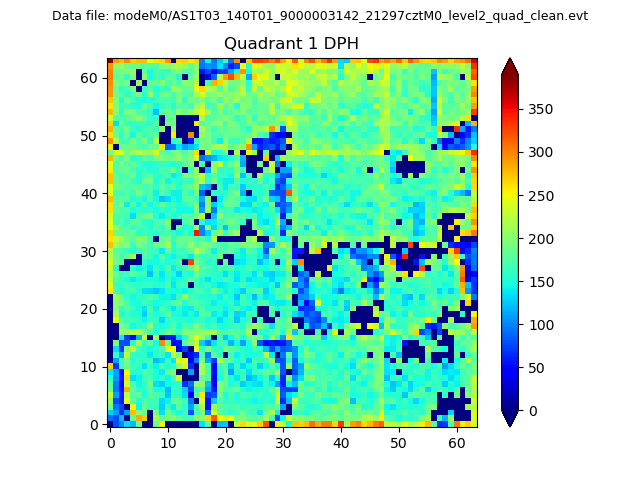 |
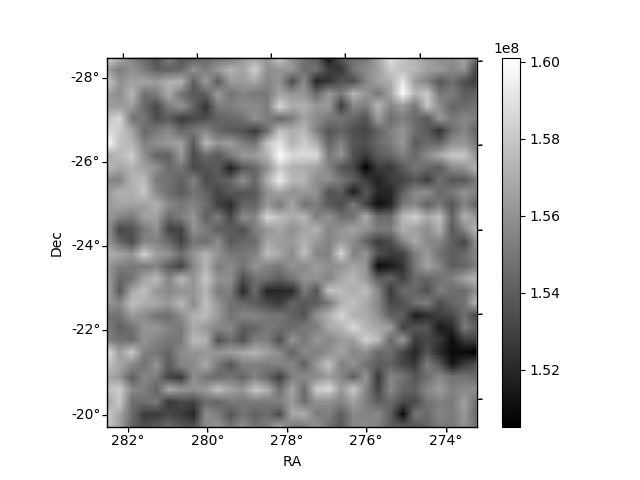
Quadrant B |
|---|---|---|---|
| Quadrant D | 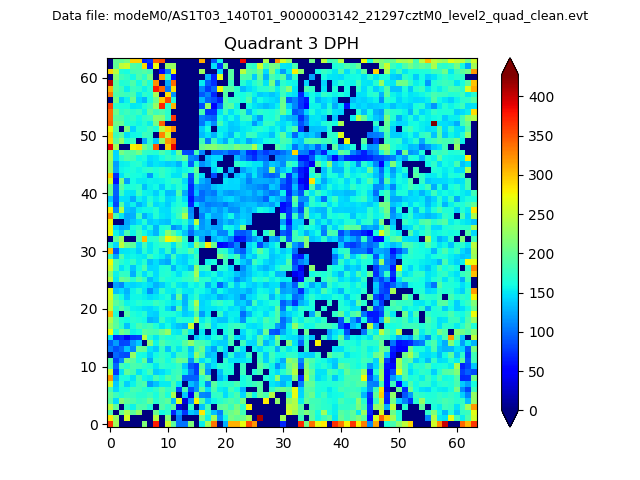 |
 |
Quadrant C |
| Plot type | Count rate plots | Images |
|---|---|---|
| Comparison with Poisson distribution Blue bars denote a histogram of data divided into 1 sec bins. Red curve is a Poisson curve with rate = median count rate of data. |
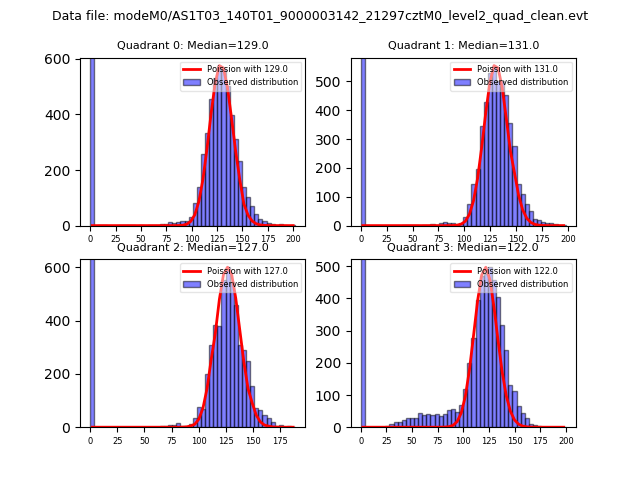 |
 |
| Quadrant-wise count rates Data is divided into 100 sec bins |
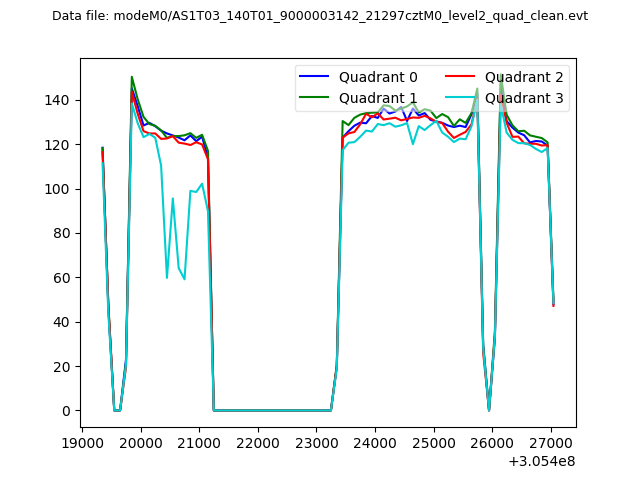 |
|
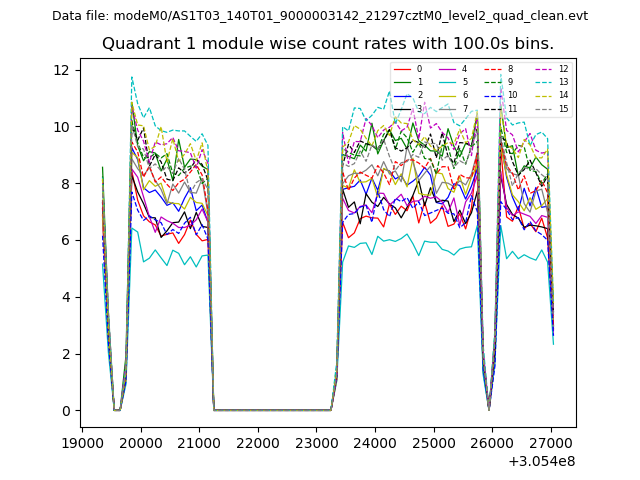
| Module-wise count rates for Quadrant A Data is divided into 100 sec bins |
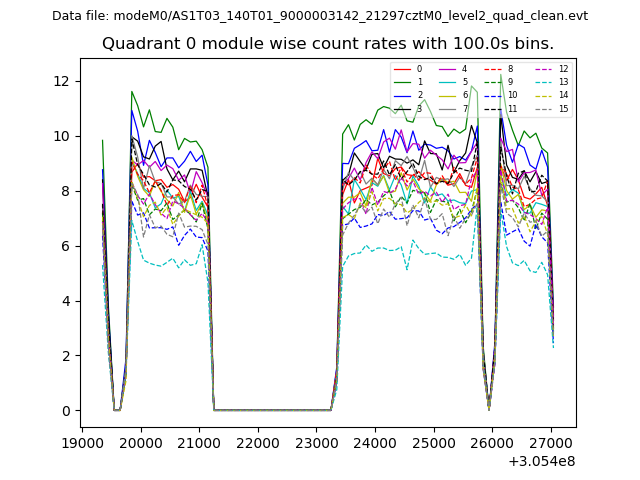 |
 |
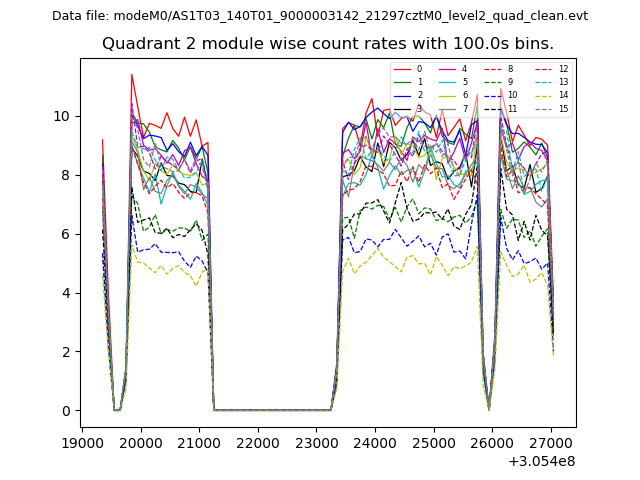
| Module-wise count rates for Quadrant B Data is divided into 100 sec bins |
 |
 |
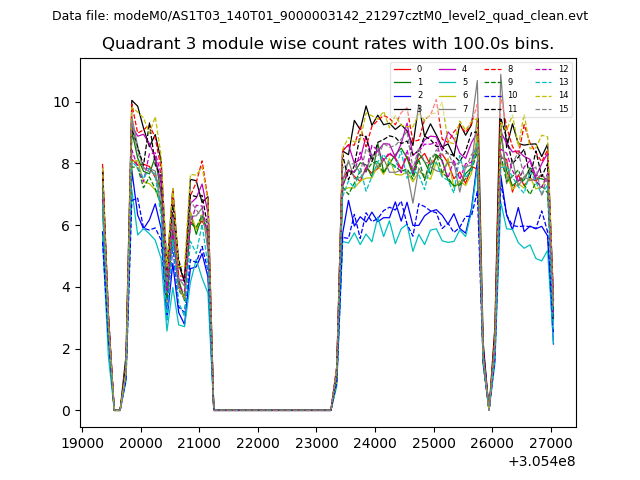
| Module-wise count rates for Quadrant C Data is divided into 100 sec bins |
 |
 |
| Module-wise count rates for Quadrant D Data is divided into 100 sec bins |
 |
 |
| Parameter | Plot |
|---|---|
| CZT HV Monitor | 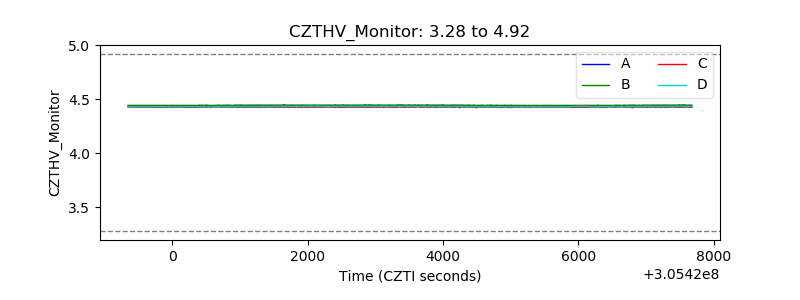 |
| D_VDD | 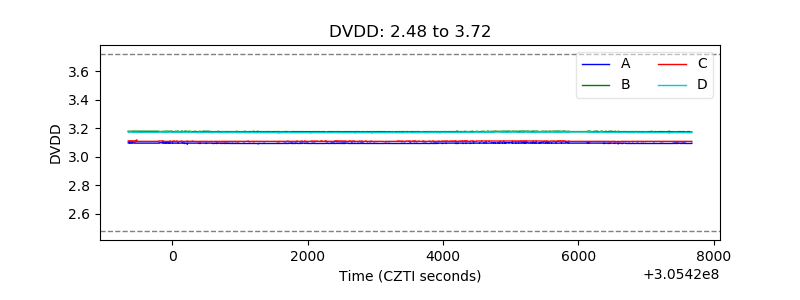 |
| Temperature 1 |  |
| Veto HV Monitor | 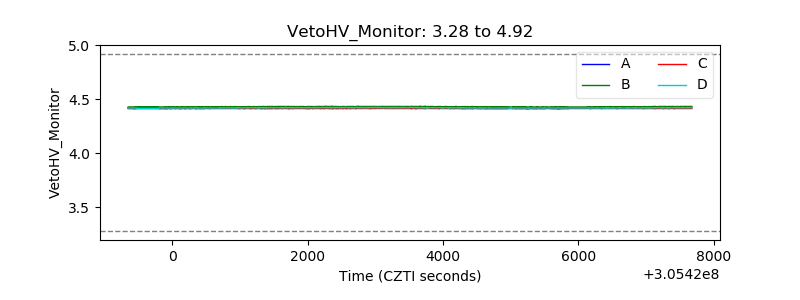 |
| Veto LLD | 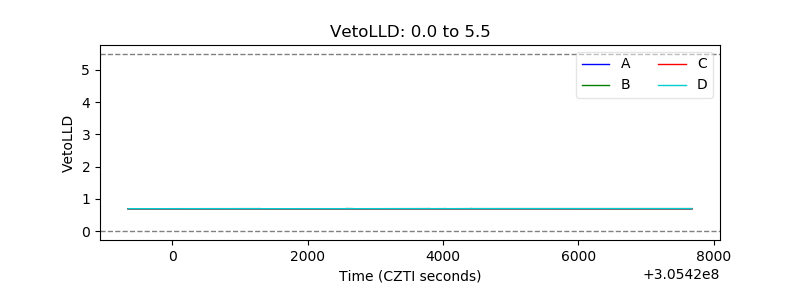 |
| Alpha Counter | 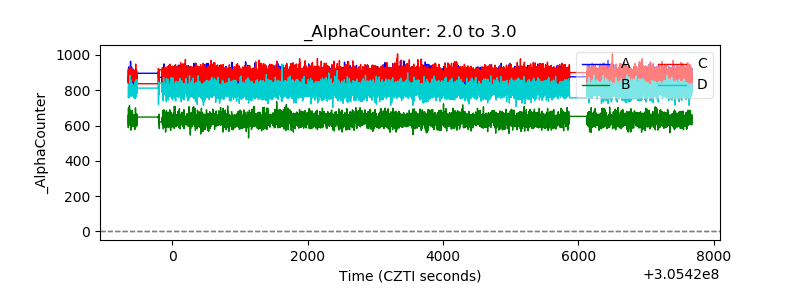 |
| _CPM_Rate | 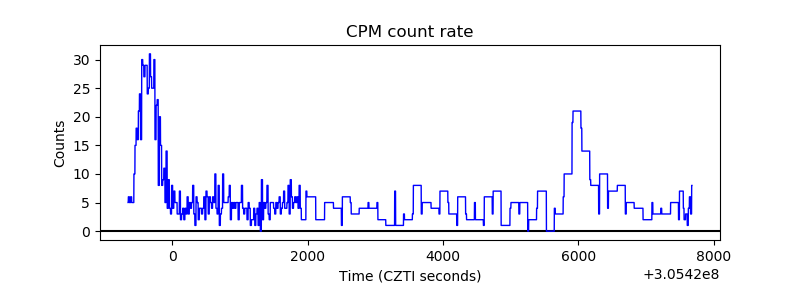 |
| CZT Counter | 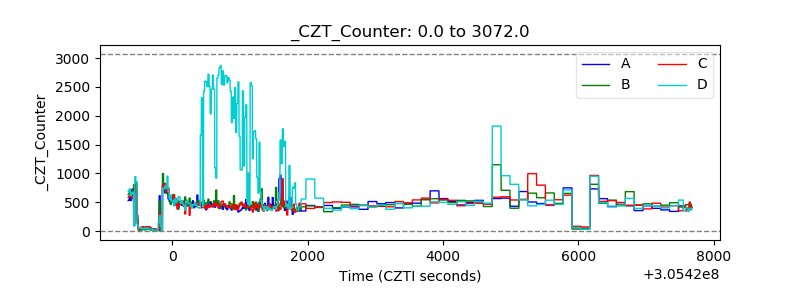 |
| +2.5 Volts monitor | 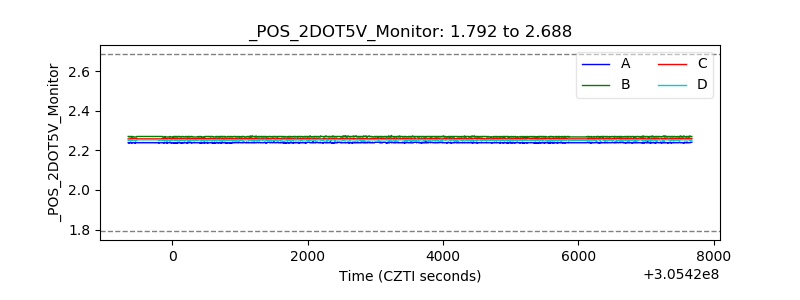 |
| +5 Volts monitor |  |
| _ROLL_ROT | 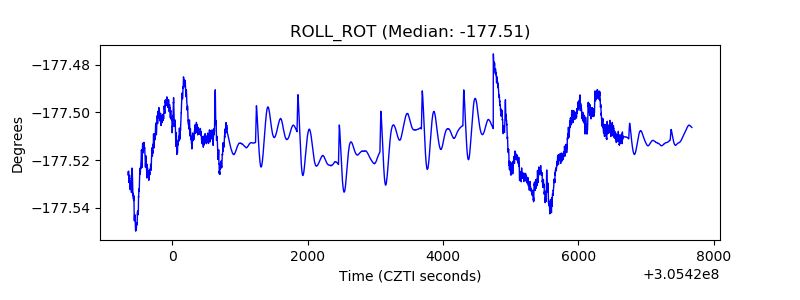 |
| _Roll_DEC | 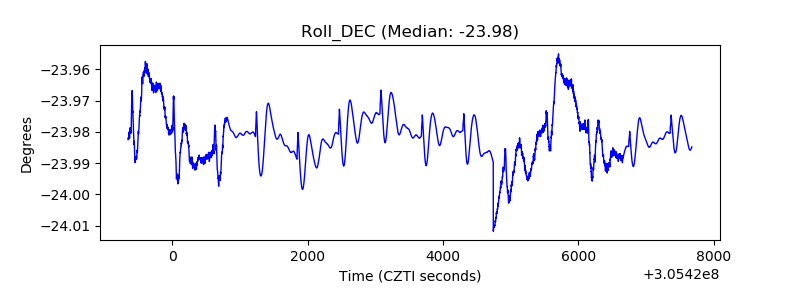 |
| _Roll_RA | 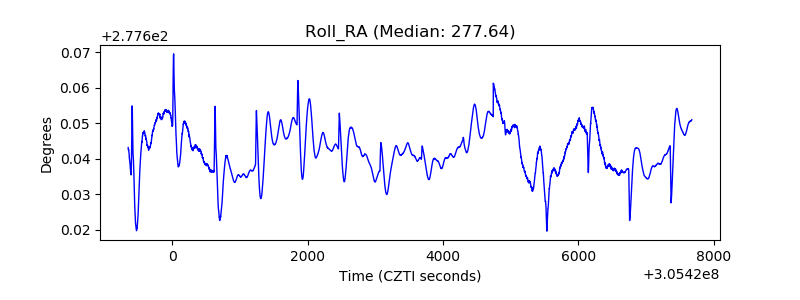 |
| Veto Counter | 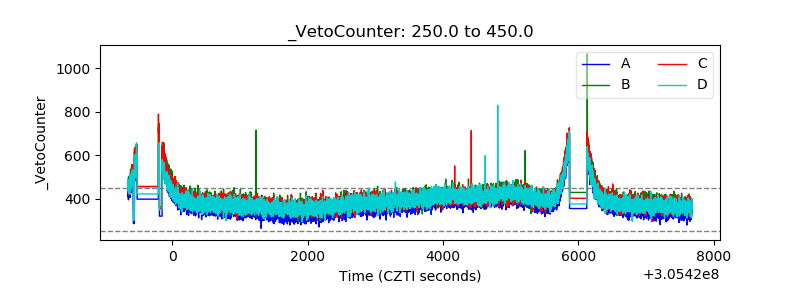 |