| Param | Original file | Final file |
|---|---|---|
| Filename | modeM0/AS1T03_140T01_9000003142_21300cztM0_level2.evt | modeM0/AS1T03_140T01_9000003142_21300cztM0_level2_quad_clean.evt |
| Size (bytes) | 1,325,600,640 | 230,063,040 |
| Size | 1.2 GB | 219.4 MB |
| Events in quadrant A | 9,441,612 | 1,428,155 |
| Events in quadrant B | 9,593,643 | 1,446,565 |
| Events in quadrant C | 9,476,562 | 1,402,136 |
| Events in quadrant D | 10,330,087 | 1,362,013 |
| Mode M0 | |||
|---|---|---|---|
| Quadrant | BADHDUFLAG | Total packets | Discarded packets |
| A | 0 | 40496 | 4 |
| B | 0 | 40801 | 5 |
| C | 0 | 40498 | 4 |
| D | 0 | 43745 | 4 |
| Mode M9 | |||
|---|---|---|---|
| Quadrant | BADHDUFLAG | Total packets | Discarded packets |
| A | 0 | 20 | 0 |
| B | 0 | 20 | 0 |
| C | 0 | 20 | 0 |
| D | 0 | 20 | 0 |
| Mode SS | |||
|---|---|---|---|
| Quadrant | BADHDUFLAG | Total packets | Discarded packets |
| A | 0 | 394 | 0 |
| B | 0 | 394 | 0 |
| C | 0 | 394 | 0 |
| D | 0 | 394 | 0 |
| Quadrant | Total seconds | Saturated seconds | Saturation percentage |
|---|---|---|---|
| A | 19287 | 232 | 1.202883% |
| B | 19286 | 296 | 1.534792% |
| C | 19286 | 308 | 1.597013% |
| D | 19286 | 319 | 1.654050% |
Noise dominated data is calculated using 1-second bins in cleaned event files. If a bin has >2000 counts, and if more than 50% of those come from <1% of pixels, then it is considered to be noise-dominated and hence unusable.
| Quadrant | # 1 sec bins | Bins with >0 counts | Bins with >2000 counts | High rate bins dominated by noise | Noise dominated (total time) | Noise dominated (detector-on time) | Marked lightcurve |
|---|---|---|---|---|---|---|---|
| A | 21222 | 19287 | 15 | 15 | 0.07% | 0.08% | 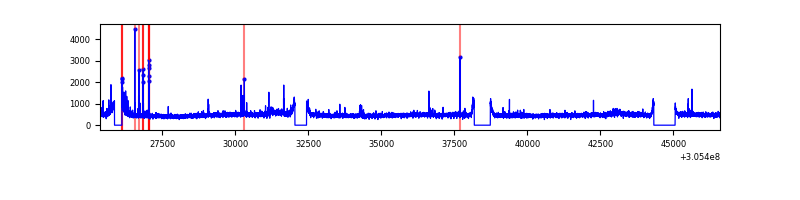 |
| B | 21221 | 19286 | 32 | 32 | 0.15% | 0.17% | 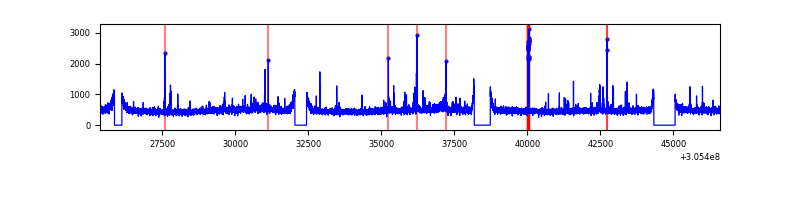 |
| C | 21221 | 19286 | 3 | 3 | 0.01% | 0.02% | 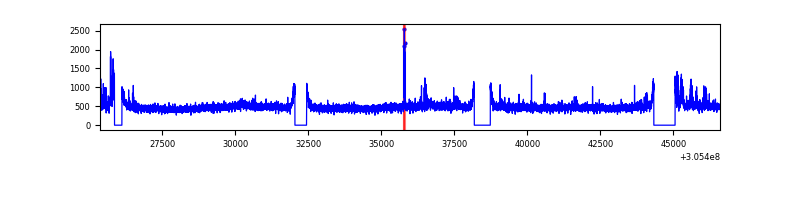 |
| D | 21221 | 19289 | 153 | 153 | 0.72% | 0.79% | 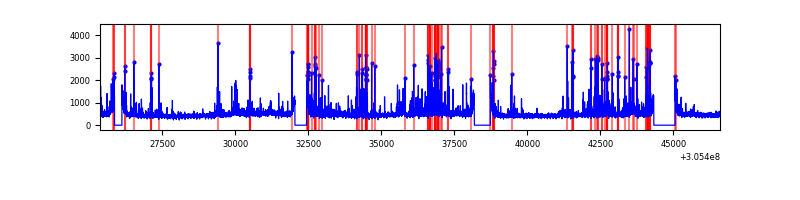 |
Top three noisy pixels from each quadrant. If the there are fewer than three noisy pixels in the level2.evt file, extra rows are filled as -1
| Pixel properties | Quadrant properties | ||||||
|---|---|---|---|---|---|---|---|
| Quadrant | DetID | PixID | Counts | Sigma | Mean | Median | Sigma |
| A | 15 | 236 | 239944 | 506.0 | 2333 | 2282 | 469.7 |
| A | 5 | 16 | 83737 | 173.42 | 2333 | 2282 | 469.7 |
| A | 9 | 143 | 64451 | 132.36 | 2333 | 2282 | 469.7 |
| B | 0 | 230 | 99098 | 215.73 | 2331 | 2269 | 448.8 |
| B | 0 | 189 | 92541 | 201.12 | 2331 | 2269 | 448.8 |
| B | 10 | 249 | 87742 | 190.43 | 2331 | 2269 | 448.8 |
| C | 3 | 233 | 405940 | 769.71 | 2232 | 2244 | 524.5 |
| C | 14 | 238 | 345171 | 653.84 | 2232 | 2244 | 524.5 |
| C | 10 | 91 | 15930 | 26.09 | 2232 | 2244 | 524.5 |
| D | 1 | 52 | 784452 | 1434.56 | 2251 | 2185 | 545.3 |
| D | 12 | 235 | 259193 | 471.31 | 2251 | 2185 | 545.3 |
| D | 13 | 174 | 250078 | 454.6 | 2251 | 2185 | 545.3 |
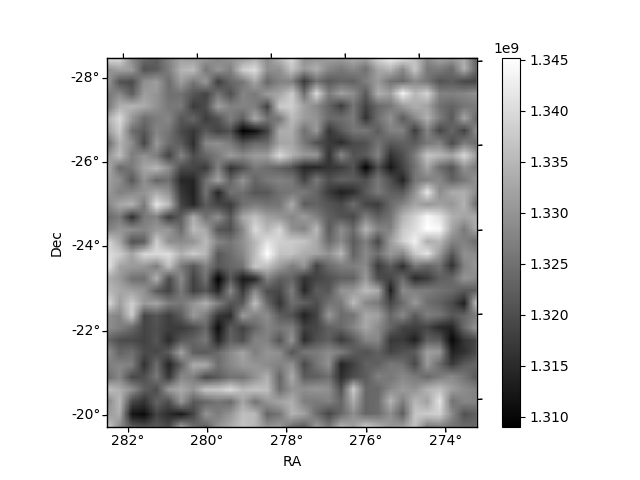
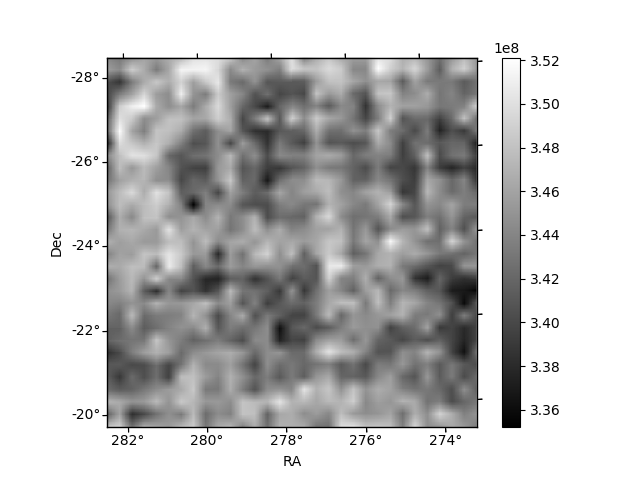
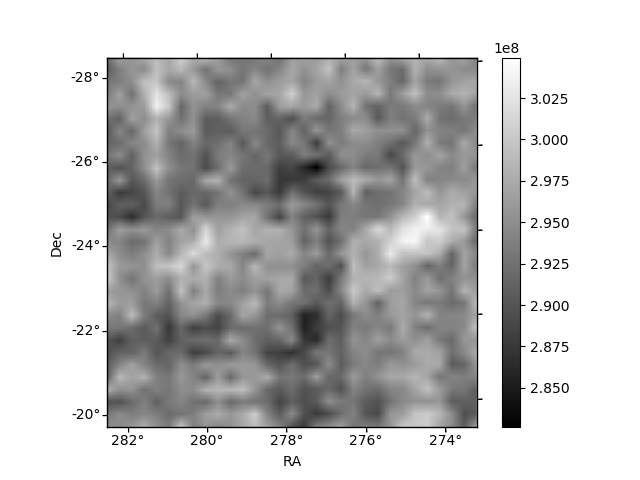
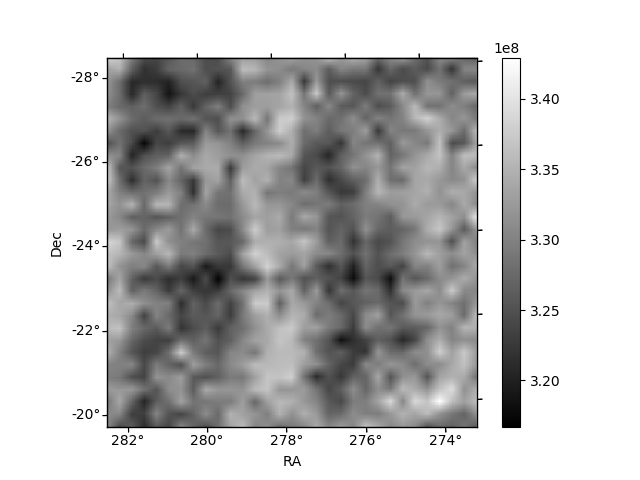
Histogram calculated using DETX and DETY for each event in the final _common_clean file
| Quadrant A | 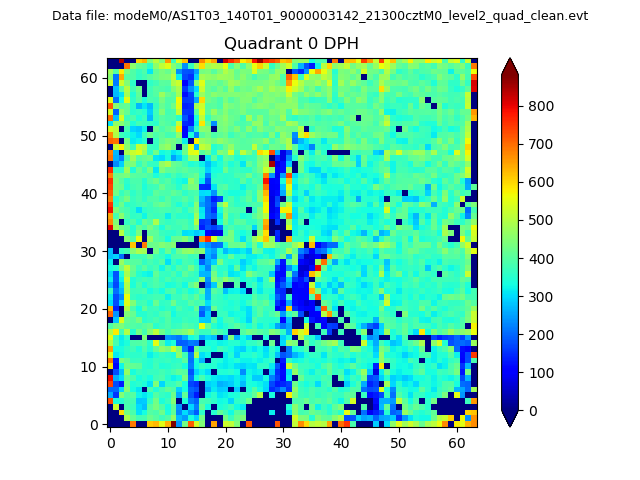 |
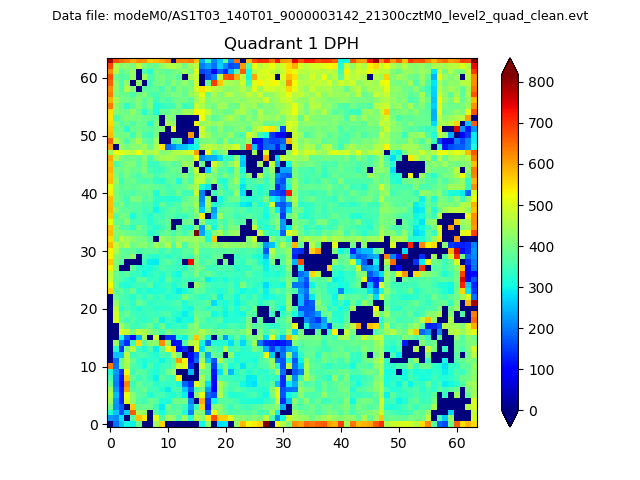 |
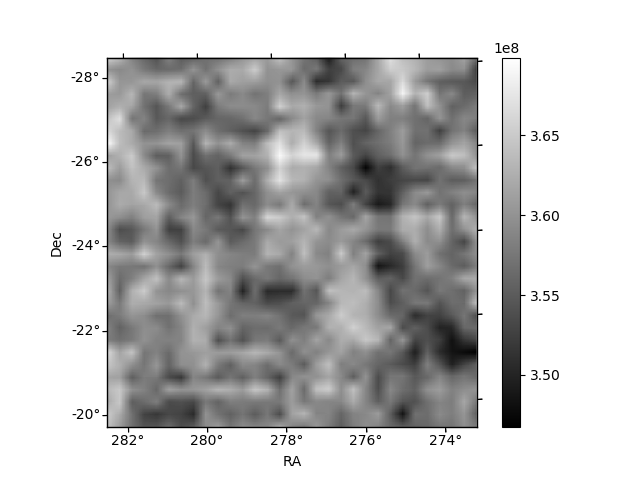
Quadrant B |
|---|---|---|---|
| Quadrant D | 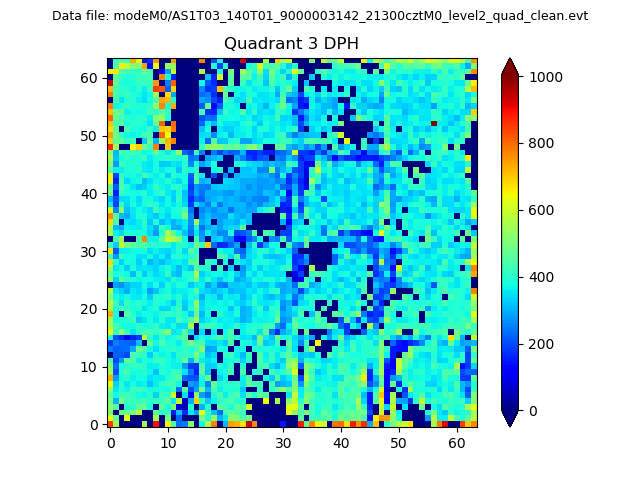 |
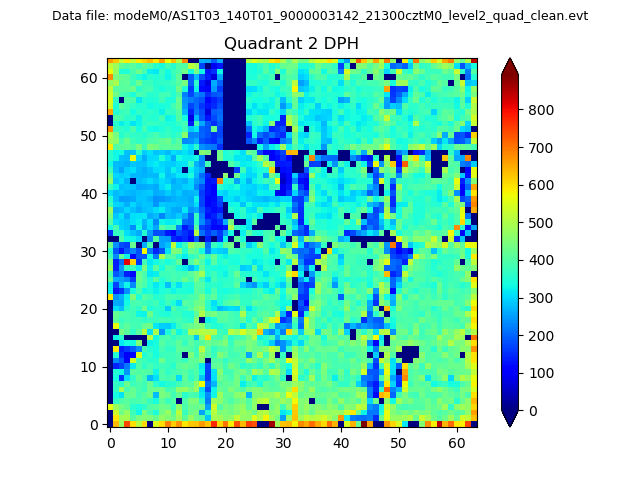 |
Quadrant C |
| Plot type | Count rate plots | Images |
|---|---|---|
| Comparison with Poisson distribution Blue bars denote a histogram of data divided into 1 sec bins. Red curve is a Poisson curve with rate = median count rate of data. |
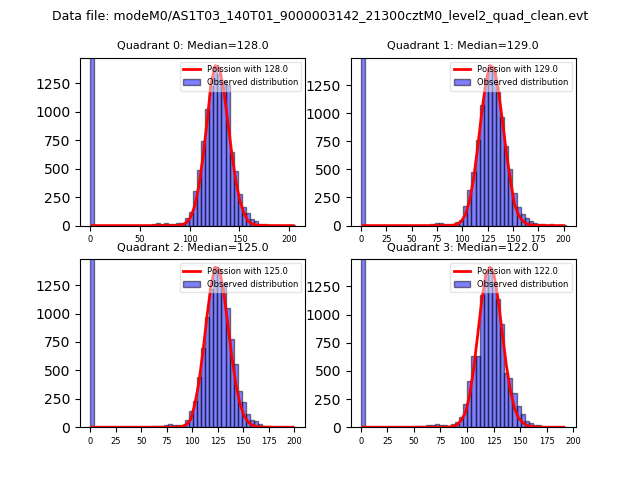 |
 |
| Quadrant-wise count rates Data is divided into 100 sec bins |
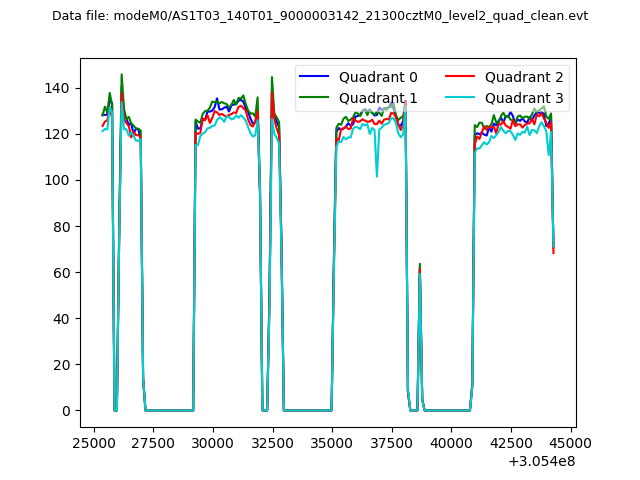 |
|
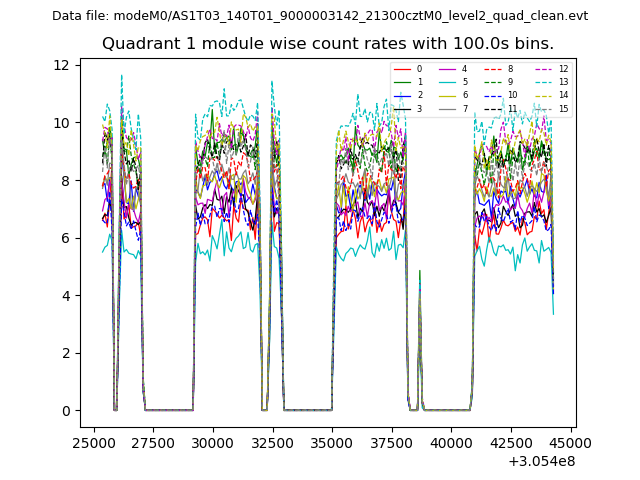
| Module-wise count rates for Quadrant A Data is divided into 100 sec bins |
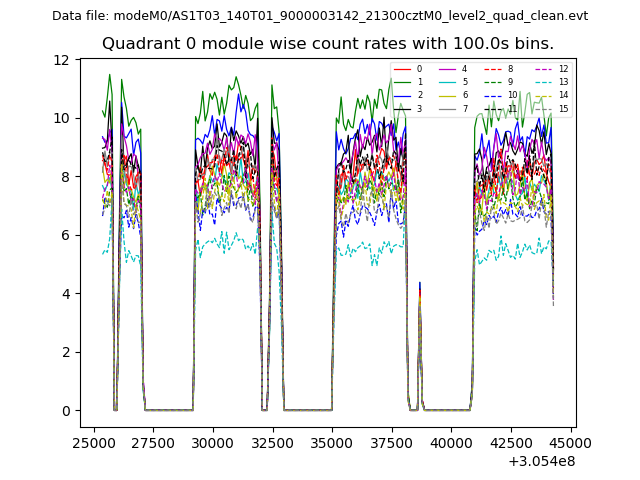 |
 |
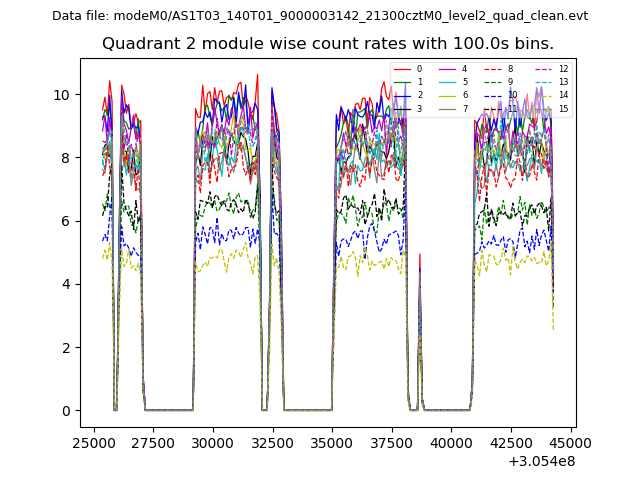
| Module-wise count rates for Quadrant B Data is divided into 100 sec bins |
 |
 |
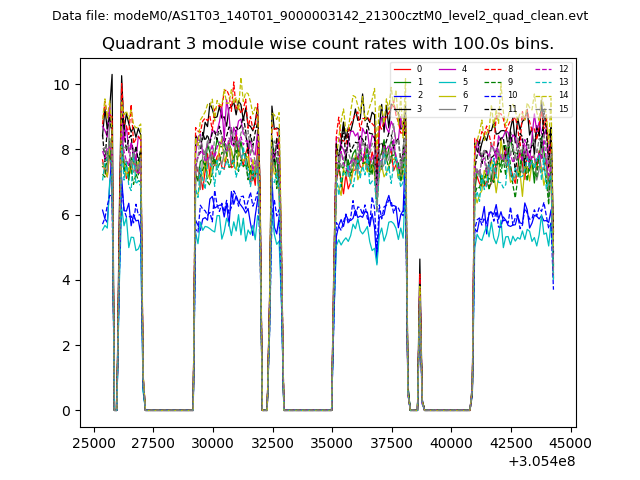
| Module-wise count rates for Quadrant C Data is divided into 100 sec bins |
 |
 |
| Module-wise count rates for Quadrant D Data is divided into 100 sec bins |
 |
 |
| Parameter | Plot |
|---|---|
| CZT HV Monitor | 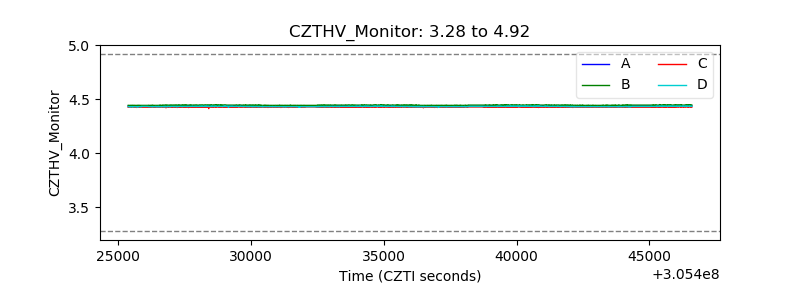 |
| D_VDD |  |
| Temperature 1 | 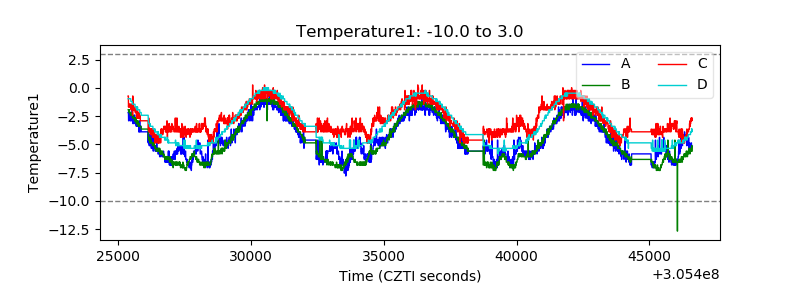 |
| Veto HV Monitor | 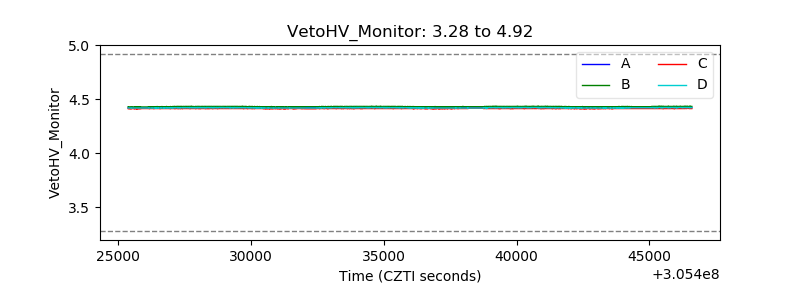 |
| Veto LLD | 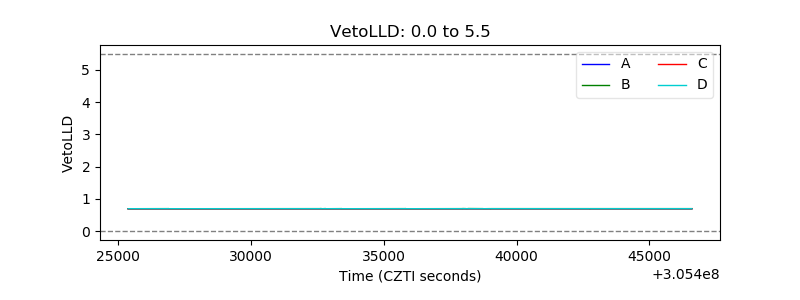 |
| Alpha Counter | 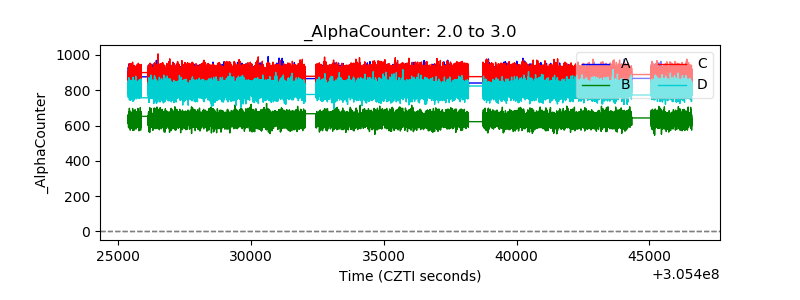 |
| _CPM_Rate | 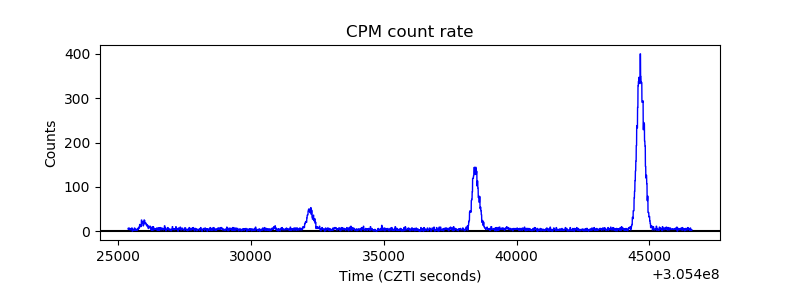 |
| CZT Counter | 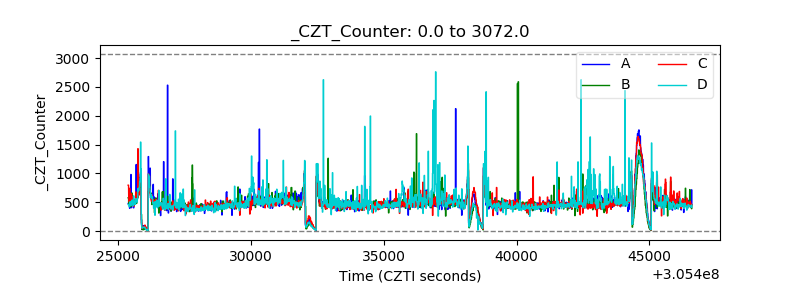 |
| +2.5 Volts monitor |  |
| +5 Volts monitor |  |
| _ROLL_ROT | 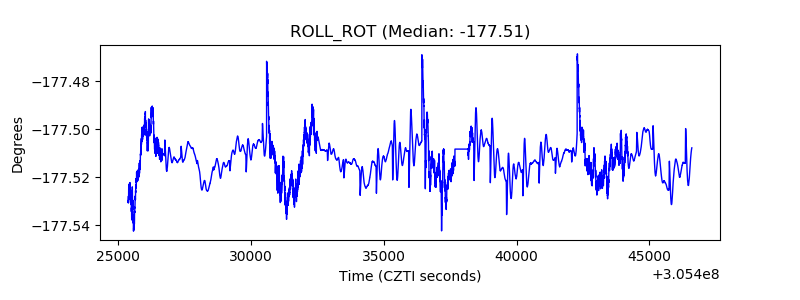 |
| _Roll_DEC | 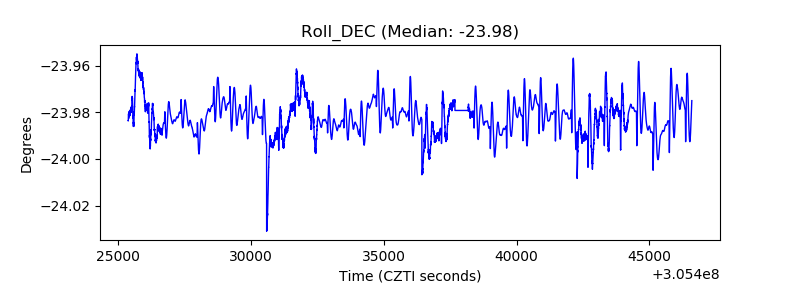 |
| _Roll_RA | 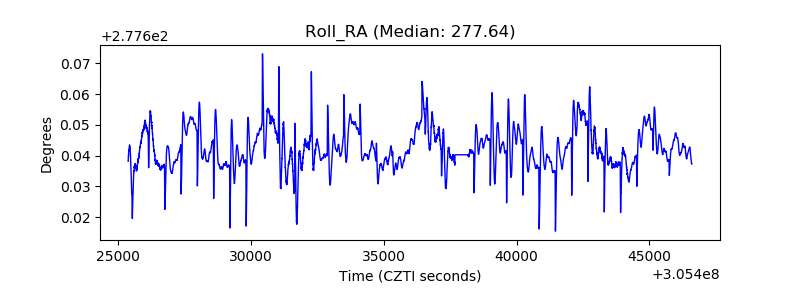 |
| Veto Counter | 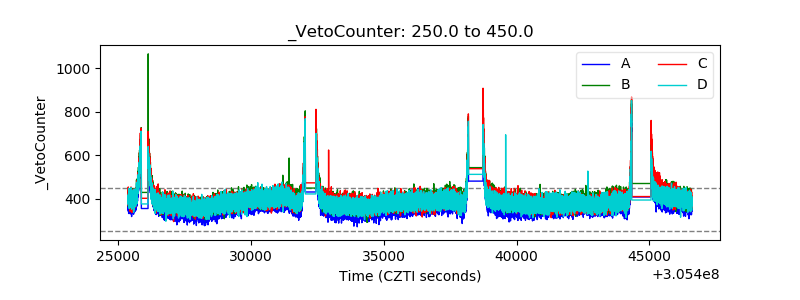 |