| Param | Original file | Final file |
|---|---|---|
| Filename | modeM0/AS1T03_140T01_9000003142_21304cztM0_level2.evt | modeM0/AS1T03_140T01_9000003142_21304cztM0_level2_quad_clean.evt |
| Size (bytes) | 516,185,280 | 97,320,960 |
| Size | 492.3 MB | 92.8 MB |
| Events in quadrant A | 3,672,208 | 639,144 |
| Events in quadrant B | 3,604,093 | 645,318 |
| Events in quadrant C | 3,413,734 | 619,123 |
| Events in quadrant D | 4,495,491 | 584,104 |
| Mode M0 | |||
|---|---|---|---|
| Quadrant | BADHDUFLAG | Total packets | Discarded packets |
| A | 0 | 15059 | 2 |
| B | 0 | 14891 | 3 |
| C | 0 | 14412 | 2 |
| D | 0 | 17660 | 2 |
| Mode M9 | |||
|---|---|---|---|
| Quadrant | BADHDUFLAG | Total packets | Discarded packets |
| A | 0 | 22 | 0 |
| B | 0 | 22 | 0 |
| C | 0 | 22 | 0 |
| D | 0 | 22 | 0 |
| Mode SS | |||
|---|---|---|---|
| Quadrant | BADHDUFLAG | Total packets | Discarded packets |
| A | 0 | 136 | 0 |
| B | 0 | 136 | 0 |
| C | 0 | 136 | 0 |
| D | 0 | 136 | 0 |
| Quadrant | Total seconds | Saturated seconds | Saturation percentage |
|---|---|---|---|
| A | 6590 | 111 | 1.684370% |
| B | 6590 | 127 | 1.927162% |
| C | 6590 | 166 | 2.518968% |
| D | 6590 | 360 | 5.462822% |
Noise dominated data is calculated using 1-second bins in cleaned event files. If a bin has >2000 counts, and if more than 50% of those come from <1% of pixels, then it is considered to be noise-dominated and hence unusable.
| Quadrant | # 1 sec bins | Bins with >0 counts | Bins with >2000 counts | High rate bins dominated by noise | Noise dominated (total time) | Noise dominated (detector-on time) | Marked lightcurve |
|---|---|---|---|---|---|---|---|
| A | 8785 | 6590 | 16 | 16 | 0.18% | 0.24% | 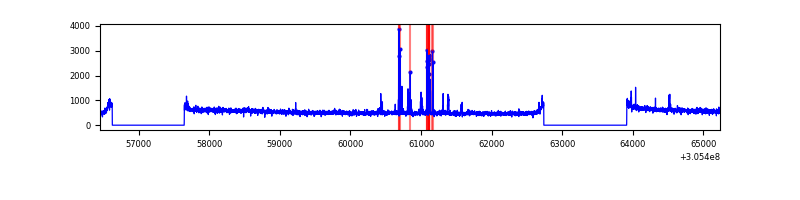 |
| B | 8785 | 6590 | 17 | 17 | 0.19% | 0.26% | 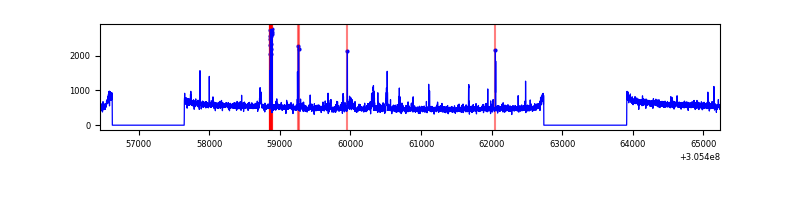 |
| C | 8785 | 6590 | 0 | 0 | 0.00% | 0.00% | 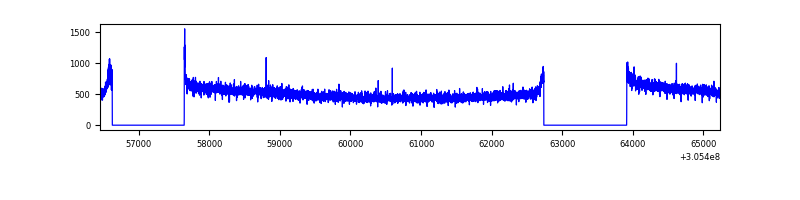 |
| D | 8785 | 6591 | 252 | 252 | 2.87% | 3.82% | 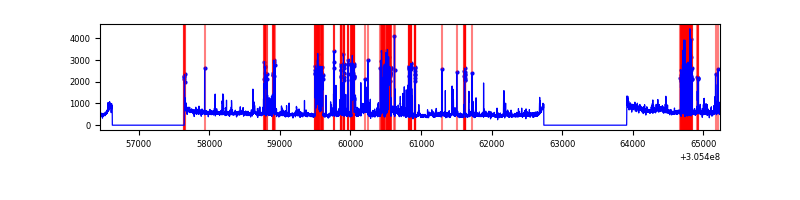 |
Top three noisy pixels from each quadrant. If the there are fewer than three noisy pixels in the level2.evt file, extra rows are filled as -1
| Pixel properties | Quadrant properties | ||||||
|---|---|---|---|---|---|---|---|
| Quadrant | DetID | PixID | Counts | Sigma | Mean | Median | Sigma |
| A | 5 | 16 | 110729 | 620.37 | 888 | 871 | 177.1 |
| A | 15 | 236 | 107311 | 601.07 | 888 | 871 | 177.1 |
| A | 9 | 143 | 15397 | 82.03 | 888 | 871 | 177.1 |
| B | 0 | 189 | 47198 | 281.2 | 874 | 854 | 164.8 |
| B | 3 | 64 | 39561 | 234.86 | 874 | 854 | 164.8 |
| B | 0 | 230 | 33158 | 196.01 | 874 | 854 | 164.8 |
| C | 14 | 238 | 134384 | 688.88 | 836 | 844 | 193.9 |
| C | 10 | 23 | 9185 | 43.03 | 836 | 844 | 193.9 |
| C | 0 | 10 | 7677 | 35.25 | 836 | 844 | 193.9 |
| D | 1 | 52 | 1015774 | 4985.38 | 843 | 820 | 203.6 |
| D | 13 | 153 | 74463 | 361.73 | 843 | 820 | 203.6 |
| D | 12 | 235 | 58454 | 283.09 | 843 | 820 | 203.6 |
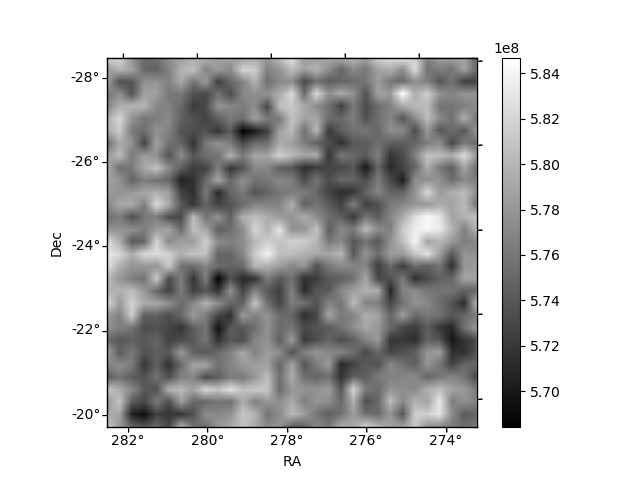
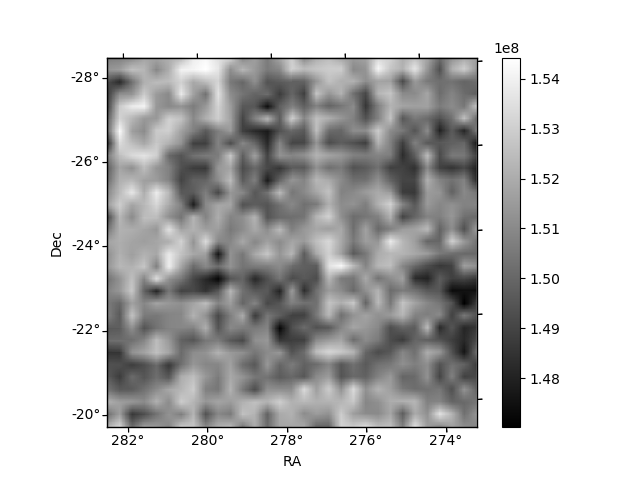
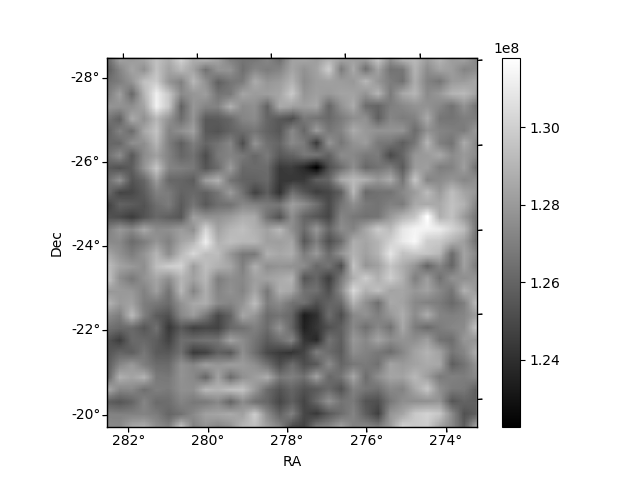
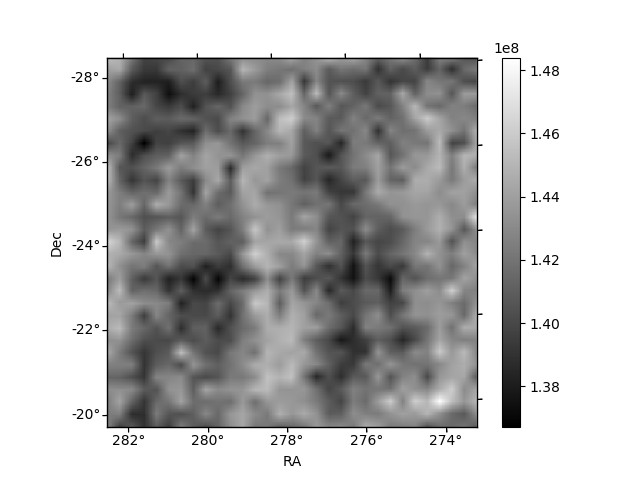
Histogram calculated using DETX and DETY for each event in the final _common_clean file
| Quadrant A | 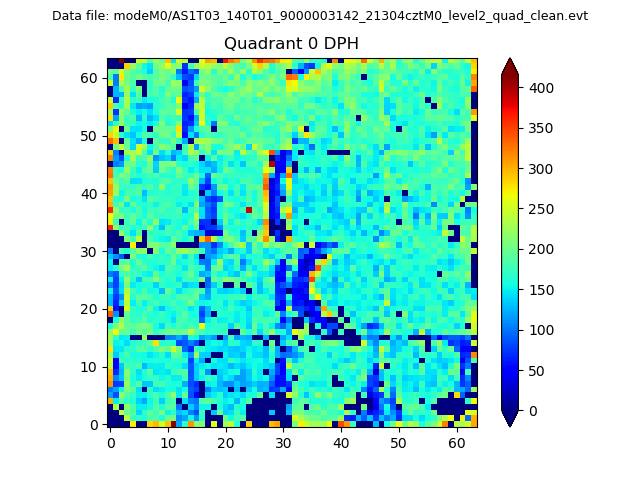 |
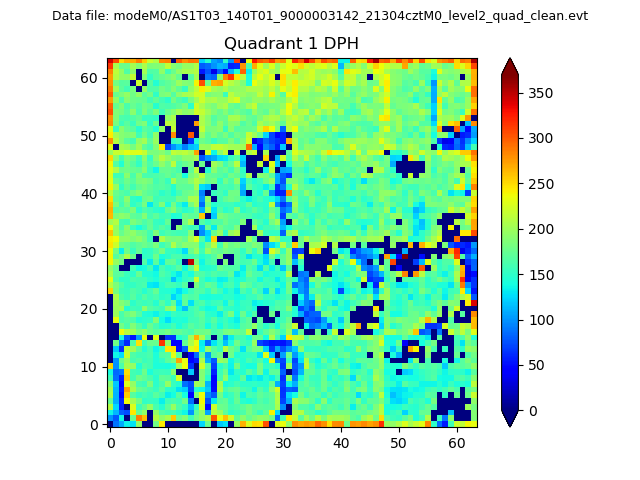 |
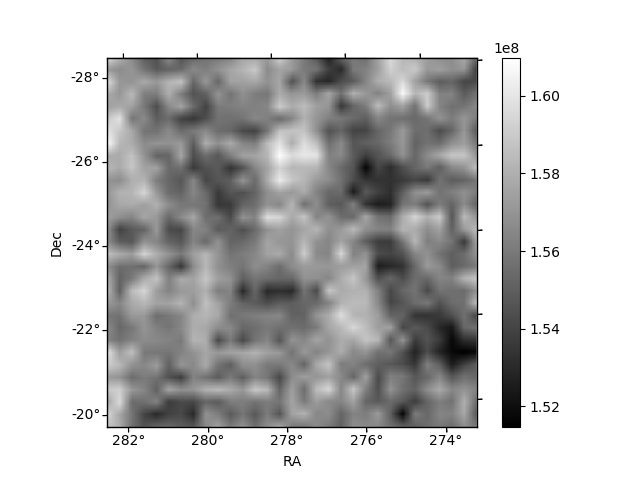
Quadrant B |
|---|---|---|---|
| Quadrant D | 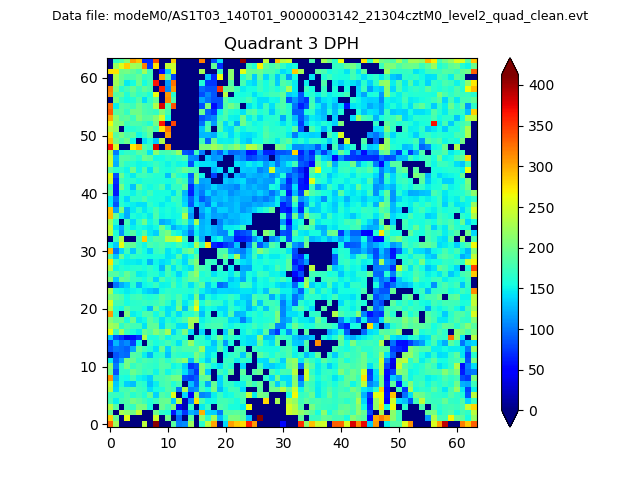 |
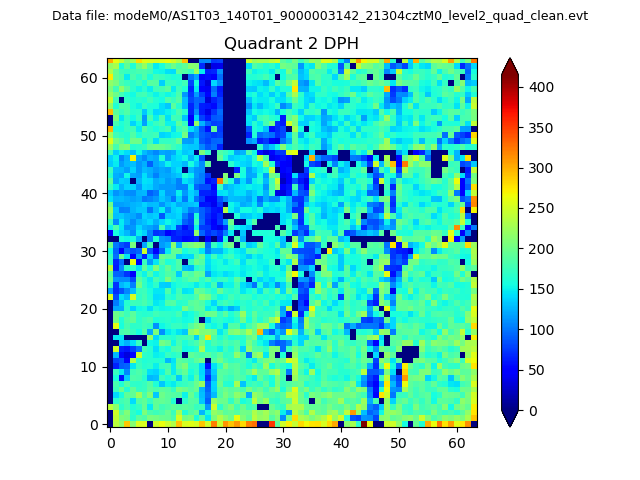 |
Quadrant C |
| Plot type | Count rate plots | Images |
|---|---|---|
| Comparison with Poisson distribution Blue bars denote a histogram of data divided into 1 sec bins. Red curve is a Poisson curve with rate = median count rate of data. |
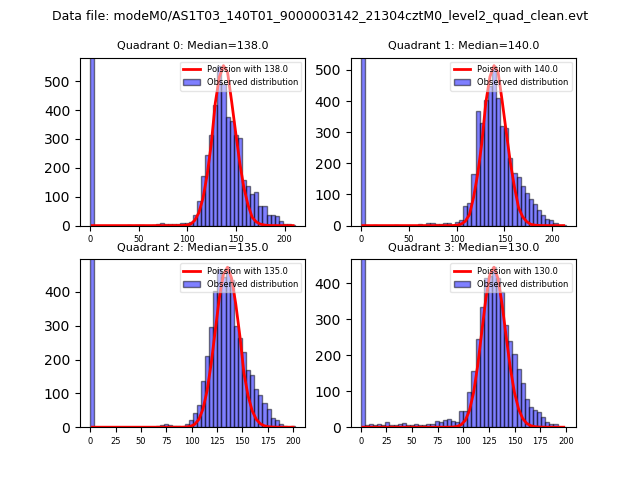 |
 |
| Quadrant-wise count rates Data is divided into 100 sec bins |
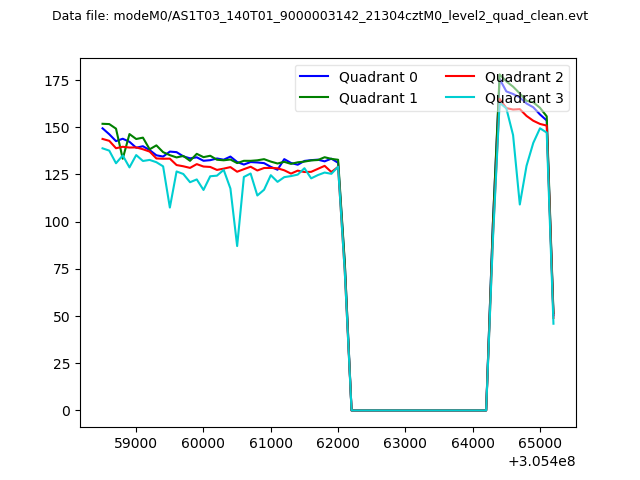 |
|
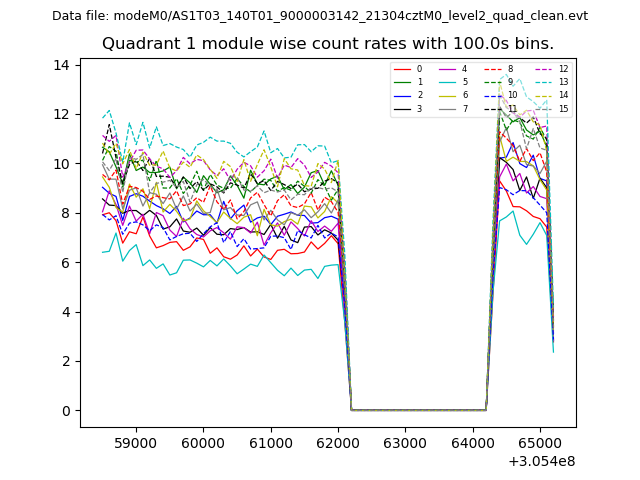
| Module-wise count rates for Quadrant A Data is divided into 100 sec bins |
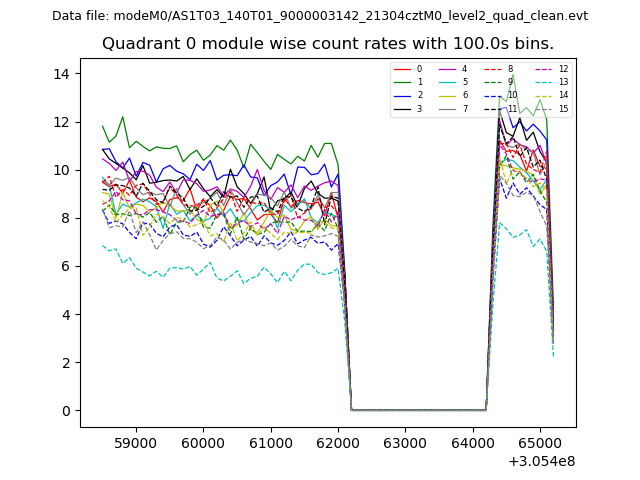 |
 |
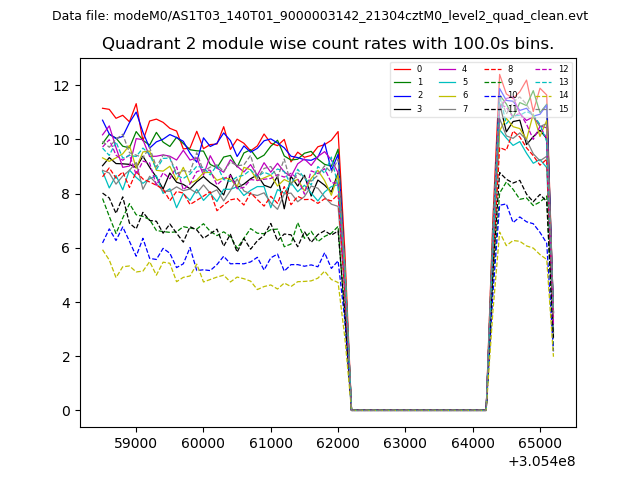
| Module-wise count rates for Quadrant B Data is divided into 100 sec bins |
 |
 |
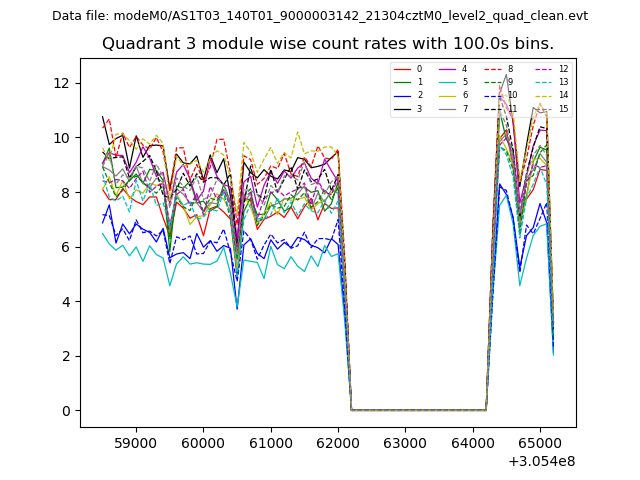
| Module-wise count rates for Quadrant C Data is divided into 100 sec bins |
 |
 |
| Module-wise count rates for Quadrant D Data is divided into 100 sec bins |
 |
 |
| Parameter | Plot |
|---|---|
| CZT HV Monitor | 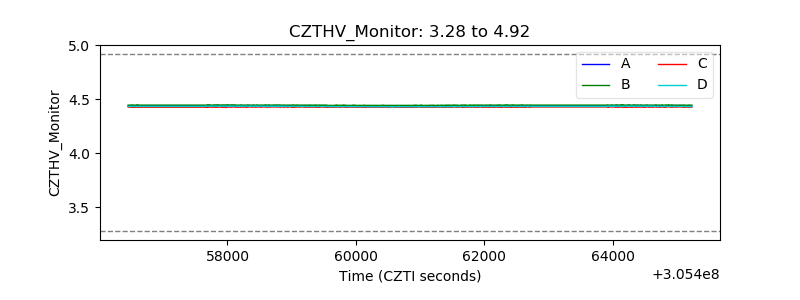 |
| D_VDD | 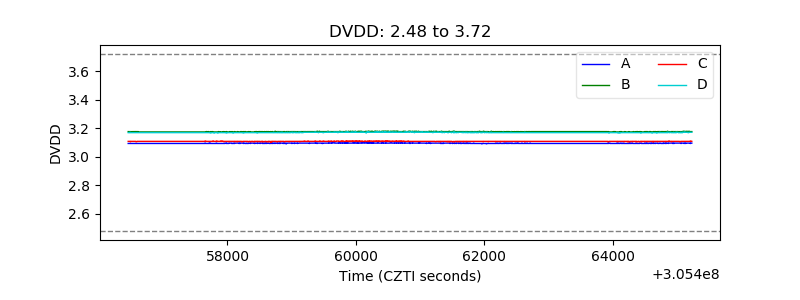 |
| Temperature 1 | 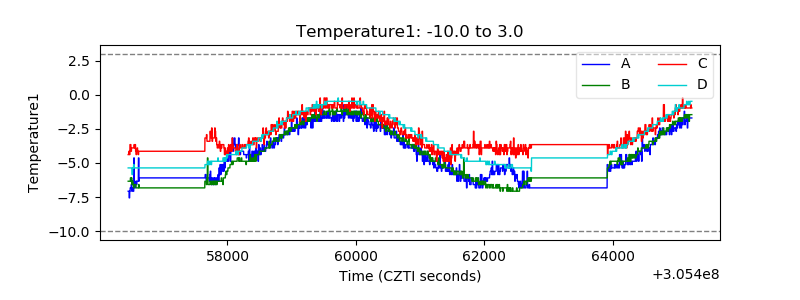 |
| Veto HV Monitor | 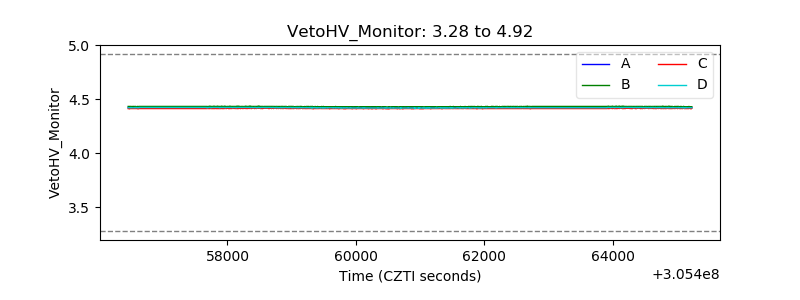 |
| Veto LLD | 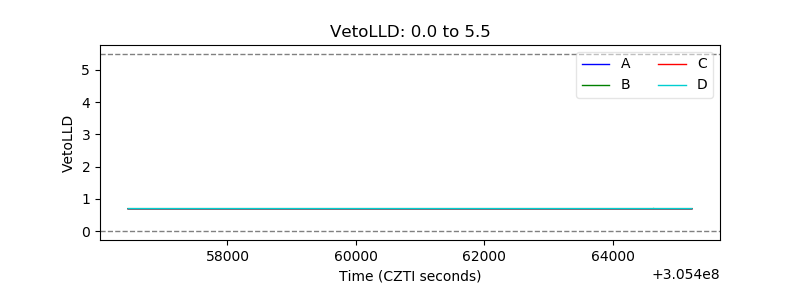 |
| Alpha Counter | 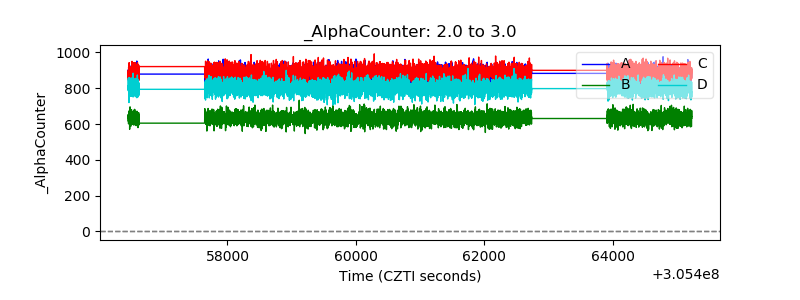 |
| _CPM_Rate | 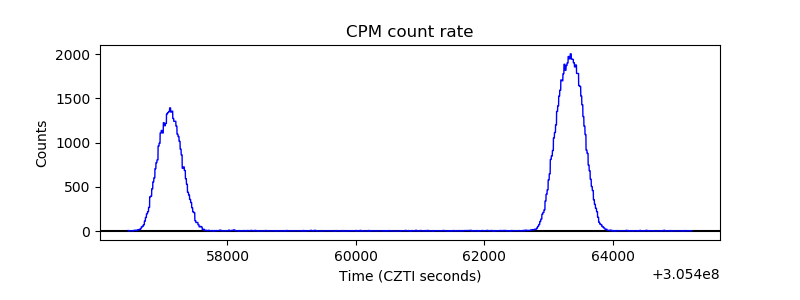 |
| CZT Counter | 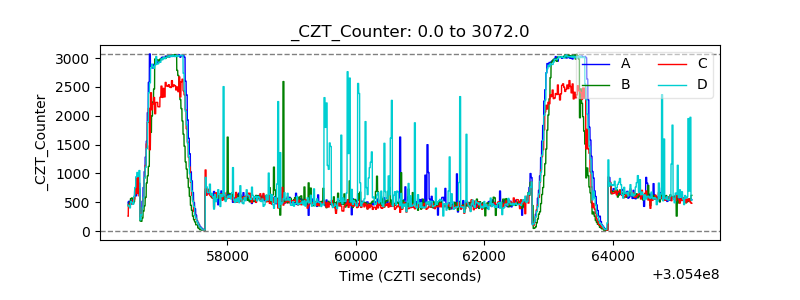 |
| +2.5 Volts monitor | 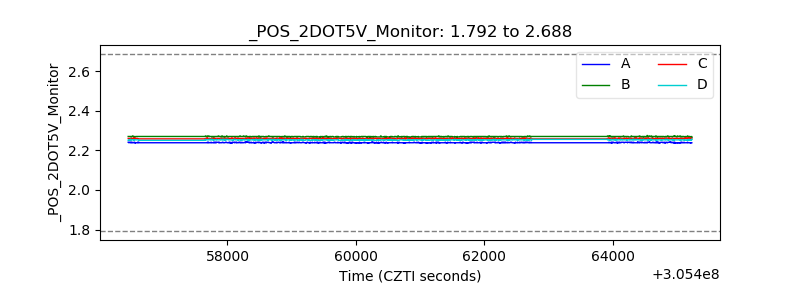 |
| +5 Volts monitor |  |
| _ROLL_ROT | 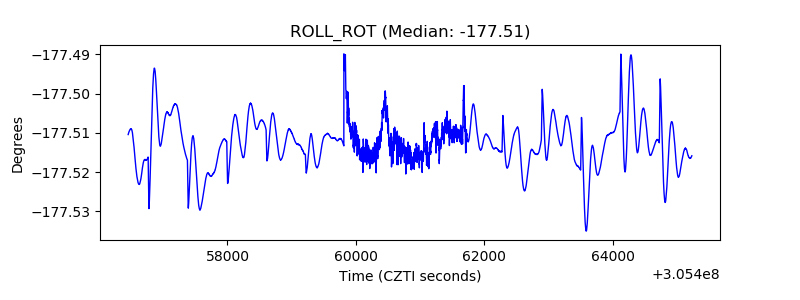 |
| _Roll_DEC | 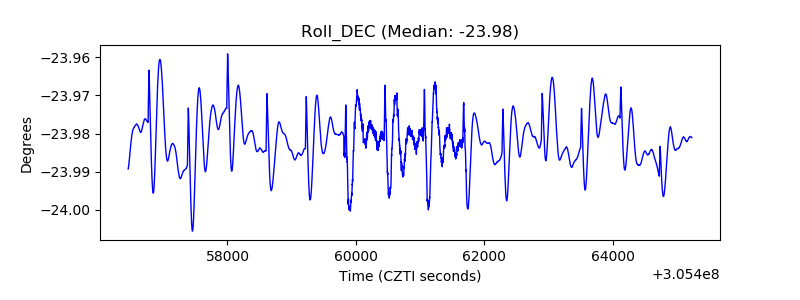 |
| _Roll_RA | 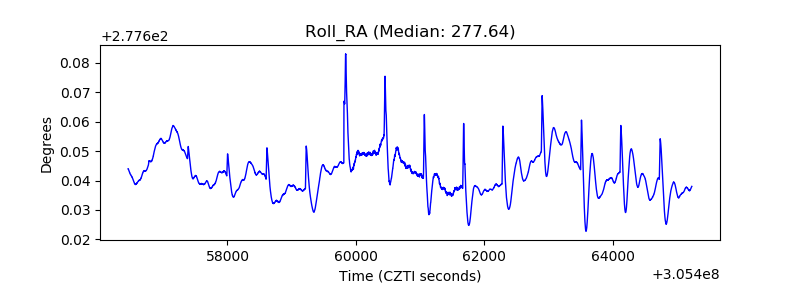 |
| Veto Counter | 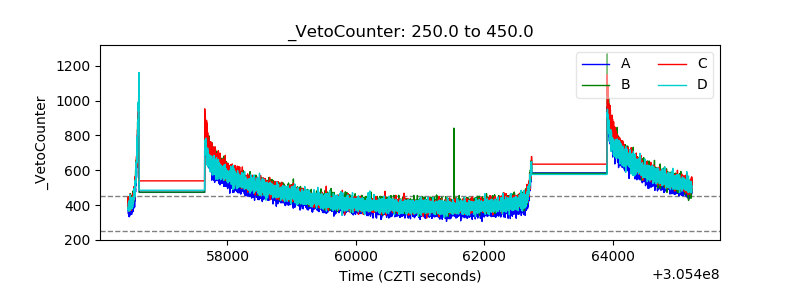 |