| Param | Original file | Final file |
|---|---|---|
| Filename | modeM0/AS1T03_140T01_9000003142_21305cztM0_level2.evt | modeM0/AS1T03_140T01_9000003142_21305cztM0_level2_quad_clean.evt |
| Size (bytes) | 1,244,937,600 | 260,303,040 |
| Size | 1.2 GB | 248.2 MB |
| Events in quadrant A | 9,568,764 | 1,729,644 |
| Events in quadrant B | 8,607,501 | 1,747,954 |
| Events in quadrant C | 8,124,186 | 1,675,277 |
| Events in quadrant D | 10,303,126 | 1,608,942 |
| Mode M0 | |||
|---|---|---|---|
| Quadrant | BADHDUFLAG | Total packets | Discarded packets |
| A | 0 | 38889 | 3 |
| B | 0 | 35831 | 3 |
| C | 0 | 34652 | 5 |
| D | 0 | 41342 | 3 |
| Mode M9 | |||
|---|---|---|---|
| Quadrant | BADHDUFLAG | Total packets | Discarded packets |
| A | 0 | 34 | 0 |
| B | 0 | 34 | 0 |
| C | 0 | 34 | 0 |
| D | 0 | 34 | 0 |
| Mode SS | |||
|---|---|---|---|
| Quadrant | BADHDUFLAG | Total packets | Discarded packets |
| A | 0 | 332 | 0 |
| B | 0 | 332 | 0 |
| C | 0 | 332 | 0 |
| D | 0 | 332 | 0 |
| Quadrant | Total seconds | Saturated seconds | Saturation percentage |
|---|---|---|---|
| A | 16277 | 348 | 2.137986% |
| B | 16278 | 209 | 1.283942% |
| C | 16277 | 278 | 1.707931% |
| D | 16278 | 621 | 3.814965% |
Noise dominated data is calculated using 1-second bins in cleaned event files. If a bin has >2000 counts, and if more than 50% of those come from <1% of pixels, then it is considered to be noise-dominated and hence unusable.
| Quadrant | # 1 sec bins | Bins with >0 counts | Bins with >2000 counts | High rate bins dominated by noise | Noise dominated (total time) | Noise dominated (detector-on time) | Marked lightcurve |
|---|---|---|---|---|---|---|---|
| A | 19727 | 16277 | 101 | 101 | 0.51% | 0.62% | 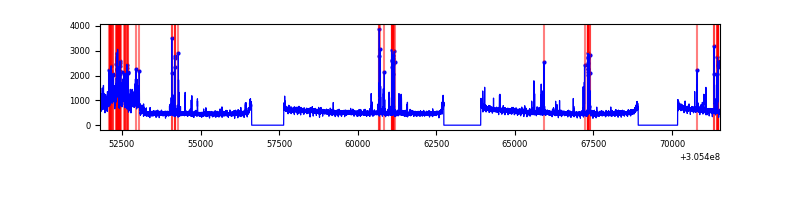 |
| B | 19728 | 16278 | 24 | 24 | 0.12% | 0.15% | 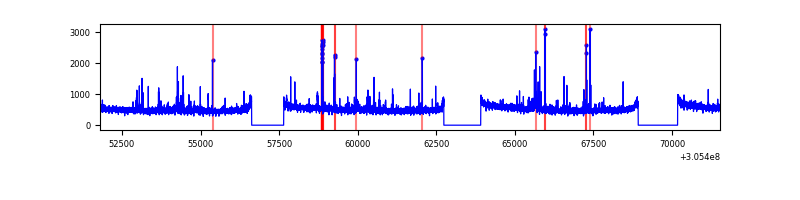 |
| C | 19728 | 16278 | 1 | 1 | 0.01% | 0.01% | 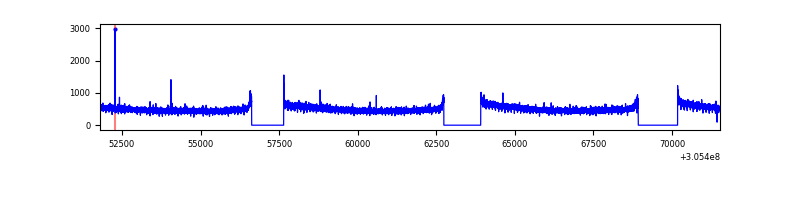 |
| D | 19728 | 16279 | 429 | 429 | 2.17% | 2.64% | 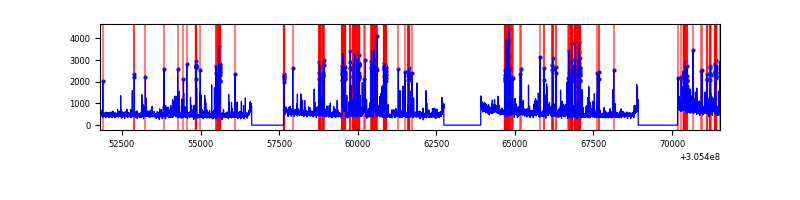 |
Top three noisy pixels from each quadrant. If the there are fewer than three noisy pixels in the level2.evt file, extra rows are filled as -1
| Pixel properties | Quadrant properties | ||||||
|---|---|---|---|---|---|---|---|
| Quadrant | DetID | PixID | Counts | Sigma | Mean | Median | Sigma |
| A | 15 | 236 | 968315 | 2314.25 | 2110 | 2071 | 417.5 |
| A | 9 | 143 | 155672 | 367.89 | 2110 | 2071 | 417.5 |
| A | 5 | 16 | 148891 | 351.65 | 2110 | 2071 | 417.5 |
| B | 3 | 64 | 96558 | 243.59 | 2085 | 2039 | 388.0 |
| B | 0 | 230 | 93042 | 234.53 | 2085 | 2039 | 388.0 |
| B | 0 | 190 | 76573 | 192.08 | 2085 | 2039 | 388.0 |
| C | 14 | 238 | 317428 | 686.9 | 1994 | 2014 | 459.2 |
| C | 10 | 23 | 18918 | 36.81 | 1994 | 2014 | 459.2 |
| C | 13 | 61 | 13870 | 25.82 | 1994 | 2014 | 459.2 |
| D | 1 | 52 | 1696765 | 3475.99 | 2018 | 1961 | 487.6 |
| D | 12 | 235 | 209110 | 424.86 | 2018 | 1961 | 487.6 |
| D | 13 | 153 | 206062 | 418.6 | 2018 | 1961 | 487.6 |
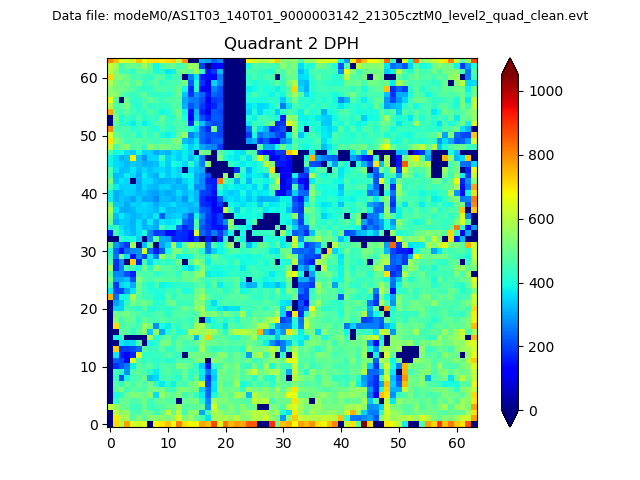
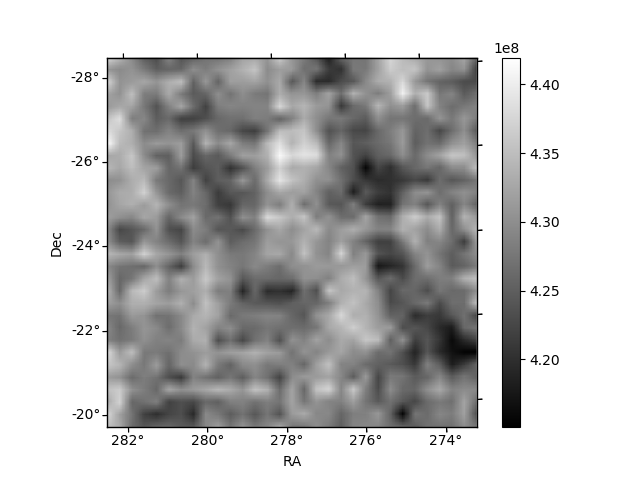
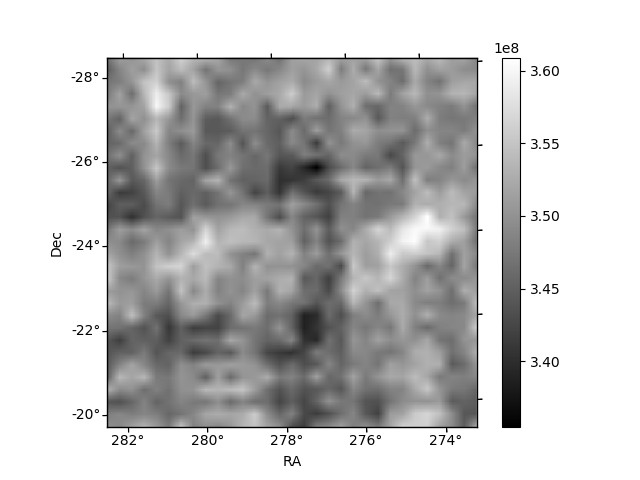
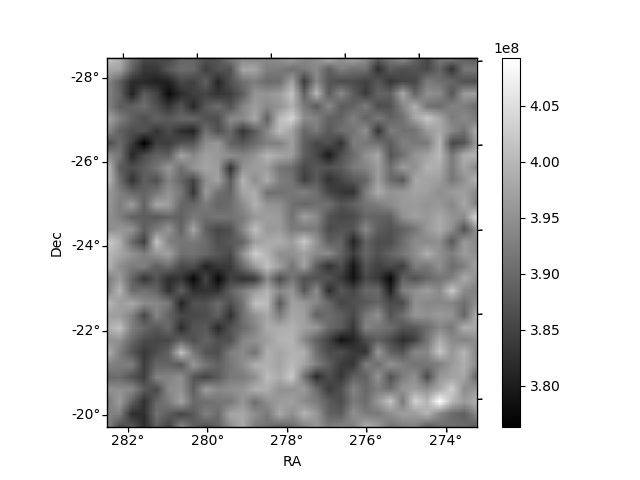
Histogram calculated using DETX and DETY for each event in the final _common_clean file
| Quadrant A | 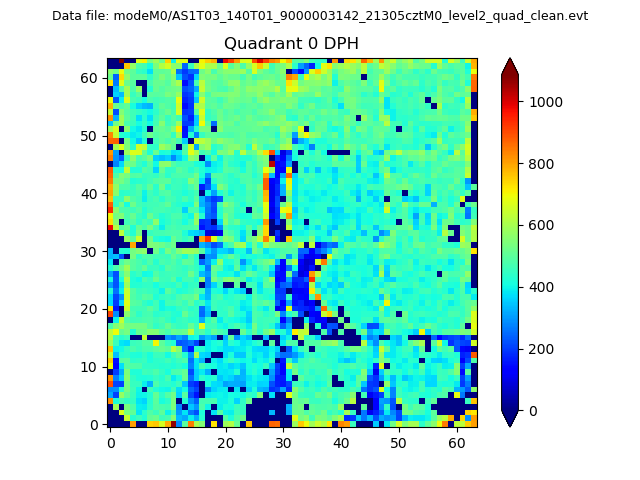 |
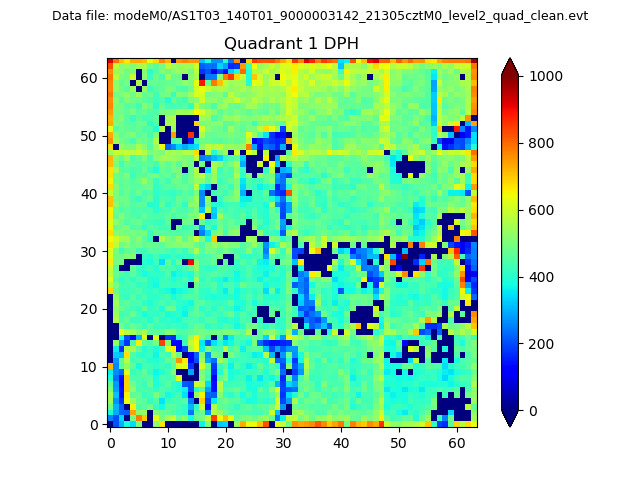 |
Quadrant B |
|---|---|---|---|
| Quadrant D | 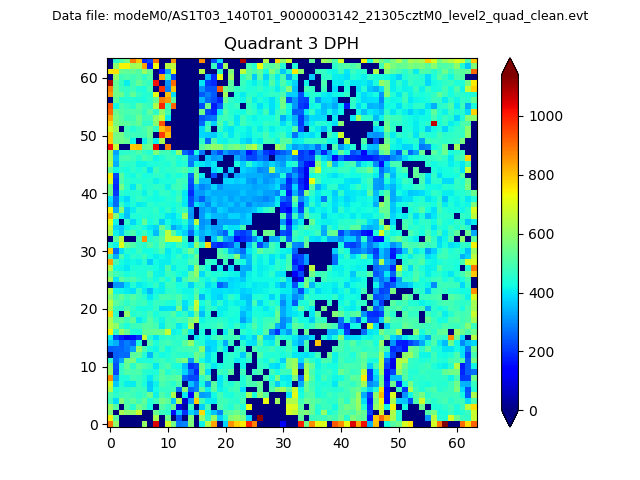 |
 |
Quadrant C |
| Plot type | Count rate plots | Images |
|---|---|---|
| Comparison with Poisson distribution Blue bars denote a histogram of data divided into 1 sec bins. Red curve is a Poisson curve with rate = median count rate of data. |
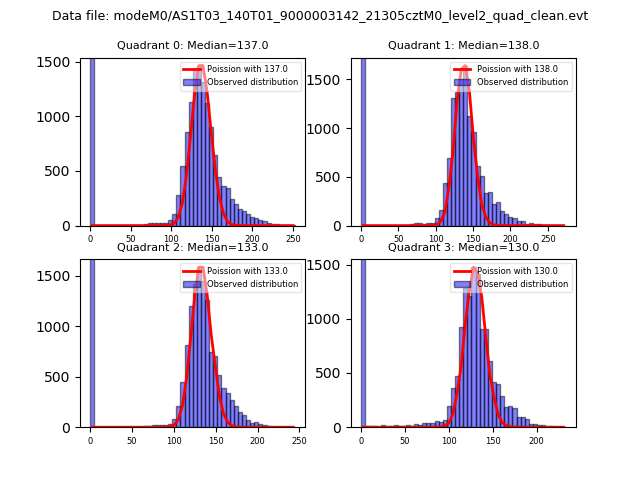 |
 |
| Quadrant-wise count rates Data is divided into 100 sec bins |
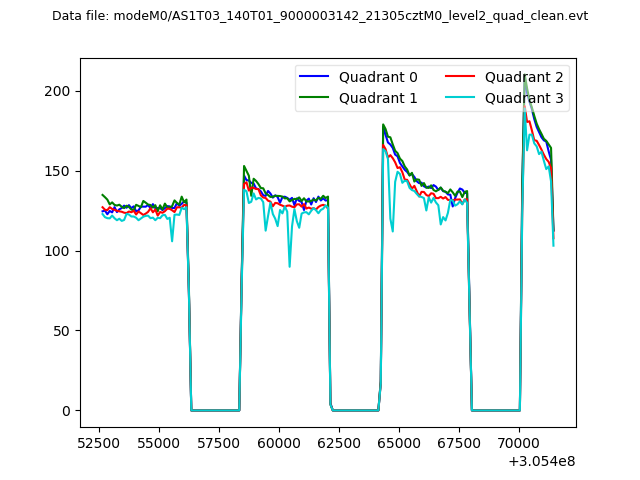 |
|
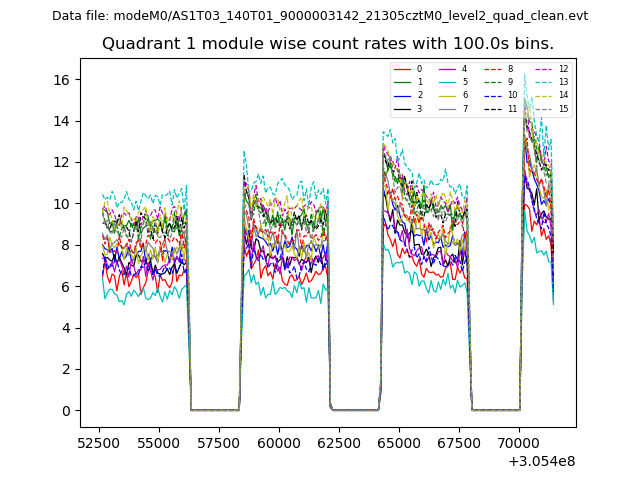
| Module-wise count rates for Quadrant A Data is divided into 100 sec bins |
 |
 |
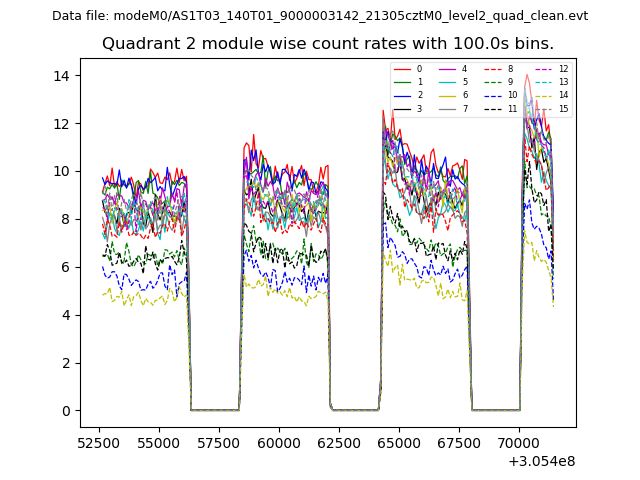
| Module-wise count rates for Quadrant B Data is divided into 100 sec bins |
 |
 |
| Module-wise count rates for Quadrant C Data is divided into 100 sec bins |
 |
 |
| Module-wise count rates for Quadrant D Data is divided into 100 sec bins |
 |
 |
| Parameter | Plot |
|---|---|
| CZT HV Monitor | 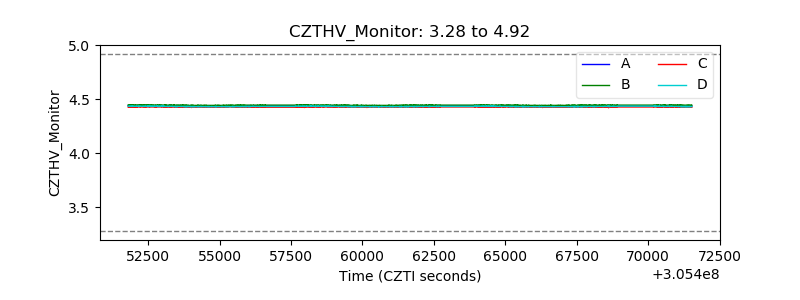 |
| D_VDD |  |
| Temperature 1 | 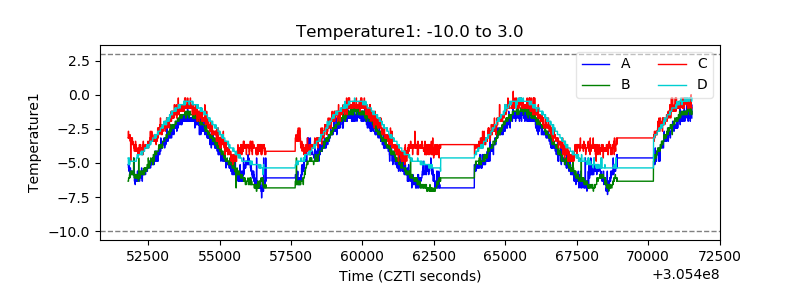 |
| Veto HV Monitor | 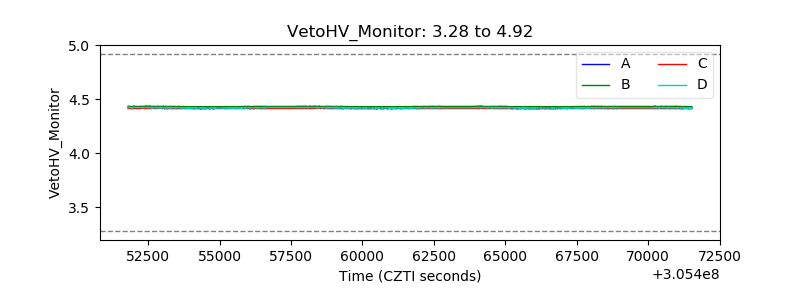 |
| Veto LLD |  |
| Alpha Counter | 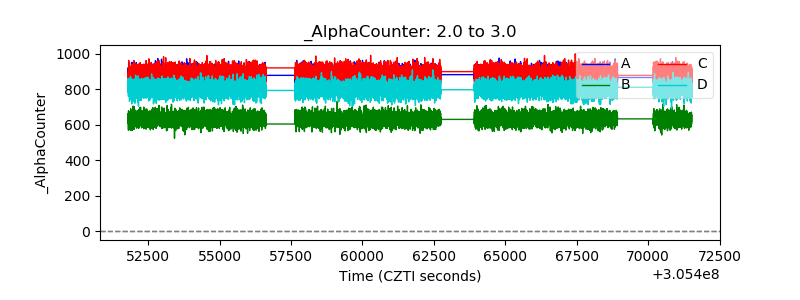 |
| _CPM_Rate | 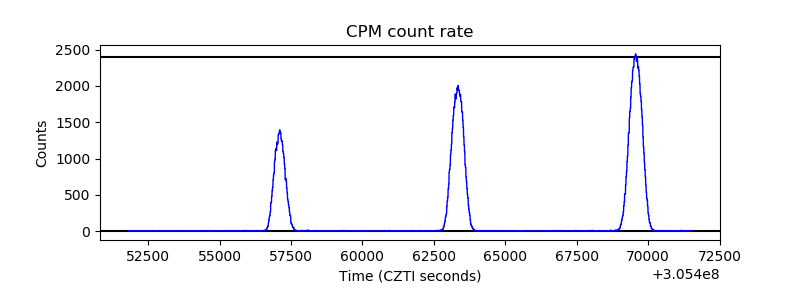 |
| CZT Counter | 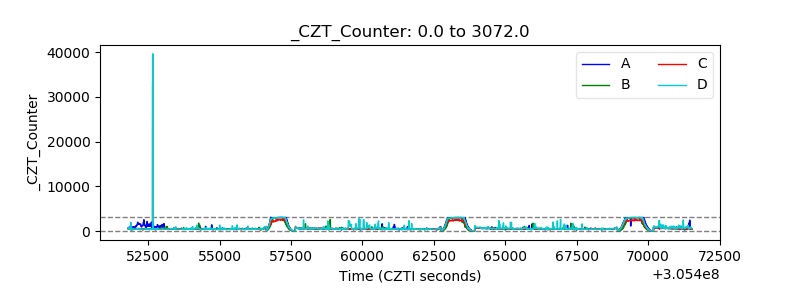 |
| +2.5 Volts monitor |  |
| +5 Volts monitor |  |
| _ROLL_ROT |  |
| _Roll_DEC | 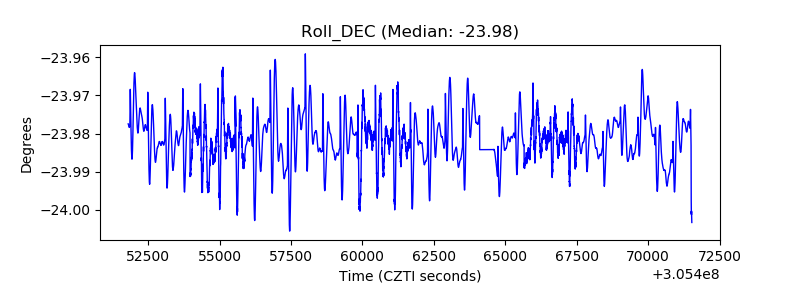 |
| _Roll_RA | 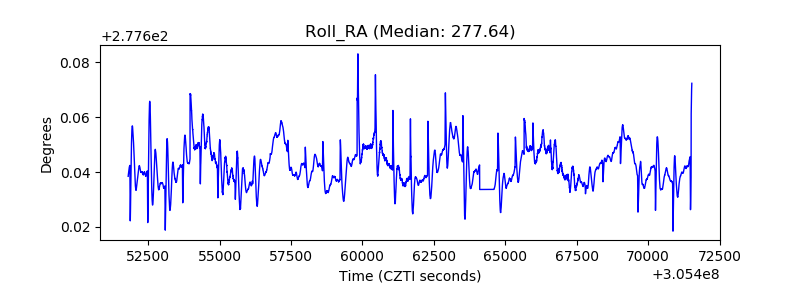 |
| Veto Counter | 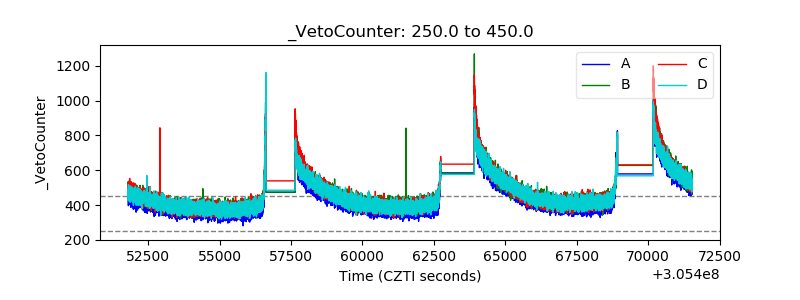 |