| Param | Original file | Final file |
|---|---|---|
| Filename | modeM0/AS1T03_140T01_9000003142_21306cztM0_level2.evt | modeM0/AS1T03_140T01_9000003142_21306cztM0_level2_quad_clean.evt |
| Size (bytes) | 536,166,720 | 106,260,480 |
| Size | 511.3 MB | 101.3 MB |
| Events in quadrant A | 3,279,134 | 728,144 |
| Events in quadrant B | 3,207,487 | 733,284 |
| Events in quadrant C | 3,039,712 | 694,460 |
| Events in quadrant D | 6,312,289 | 650,397 |
| Mode M0 | |||
|---|---|---|---|
| Quadrant | BADHDUFLAG | Total packets | Discarded packets |
| A | 0 | 13502 | 1 |
| B | 0 | 13275 | 1 |
| C | 0 | 12676 | 1 |
| D | 0 | 22960 | 1 |
| Mode M9 | |||
|---|---|---|---|
| Quadrant | BADHDUFLAG | Total packets | Discarded packets |
| A | 0 | 13 | 0 |
| B | 0 | 13 | 0 |
| C | 0 | 13 | 0 |
| D | 0 | 13 | 0 |
| Mode SS | |||
|---|---|---|---|
| Quadrant | BADHDUFLAG | Total packets | Discarded packets |
| A | 0 | 120 | 0 |
| B | 0 | 120 | 0 |
| C | 0 | 120 | 0 |
| D | 0 | 120 | 0 |
| Quadrant | Total seconds | Saturated seconds | Saturation percentage |
|---|---|---|---|
| A | 5892 | 113 | 1.917855% |
| B | 5893 | 67 | 1.136942% |
| C | 5892 | 90 | 1.527495% |
| D | 5892 | 708 | 12.016293% |
Noise dominated data is calculated using 1-second bins in cleaned event files. If a bin has >2000 counts, and if more than 50% of those come from <1% of pixels, then it is considered to be noise-dominated and hence unusable.
| Quadrant | # 1 sec bins | Bins with >0 counts | Bins with >2000 counts | High rate bins dominated by noise | Noise dominated (total time) | Noise dominated (detector-on time) | Marked lightcurve |
|---|---|---|---|---|---|---|---|
| A | 7232 | 5892 | 50 | 50 | 0.69% | 0.85% | 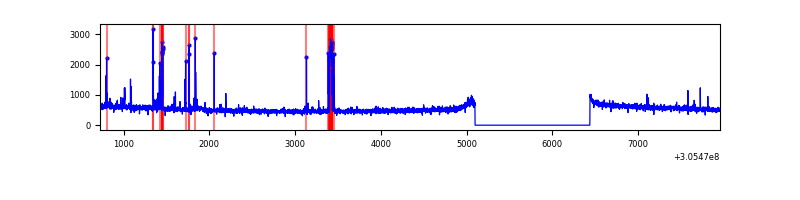 |
| B | 7233 | 5893 | 10 | 10 | 0.14% | 0.17% | 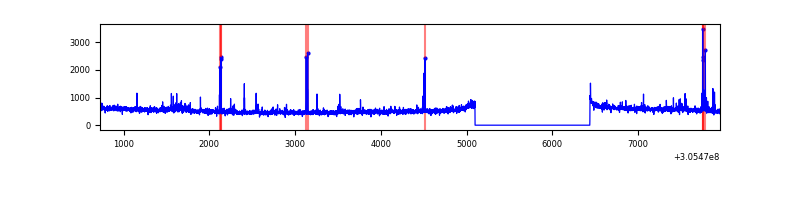 |
| C | 7232 | 5893 | 0 | 0 | 0.00% | 0.00% | 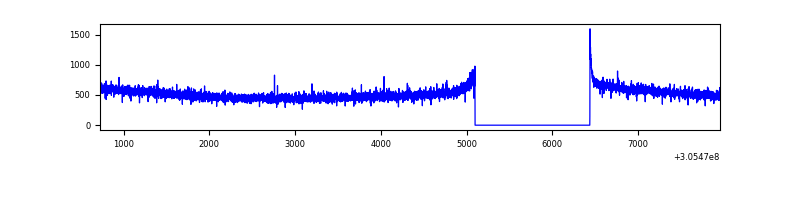 |
| D | 7232 | 5892 | 701 | 701 | 9.69% | 11.90% | 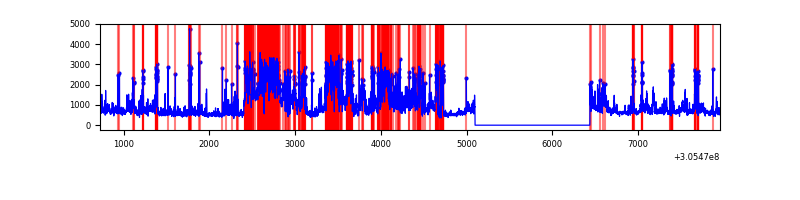 |
Top three noisy pixels from each quadrant. If the there are fewer than three noisy pixels in the level2.evt file, extra rows are filled as -1
| Pixel properties | Quadrant properties | ||||||
|---|---|---|---|---|---|---|---|
| Quadrant | DetID | PixID | Counts | Sigma | Mean | Median | Sigma |
| A | 15 | 174 | 169957 | 1065.46 | 795 | 784 | 158.8 |
| A | 9 | 143 | 15564 | 93.09 | 795 | 784 | 158.8 |
| A | 12 | 96 | 11371 | 66.68 | 795 | 784 | 158.8 |
| B | 0 | 190 | 43946 | 290.44 | 783 | 766 | 148.7 |
| B | 3 | 64 | 31199 | 204.7 | 783 | 766 | 148.7 |
| B | 0 | 189 | 21327 | 138.3 | 783 | 766 | 148.7 |
| C | 14 | 238 | 120536 | 698.75 | 744 | 750 | 171.4 |
| C | 0 | 10 | 6555 | 33.86 | 744 | 750 | 171.4 |
| C | 3 | 233 | 5932 | 30.23 | 744 | 750 | 171.4 |
| D | 1 | 52 | 2475433 | 13783.27 | 741 | 722 | 179.5 |
| D | 13 | 174 | 468834 | 2607.22 | 741 | 722 | 179.5 |
| D | 12 | 235 | 288665 | 1603.74 | 741 | 722 | 179.5 |
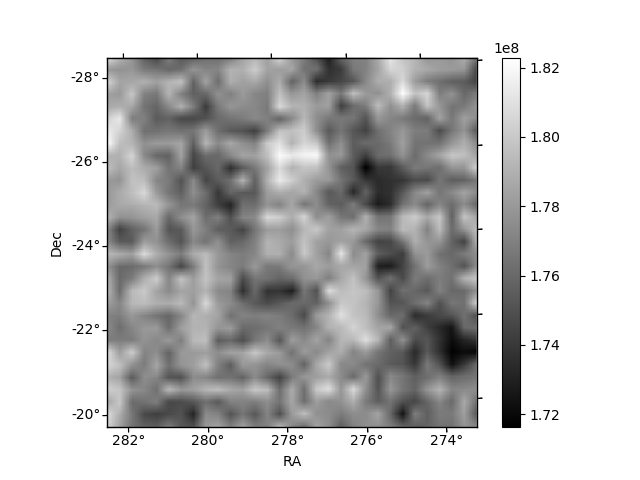
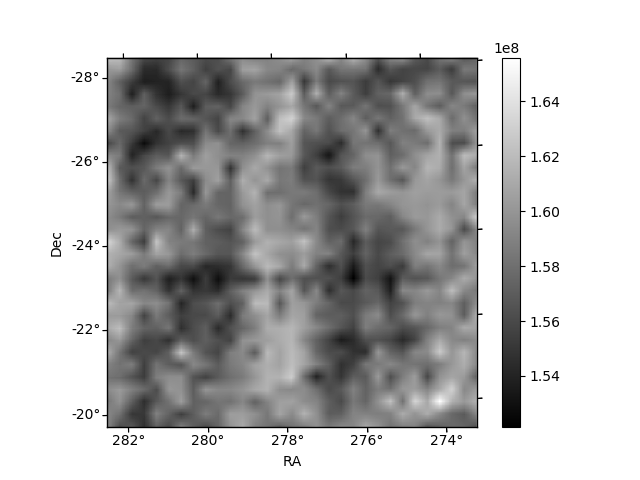
Histogram calculated using DETX and DETY for each event in the final _common_clean file
| Quadrant A | 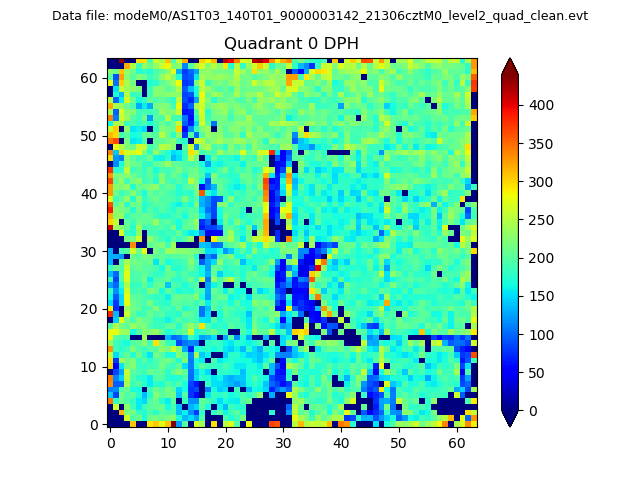 |
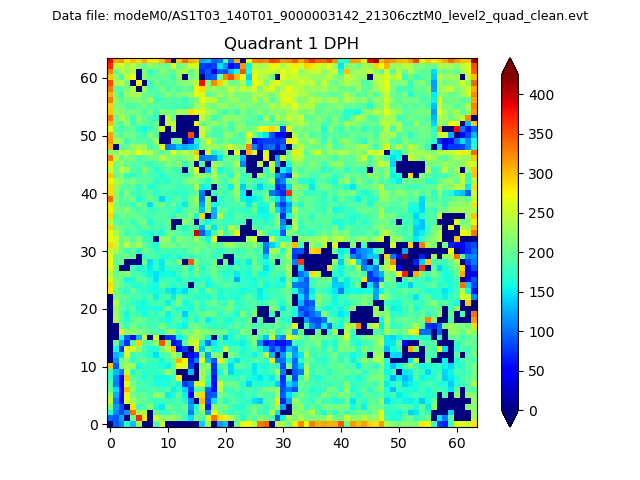 |
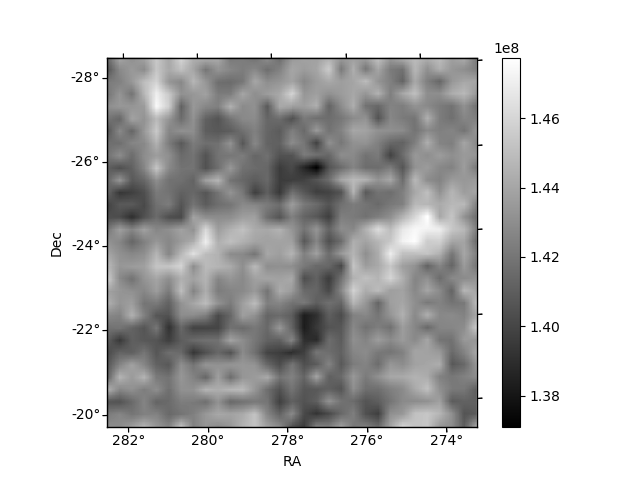
Quadrant B |
|---|---|---|---|
| Quadrant D | 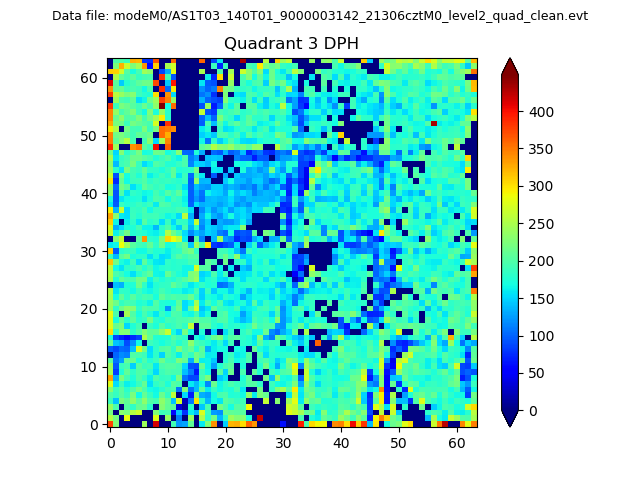 |
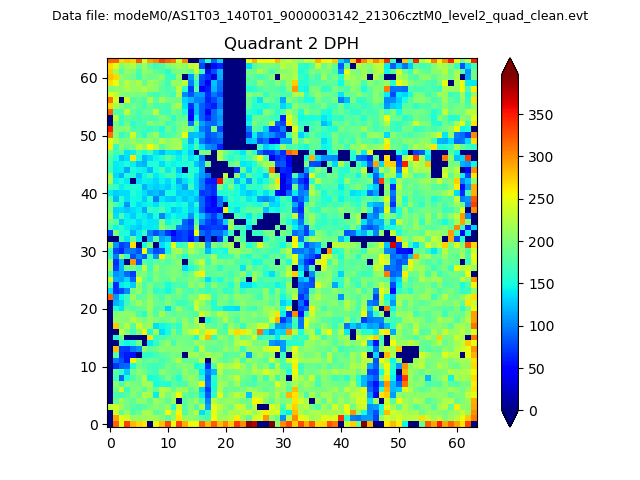 |
Quadrant C |
| Plot type | Count rate plots | Images |
|---|---|---|
| Comparison with Poisson distribution Blue bars denote a histogram of data divided into 1 sec bins. Red curve is a Poisson curve with rate = median count rate of data. |
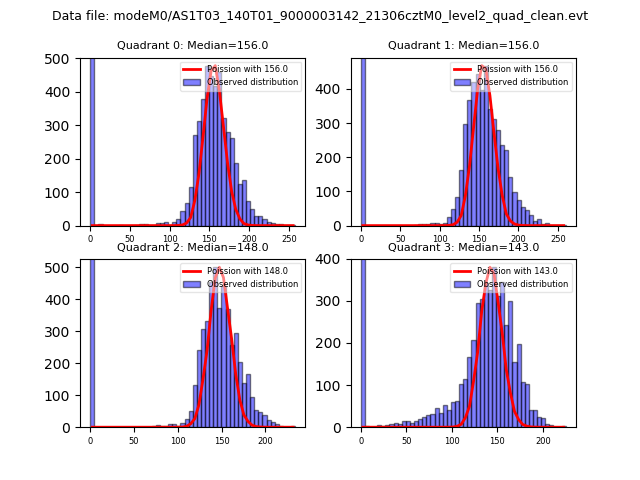 |
 |
| Quadrant-wise count rates Data is divided into 100 sec bins |
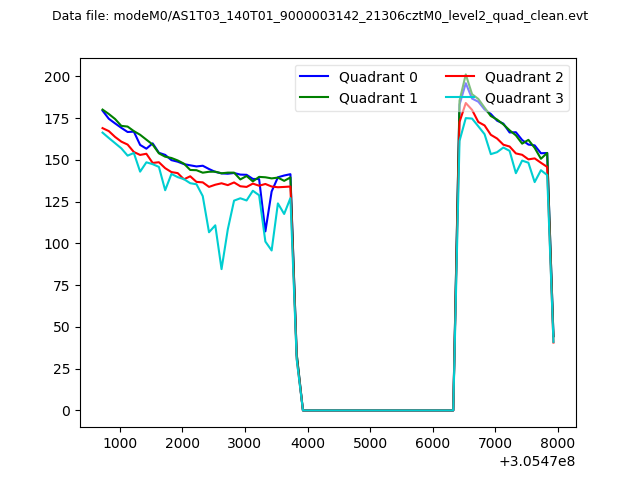 |
|
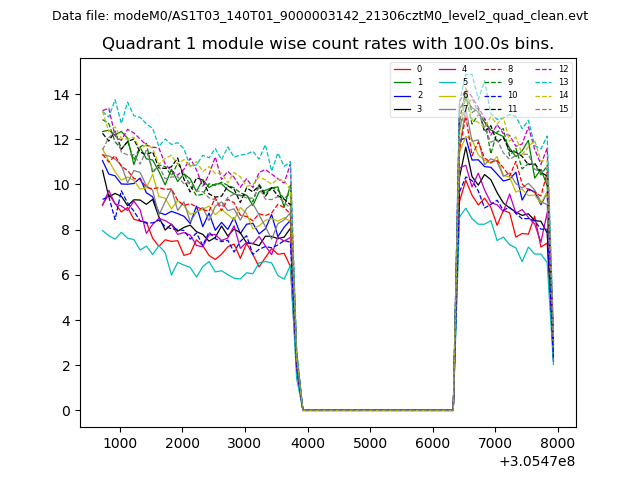
| Module-wise count rates for Quadrant A Data is divided into 100 sec bins |
 |
 |
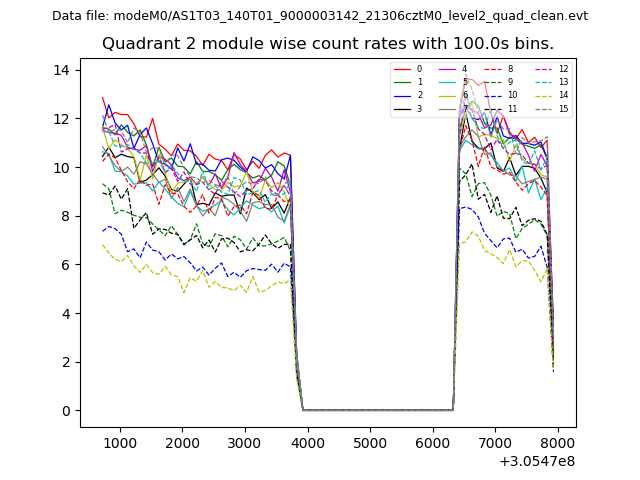
| Module-wise count rates for Quadrant B Data is divided into 100 sec bins |
 |
 |
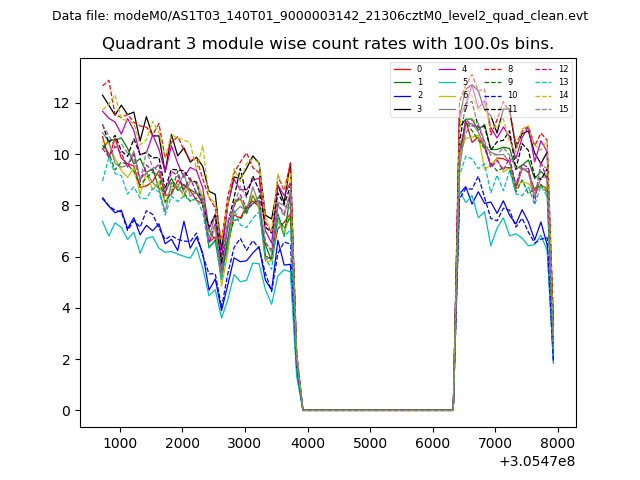
| Module-wise count rates for Quadrant C Data is divided into 100 sec bins |
 |
 |
| Module-wise count rates for Quadrant D Data is divided into 100 sec bins |
 |
 |
| Parameter | Plot |
|---|---|
| CZT HV Monitor | 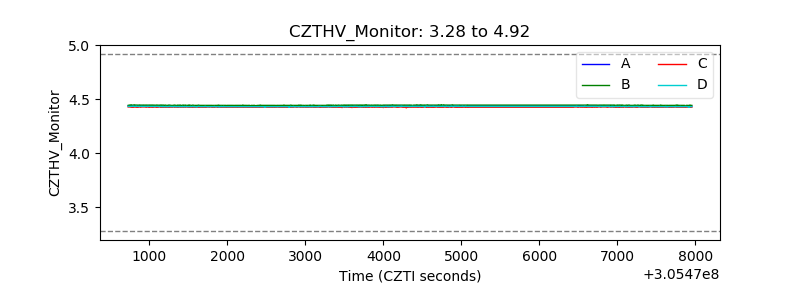 |
| D_VDD | 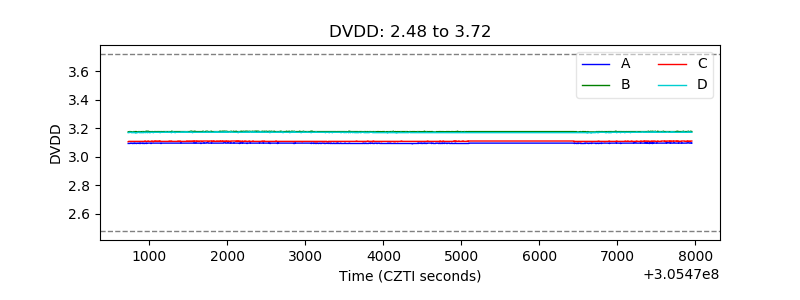 |
| Temperature 1 | 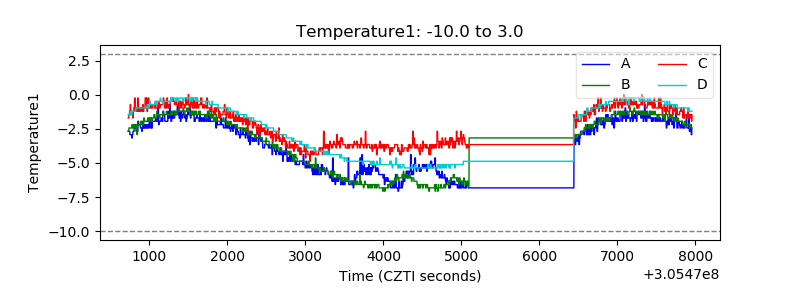 |
| Veto HV Monitor | 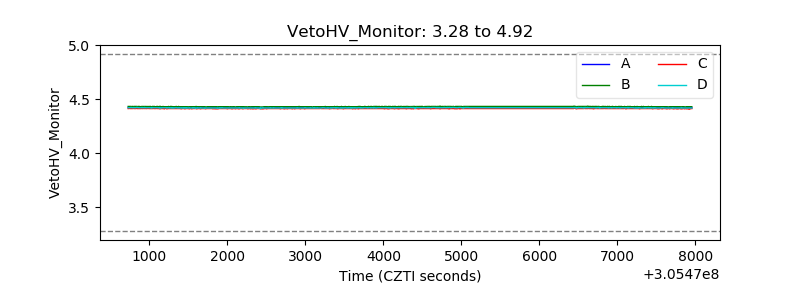 |
| Veto LLD | 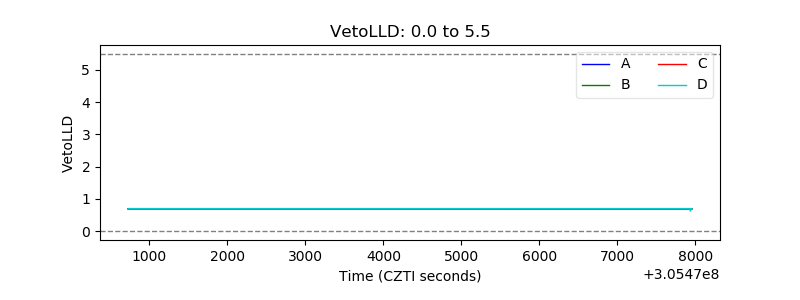 |
| Alpha Counter | 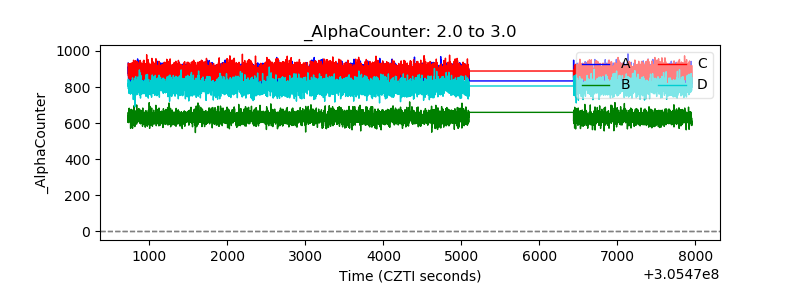 |
| _CPM_Rate | 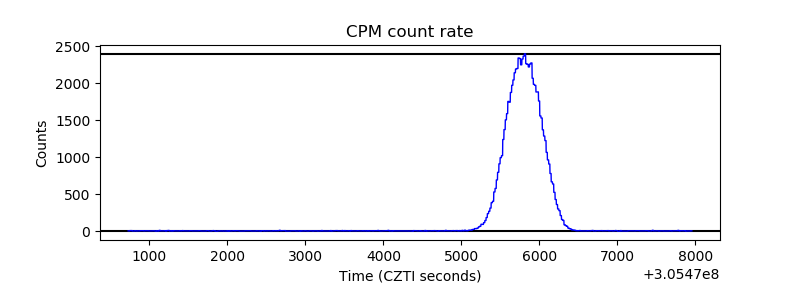 |
| CZT Counter | 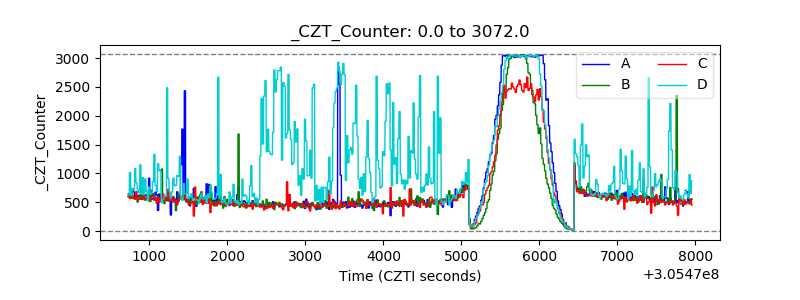 |
| +2.5 Volts monitor |  |
| +5 Volts monitor |  |
| _ROLL_ROT | 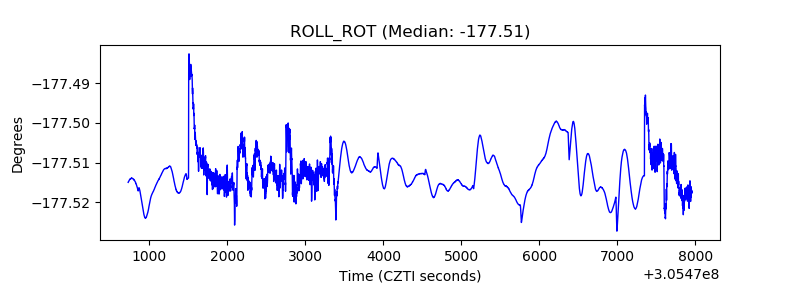 |
| _Roll_DEC | 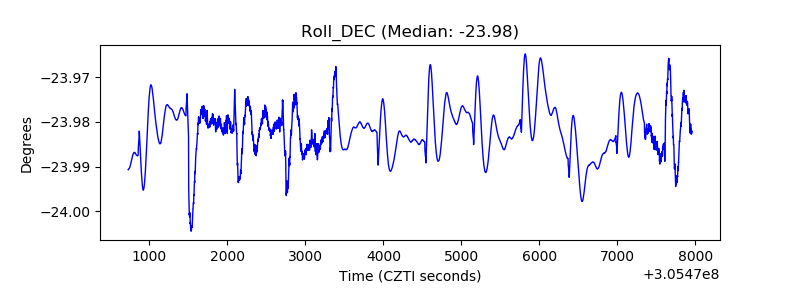 |
| _Roll_RA | 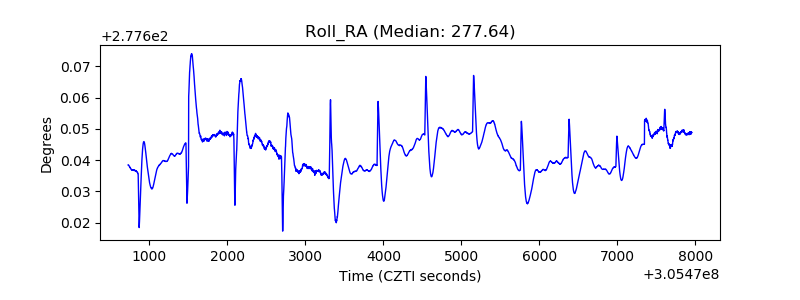 |
| Veto Counter | 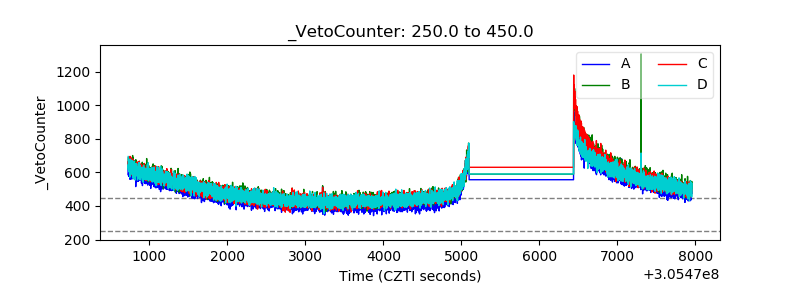 |