| Param | Original file | Final file |
|---|---|---|
| Filename | modeM0/AS1T03_140T01_9000003142_21307cztM0_level2.evt | modeM0/AS1T03_140T01_9000003142_21307cztM0_level2_quad_clean.evt |
| Size (bytes) | 486,904,320 | 101,977,920 |
| Size | 464.3 MB | 97.3 MB |
| Events in quadrant A | 3,238,553 | 688,280 |
| Events in quadrant B | 3,320,333 | 687,957 |
| Events in quadrant C | 3,161,474 | 652,685 |
| Events in quadrant D | 4,611,166 | 633,056 |
| Mode M0 | |||
|---|---|---|---|
| Quadrant | BADHDUFLAG | Total packets | Discarded packets |
| A | 0 | 13479 | 1 |
| B | 0 | 13695 | 1 |
| C | 0 | 13142 | 1 |
| D | 0 | 18125 | 3 |
| Mode M9 | |||
|---|---|---|---|
| Quadrant | BADHDUFLAG | Total packets | Discarded packets |
| A | 0 | 14 | 0 |
| B | 0 | 14 | 0 |
| C | 0 | 14 | 0 |
| D | 0 | 14 | 0 |
| Mode SS | |||
|---|---|---|---|
| Quadrant | BADHDUFLAG | Total packets | Discarded packets |
| A | 0 | 124 | 0 |
| B | 0 | 124 | 0 |
| C | 0 | 124 | 0 |
| D | 0 | 124 | 0 |
| Quadrant | Total seconds | Saturated seconds | Saturation percentage |
|---|---|---|---|
| A | 6110 | 72 | 1.178396% |
| B | 6111 | 81 | 1.325479% |
| C | 6111 | 95 | 1.554574% |
| D | 6110 | 182 | 2.978723% |
Noise dominated data is calculated using 1-second bins in cleaned event files. If a bin has >2000 counts, and if more than 50% of those come from <1% of pixels, then it is considered to be noise-dominated and hence unusable.
| Quadrant | # 1 sec bins | Bins with >0 counts | Bins with >2000 counts | High rate bins dominated by noise | Noise dominated (total time) | Noise dominated (detector-on time) | Marked lightcurve |
|---|---|---|---|---|---|---|---|
| A | 7465 | 6110 | 5 | 5 | 0.07% | 0.08% | 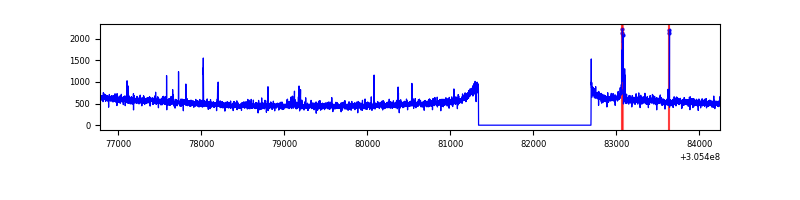 |
| B | 7466 | 6112 | 14 | 14 | 0.19% | 0.23% | 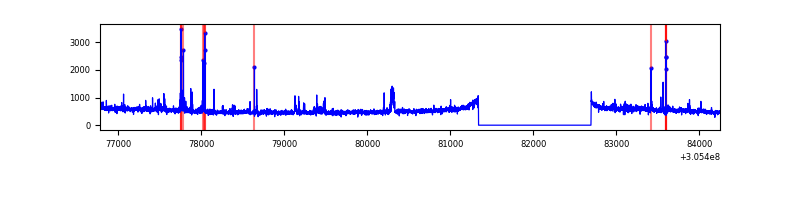 |
| C | 7466 | 6112 | 5 | 5 | 0.07% | 0.08% | 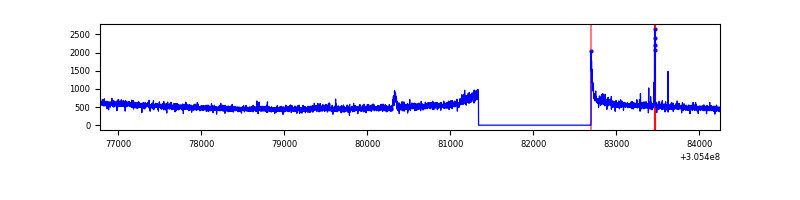 |
| D | 7465 | 6110 | 109 | 109 | 1.46% | 1.78% | 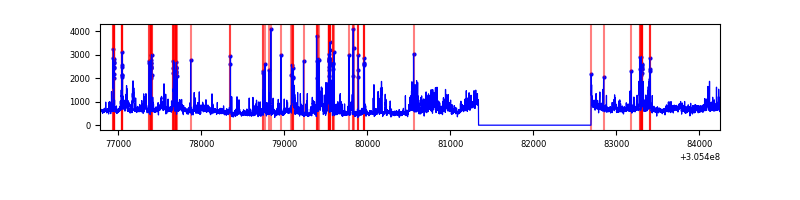 |
Top three noisy pixels from each quadrant. If the there are fewer than three noisy pixels in the level2.evt file, extra rows are filled as -1
| Pixel properties | Quadrant properties | ||||||
|---|---|---|---|---|---|---|---|
| Quadrant | DetID | PixID | Counts | Sigma | Mean | Median | Sigma |
| A | 15 | 174 | 47384 | 291.28 | 810 | 798 | 159.9 |
| A | 15 | 236 | 43694 | 268.21 | 810 | 798 | 159.9 |
| A | 9 | 143 | 10467 | 60.46 | 810 | 798 | 159.9 |
| B | 0 | 189 | 49403 | 323.69 | 799 | 782 | 150.2 |
| B | 0 | 190 | 45132 | 295.26 | 799 | 782 | 150.2 |
| B | 0 | 230 | 44151 | 288.73 | 799 | 782 | 150.2 |
| C | 14 | 238 | 120961 | 687.04 | 755 | 762 | 175.0 |
| C | 3 | 233 | 63835 | 360.51 | 755 | 762 | 175.0 |
| C | 10 | 23 | 17545 | 95.93 | 755 | 762 | 175.0 |
| D | 13 | 174 | 614066 | 3328.52 | 769 | 748 | 184.3 |
| D | 12 | 235 | 442140 | 2395.46 | 769 | 748 | 184.3 |
| D | 1 | 52 | 300462 | 1626.57 | 769 | 748 | 184.3 |
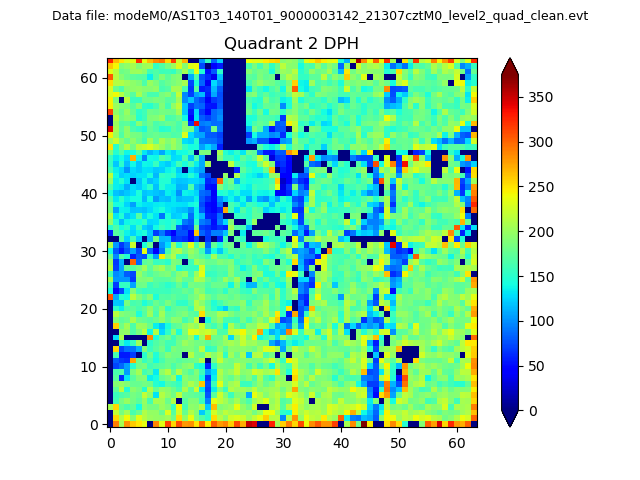
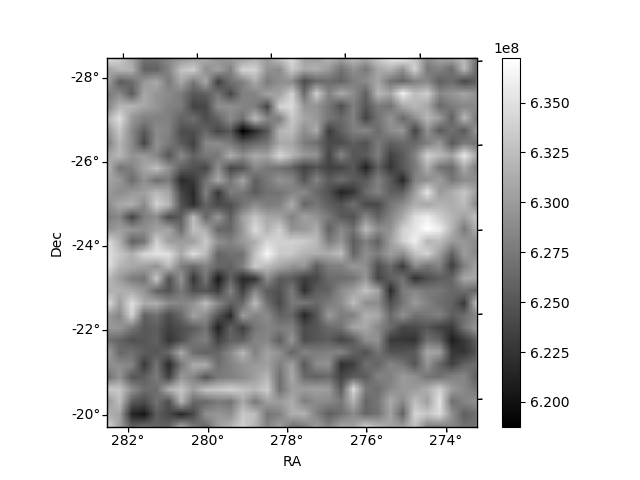
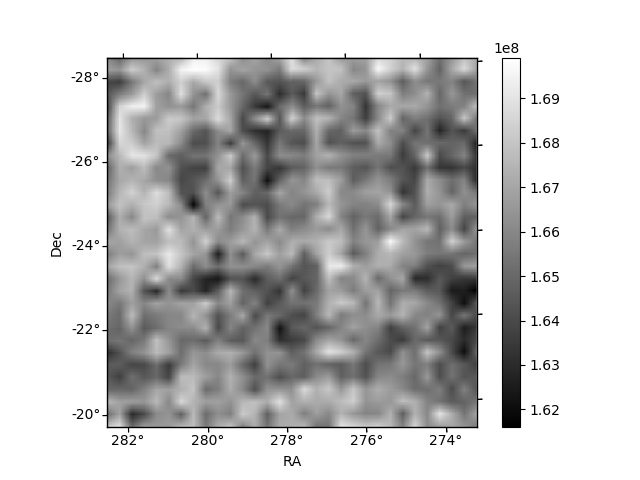
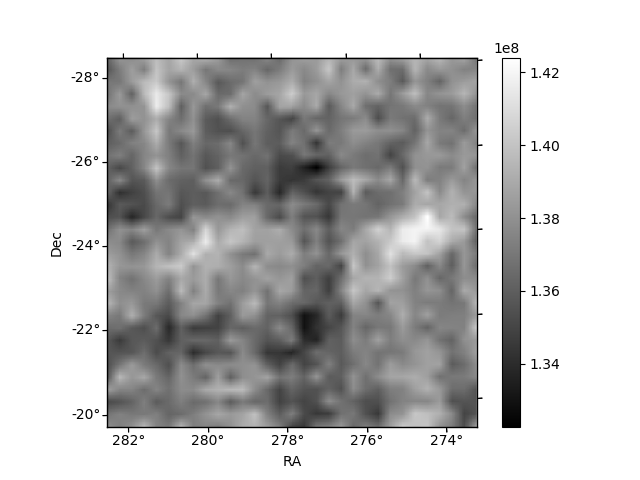
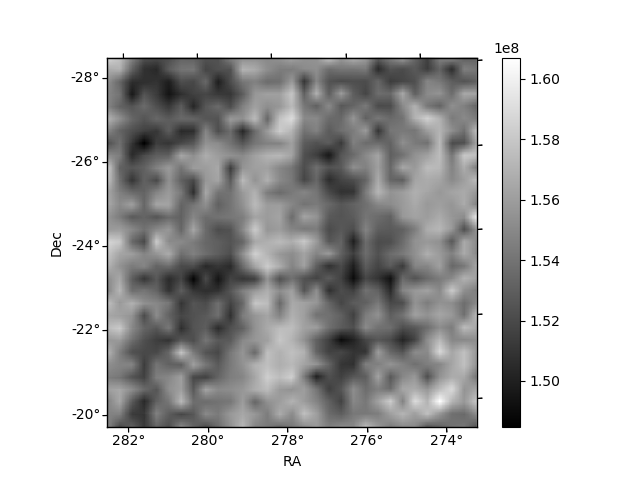
Histogram calculated using DETX and DETY for each event in the final _common_clean file
| Quadrant A | 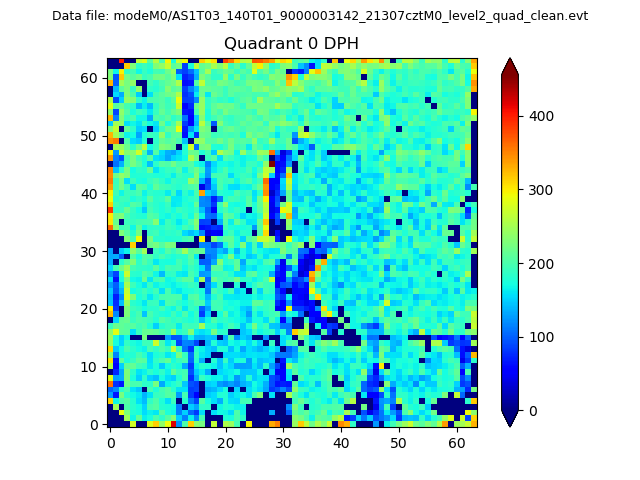 |
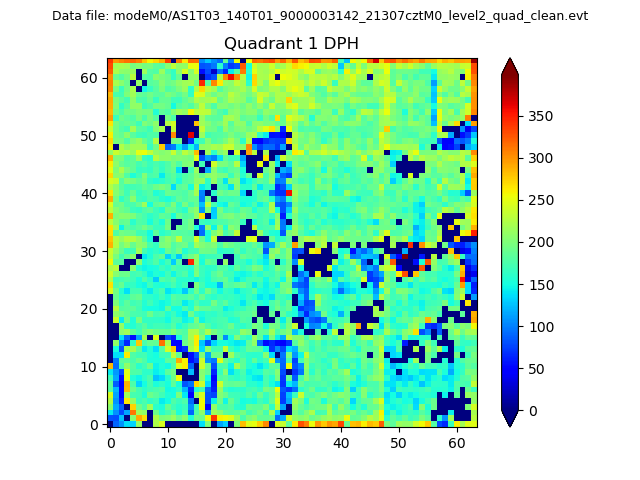 |
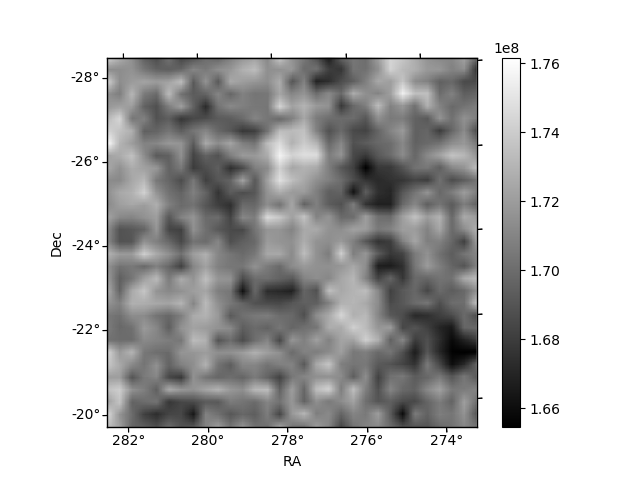
Quadrant B |
|---|---|---|---|
| Quadrant D | 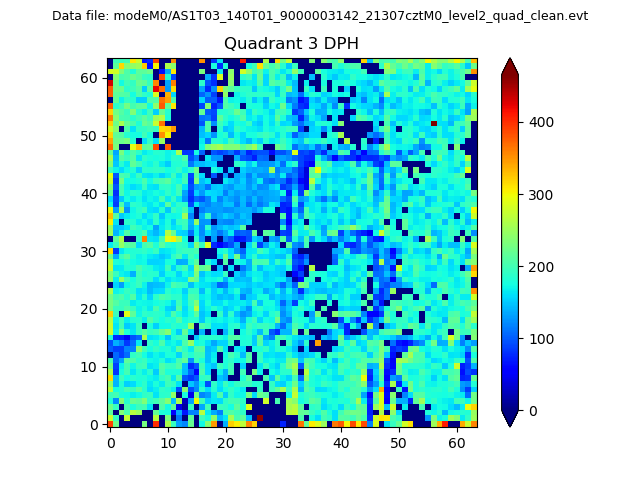 |
 |
Quadrant C |
| Plot type | Count rate plots | Images |
|---|---|---|
| Comparison with Poisson distribution Blue bars denote a histogram of data divided into 1 sec bins. Red curve is a Poisson curve with rate = median count rate of data. |
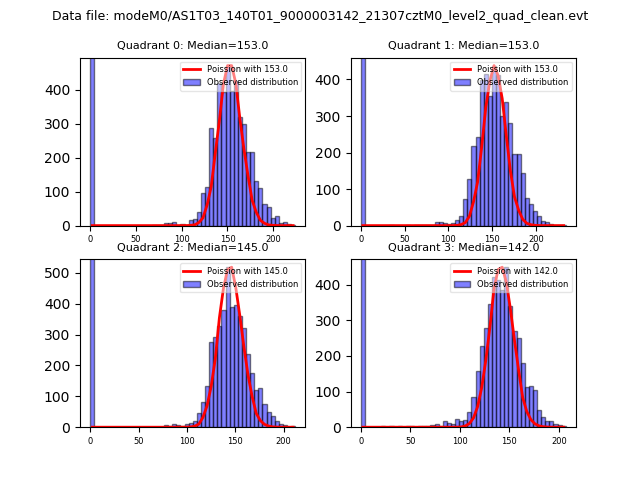 |
 |
| Quadrant-wise count rates Data is divided into 100 sec bins |
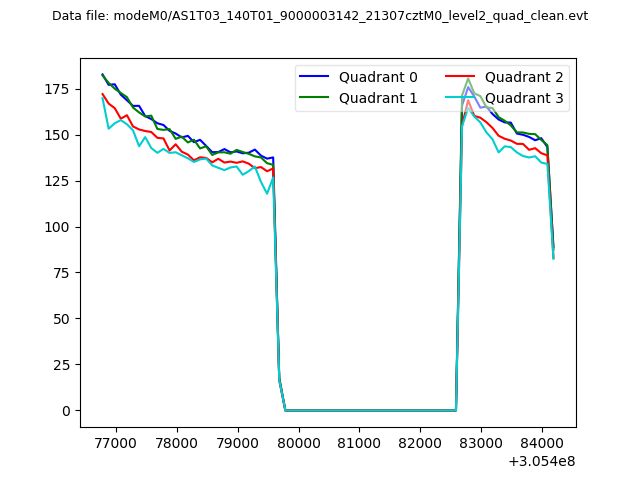 |
|
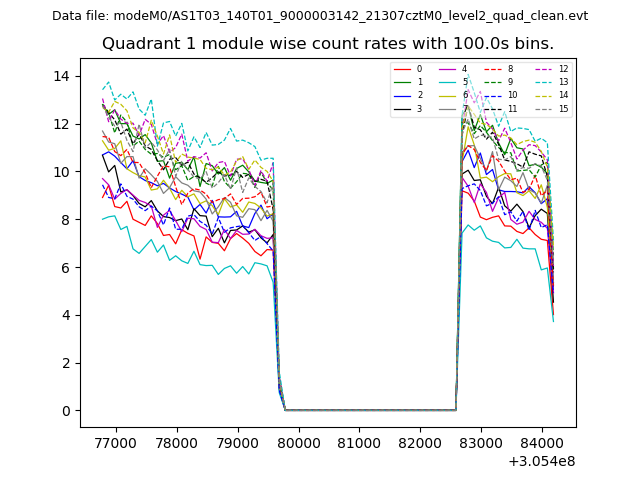
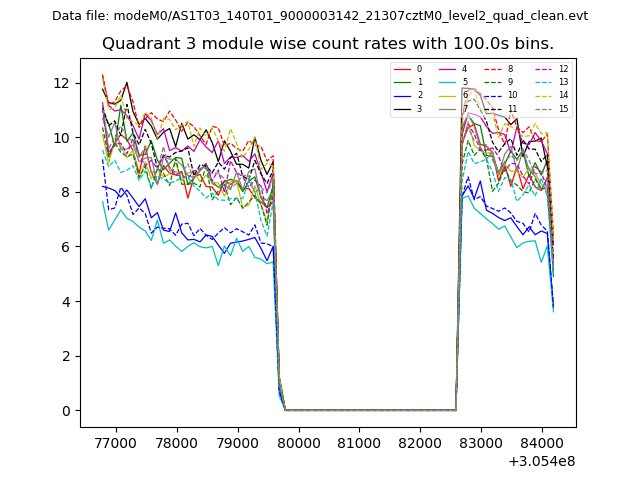
| Module-wise count rates for Quadrant A Data is divided into 100 sec bins |
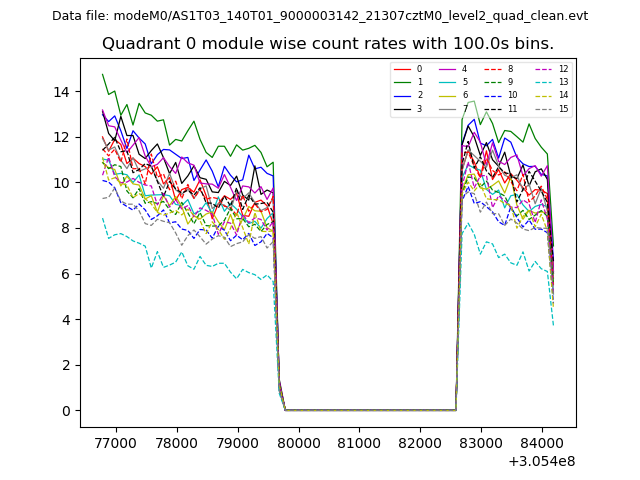 |
 |
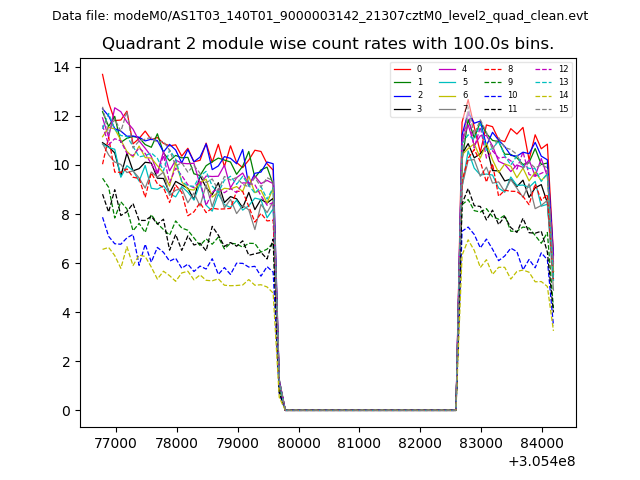
| Module-wise count rates for Quadrant B Data is divided into 100 sec bins |
 |
 |
| Module-wise count rates for Quadrant C Data is divided into 100 sec bins |
 |
 |
| Module-wise count rates for Quadrant D Data is divided into 100 sec bins |
 |
 |
| Parameter | Plot |
|---|---|
| CZT HV Monitor | 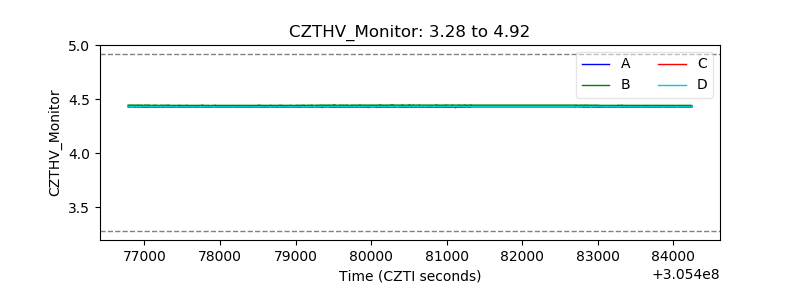 |
| D_VDD | 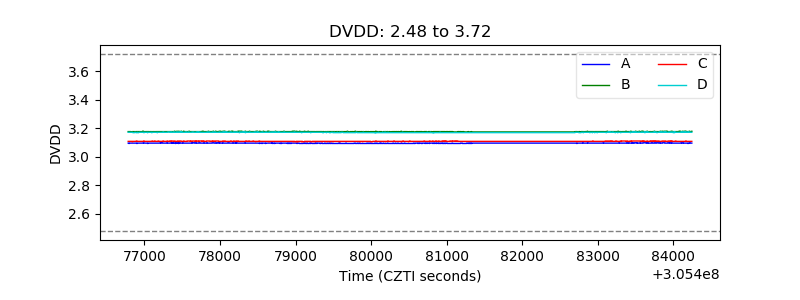 |
| Temperature 1 | 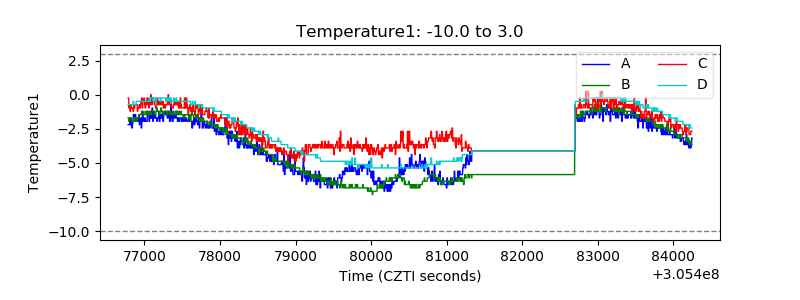 |
| Veto HV Monitor | 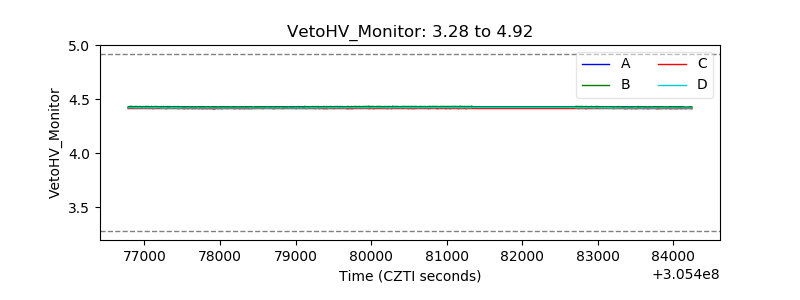 |
| Veto LLD | 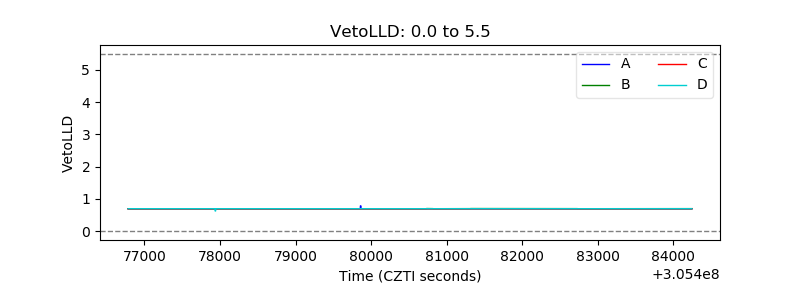 |
| Alpha Counter | 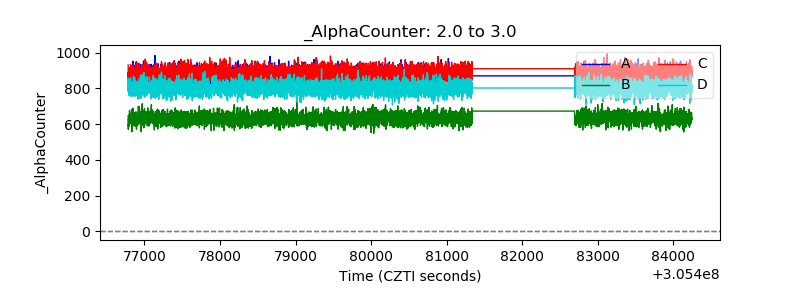 |
| _CPM_Rate | 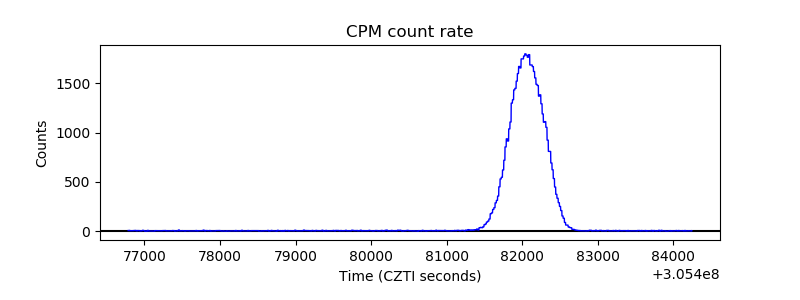 |
| CZT Counter | 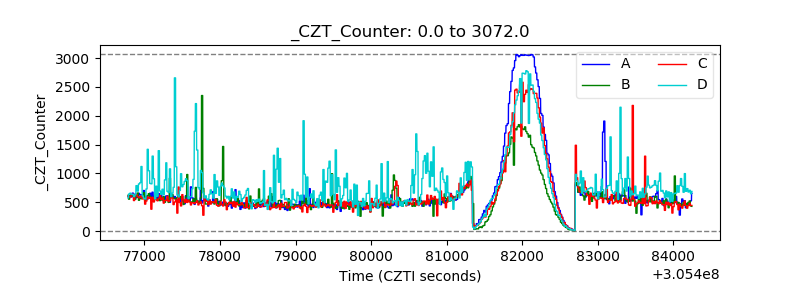 |
| +2.5 Volts monitor |  |
| +5 Volts monitor |  |
| _ROLL_ROT | 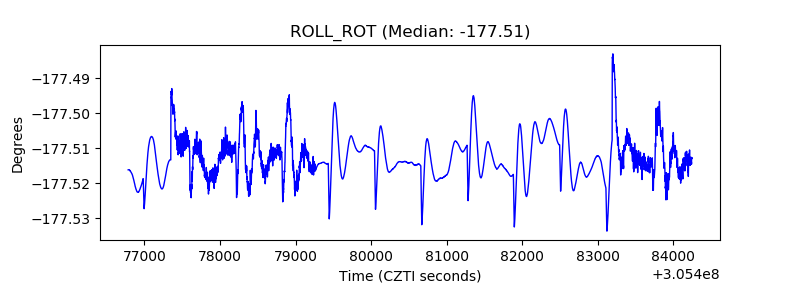 |
| _Roll_DEC | 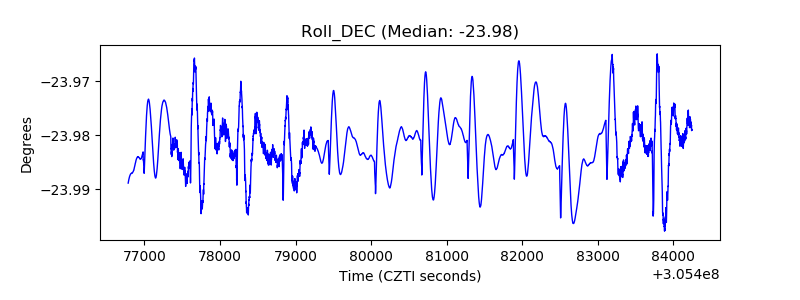 |
| _Roll_RA | 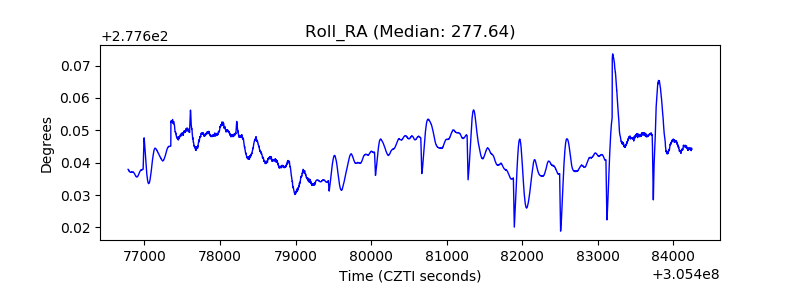 |
| Veto Counter | 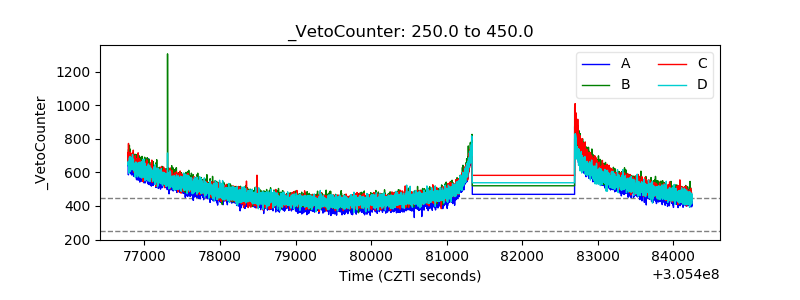 |