| Param | Original file | Final file |
|---|---|---|
| Filename | modeM0/AS1T03_140T01_9000003142_21308cztM0_level2.evt | modeM0/AS1T03_140T01_9000003142_21308cztM0_level2_quad_clean.evt |
| Size (bytes) | 472,587,840 | 88,024,320 |
| Size | 450.7 MB | 83.9 MB |
| Events in quadrant A | 3,380,036 | 573,427 |
| Events in quadrant B | 3,351,005 | 577,939 |
| Events in quadrant C | 3,092,395 | 550,337 |
| Events in quadrant D | 4,071,437 | 534,648 |
| Mode M0 | |||
|---|---|---|---|
| Quadrant | BADHDUFLAG | Total packets | Discarded packets |
| A | 0 | 13942 | 1 |
| B | 0 | 13967 | 1 |
| C | 0 | 13104 | 1 |
| D | 0 | 16381 | 1 |
| Mode M9 | |||
|---|---|---|---|
| Quadrant | BADHDUFLAG | Total packets | Discarded packets |
| A | 0 | 12 | 0 |
| B | 0 | 12 | 0 |
| C | 0 | 12 | 0 |
| D | 0 | 12 | 0 |
| Mode SS | |||
|---|---|---|---|
| Quadrant | BADHDUFLAG | Total packets | Discarded packets |
| A | 0 | 124 | 0 |
| B | 0 | 124 | 0 |
| C | 0 | 124 | 0 |
| D | 0 | 124 | 0 |
| Quadrant | Total seconds | Saturated seconds | Saturation percentage |
|---|---|---|---|
| A | 6153 | 108 | 1.755241% |
| B | 6154 | 126 | 2.047449% |
| C | 6153 | 146 | 2.372826% |
| D | 6153 | 141 | 2.291565% |
Noise dominated data is calculated using 1-second bins in cleaned event files. If a bin has >2000 counts, and if more than 50% of those come from <1% of pixels, then it is considered to be noise-dominated and hence unusable.
| Quadrant | # 1 sec bins | Bins with >0 counts | Bins with >2000 counts | High rate bins dominated by noise | Noise dominated (total time) | Noise dominated (detector-on time) | Marked lightcurve |
|---|---|---|---|---|---|---|---|
| A | 7343 | 6153 | 11 | 11 | 0.15% | 0.18% | 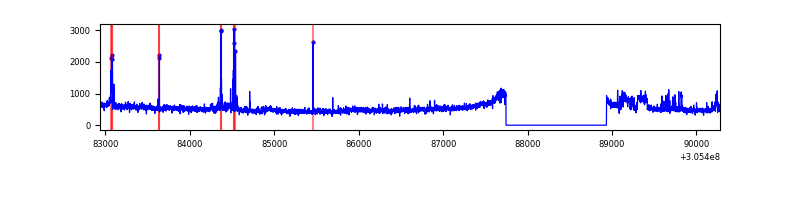 |
| B | 7344 | 6154 | 5 | 5 | 0.07% | 0.08% | 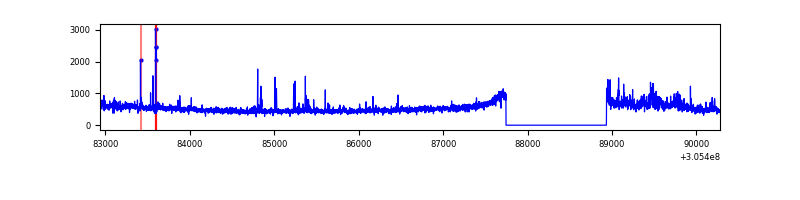 |
| C | 7343 | 6153 | 9 | 9 | 0.12% | 0.15% | 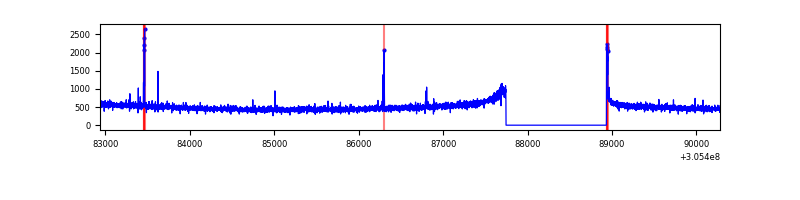 |
| D | 7343 | 6153 | 83 | 83 | 1.13% | 1.35% | 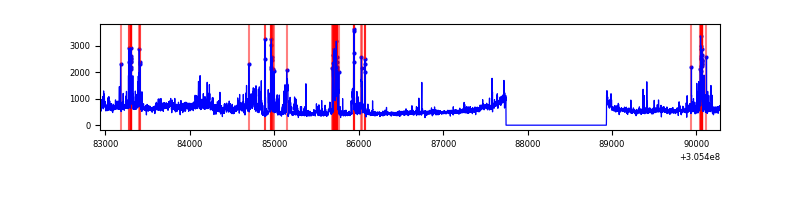 |
Top three noisy pixels from each quadrant. If the there are fewer than three noisy pixels in the level2.evt file, extra rows are filled as -1
| Pixel properties | Quadrant properties | ||||||
|---|---|---|---|---|---|---|---|
| Quadrant | DetID | PixID | Counts | Sigma | Mean | Median | Sigma |
| A | 15 | 236 | 197550 | 1232.24 | 795 | 780 | 159.7 |
| A | 15 | 174 | 59447 | 367.39 | 795 | 780 | 159.7 |
| A | 9 | 143 | 47369 | 291.76 | 795 | 780 | 159.7 |
| B | 0 | 189 | 121537 | 802.87 | 789 | 770 | 150.4 |
| B | 3 | 64 | 44113 | 288.15 | 789 | 770 | 150.4 |
| B | 0 | 190 | 27340 | 176.64 | 789 | 770 | 150.4 |
| C | 14 | 238 | 118189 | 673.77 | 747 | 752 | 174.3 |
| C | 10 | 23 | 32842 | 184.11 | 747 | 752 | 174.3 |
| C | 0 | 10 | 25194 | 140.23 | 747 | 752 | 174.3 |
| D | 12 | 235 | 374287 | 2016.71 | 760 | 738 | 185.2 |
| D | 13 | 174 | 339717 | 1830.07 | 760 | 738 | 185.2 |
| D | 9 | 68 | 129013 | 692.53 | 760 | 738 | 185.2 |
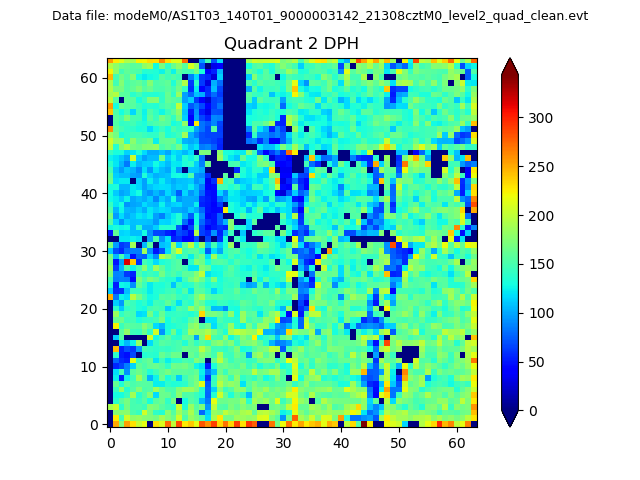
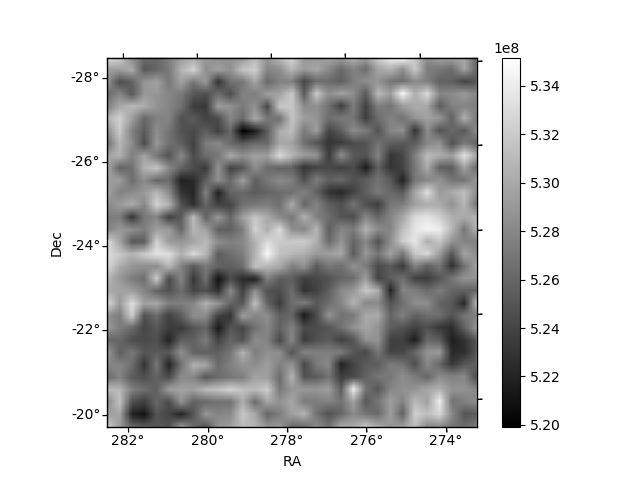
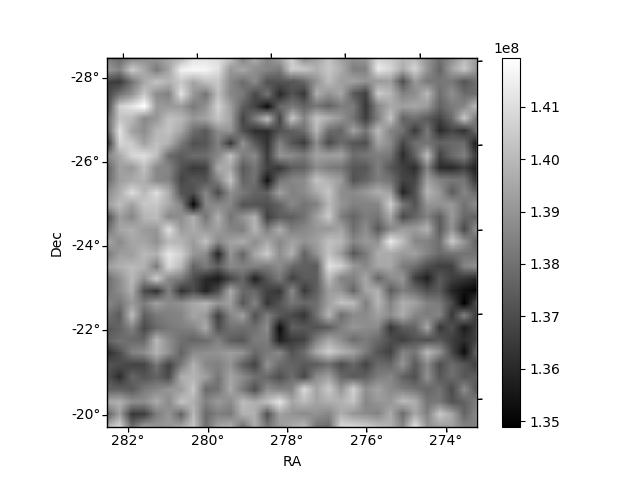
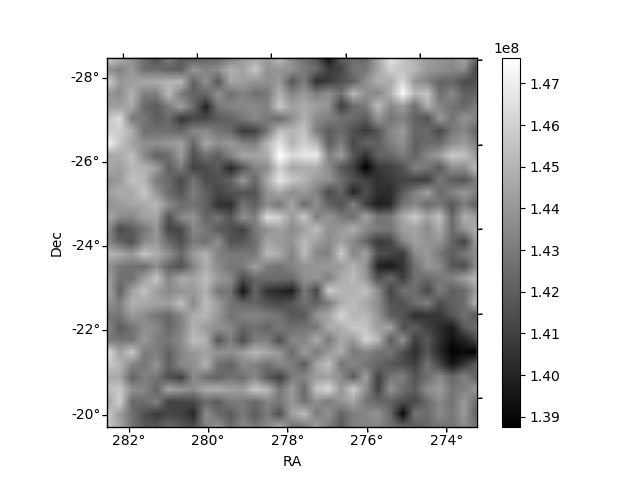
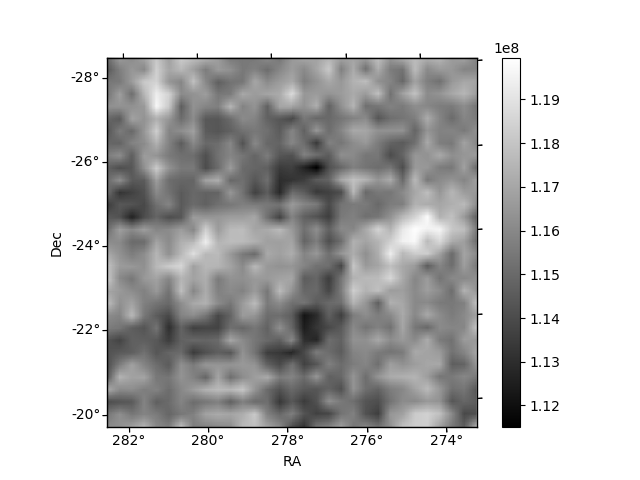
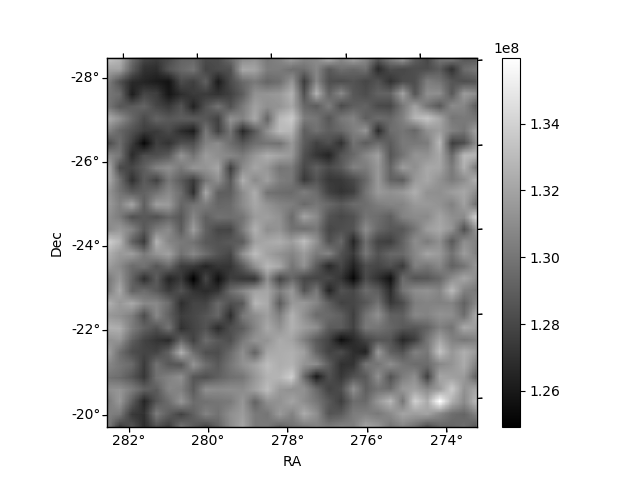
Histogram calculated using DETX and DETY for each event in the final _common_clean file
| Quadrant A | 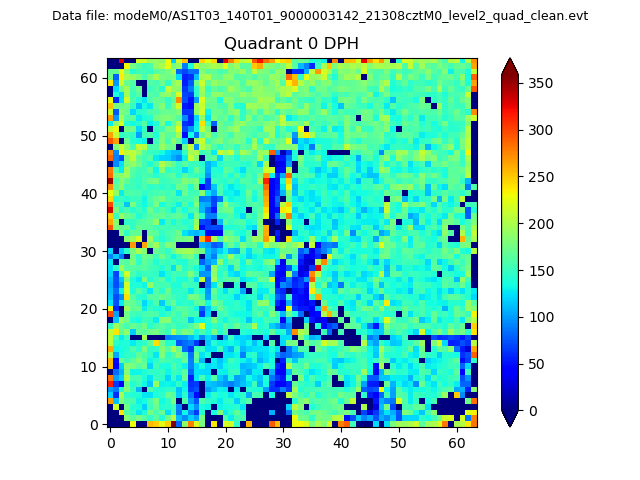 |
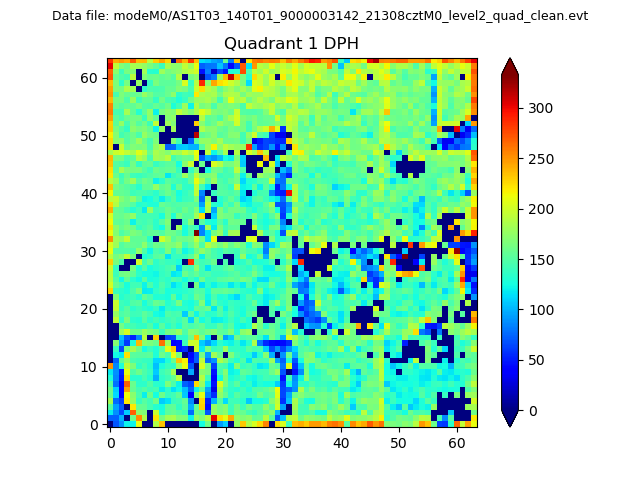 |
Quadrant B |
|---|---|---|---|
| Quadrant D | 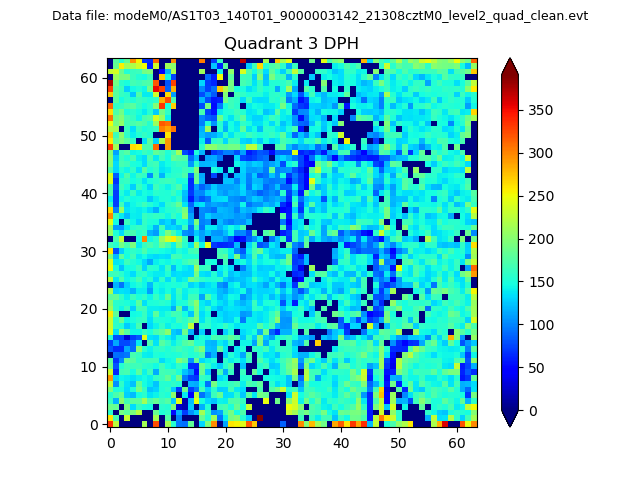 |
 |
Quadrant C |
| Plot type | Count rate plots | Images |
|---|---|---|
| Comparison with Poisson distribution Blue bars denote a histogram of data divided into 1 sec bins. Red curve is a Poisson curve with rate = median count rate of data. |
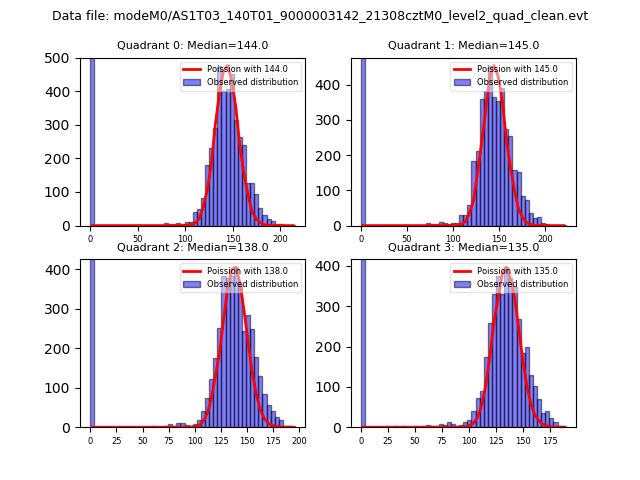 |
 |
| Quadrant-wise count rates Data is divided into 100 sec bins |
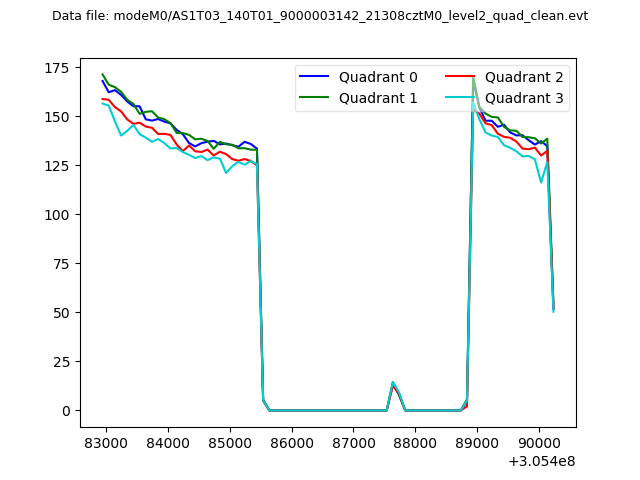 |
|
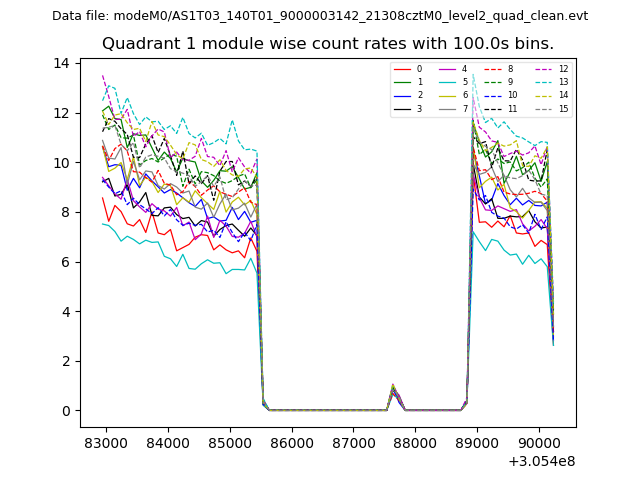
| Module-wise count rates for Quadrant A Data is divided into 100 sec bins |
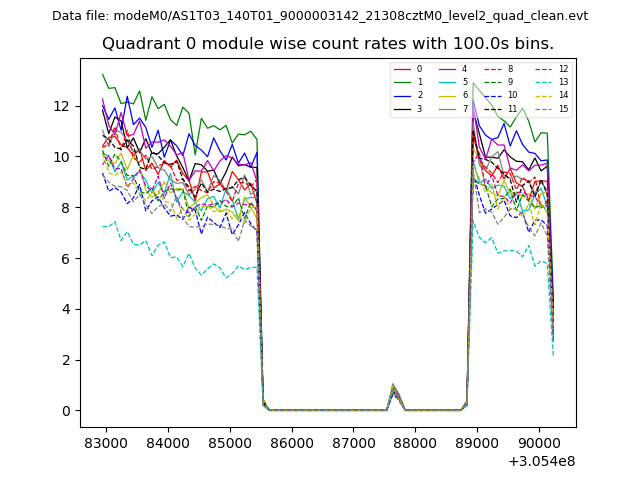 |
 |
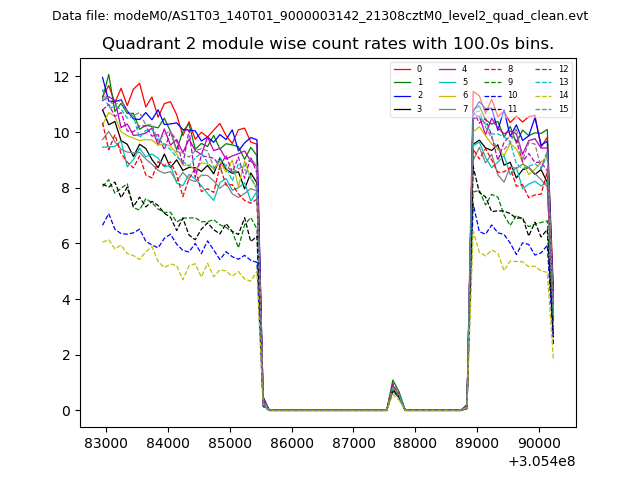
| Module-wise count rates for Quadrant B Data is divided into 100 sec bins |
 |
 |
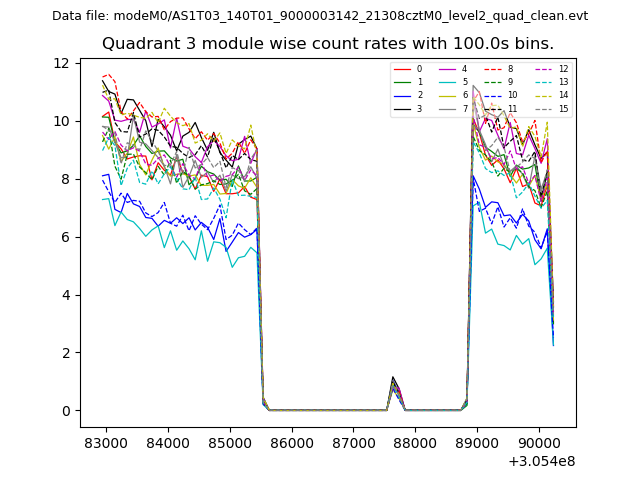
| Module-wise count rates for Quadrant C Data is divided into 100 sec bins |
 |
 |
| Module-wise count rates for Quadrant D Data is divided into 100 sec bins |
 |
 |
| Parameter | Plot |
|---|---|
| CZT HV Monitor | 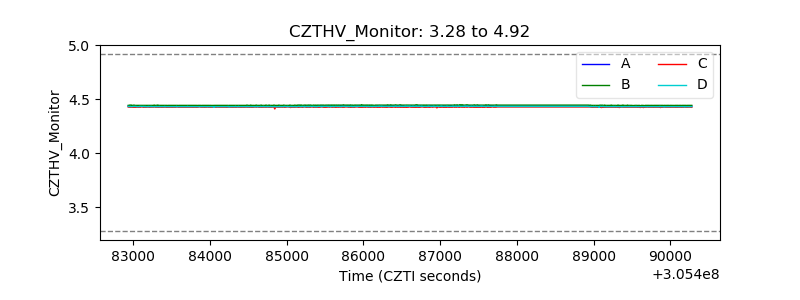 |
| D_VDD | 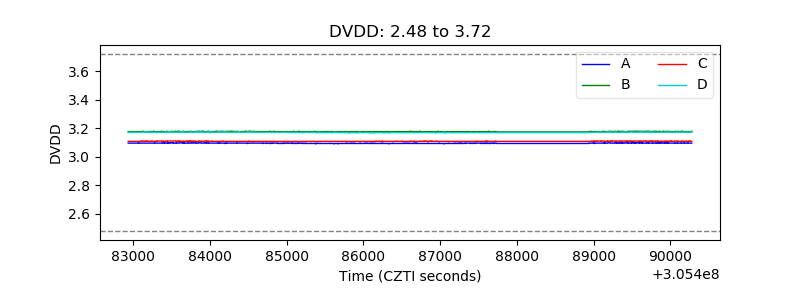 |
| Temperature 1 | 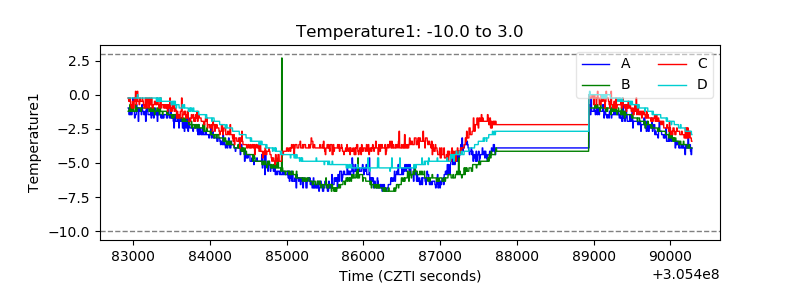 |
| Veto HV Monitor | 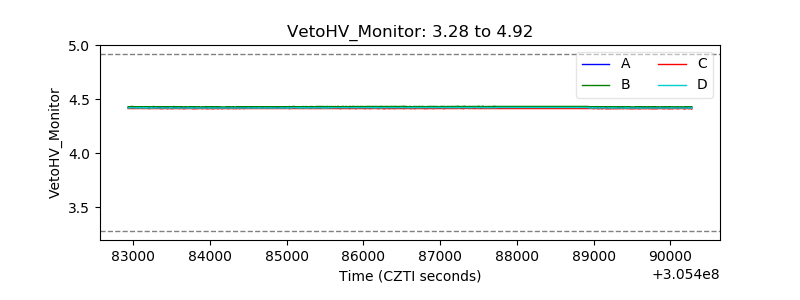 |
| Veto LLD | 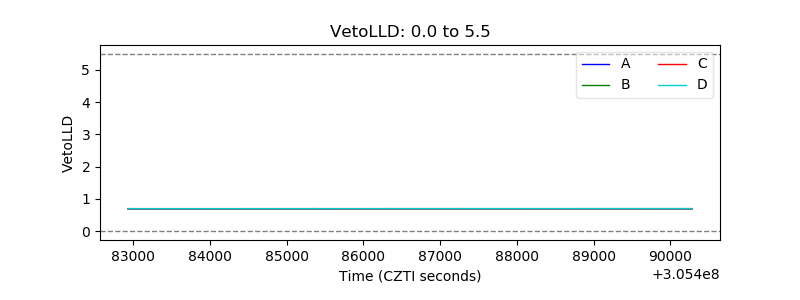 |
| Alpha Counter | 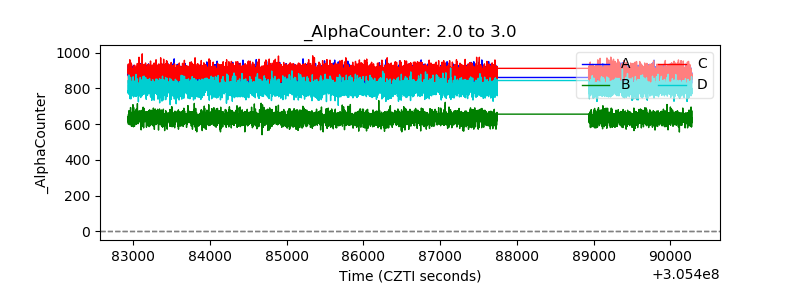 |
| _CPM_Rate | 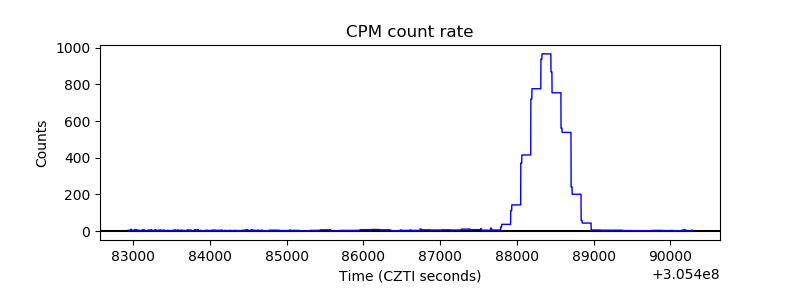 |
| CZT Counter | 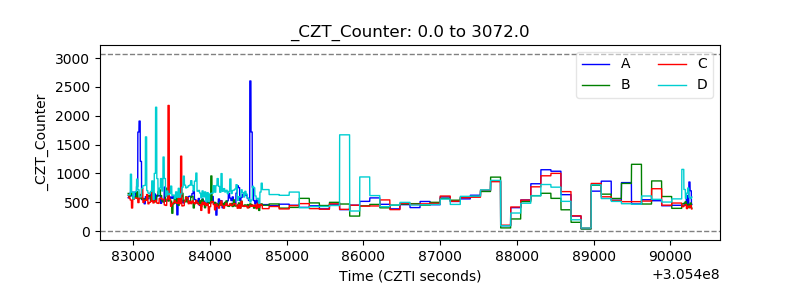 |
| +2.5 Volts monitor |  |
| +5 Volts monitor |  |
| _ROLL_ROT | 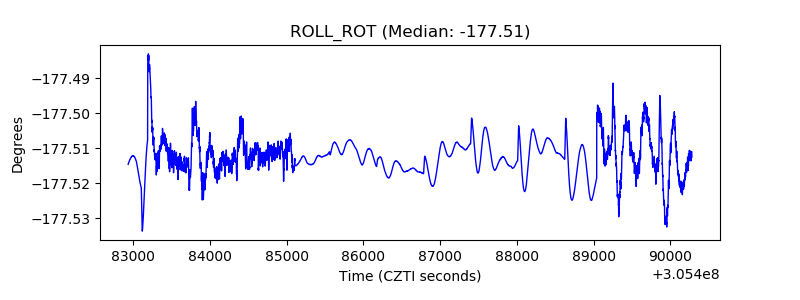 |
| _Roll_DEC | 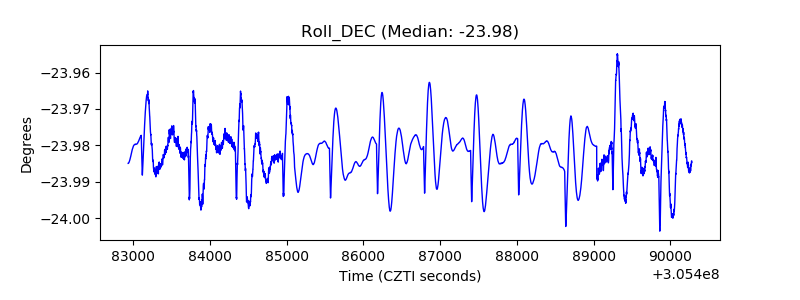 |
| _Roll_RA | 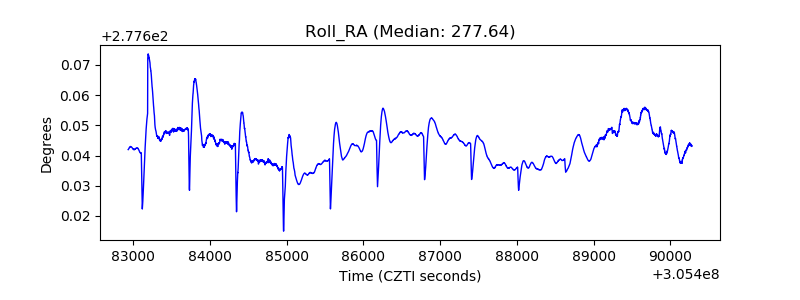 |
| Veto Counter | 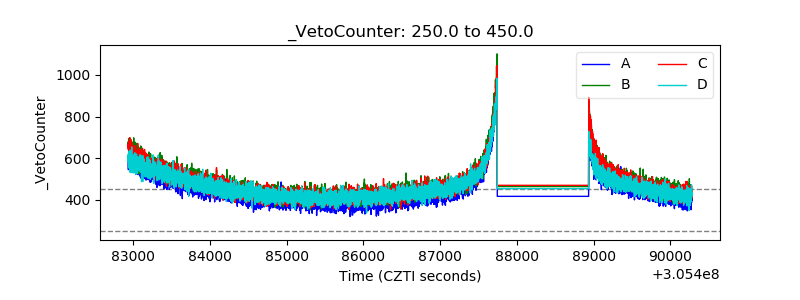 |