| Param | Original file | Final file |
|---|---|---|
| Filename | modeM0/AS1A05_037T01_9000003144cztM0_level2.fits | modeM0/AS1A05_037T01_9000003144cztM0_level2_quad_clean.evt |
| Size (bytes) | 983,116,800 | 905,333,760 |
| Size | 937.6 MB | 863.4 MB |
| Events in quadrant A | 6,027,630 | 5,338,949 |
| Events in quadrant B | 5,821,556 | 5,405,428 |
| Events in quadrant C | 5,914,798 | 5,200,254 |
| Events in quadrant D | 5,099,754 | 4,563,655 |
| Mode M0 | |||
|---|---|---|---|
| Quadrant | BADHDUFLAG | Total packets | Discarded packets |
| A | 0 | 229277 | 0 |
| B | 0 | 216911 | 0 |
| C | 0 | 209106 | 0 |
| D | 0 | 272472 | 0 |
| Mode SS | |||
|---|---|---|---|
| Quadrant | BADHDUFLAG | Total packets | Discarded packets |
| A | 0 | 2052 | 0 |
| B | 0 | 2052 | 0 |
| C | 0 | 2052 | 0 |
| D | 0 | 2052 | 0 |
| Mode M9 | |||
|---|---|---|---|
| Quadrant | BADHDUFLAG | Total packets | Discarded packets |
| A | 0 | 141 | 0 |
| B | 0 | 141 | 0 |
| C | 0 | 141 | 0 |
| D | 0 | 141 | 0 |
| Quadrant | Total seconds | Saturated seconds | Saturation percentage |
|---|---|---|---|
| A | 100808 | 1978 | 1.962146% |
| B | 100808 | 1239 | 1.229069% |
| C | 100808 | 1118 | 1.109039% |
| D | 100808 | 3654 | 3.624712% |
Noise dominated data is calculated using 1-second bins in cleaned event files. If a bin has >2000 counts, and if more than 50% of those come from <1% of pixels, then it is considered to be noise-dominated and hence unusable.
| Quadrant | # 1 sec bins | Bins with >0 counts | Bins with >2000 counts | High rate bins dominated by noise | Noise dominated (total time) | Noise dominated (detector-on time) | Marked lightcurve |
|---|---|---|---|---|---|---|---|
| A | 114908 | 100786 | 0 | 0 | 0.00% | 0.00% | 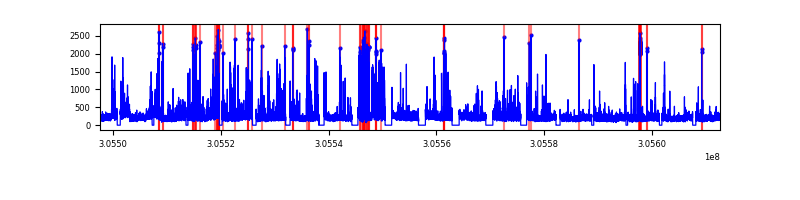 |
| B | 114908 | 100786 | 0 | 0 | 0.00% | 0.00% | 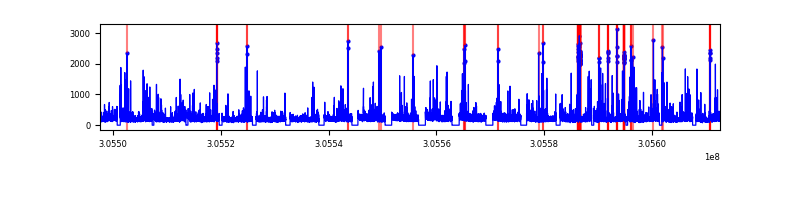 |
| C | 114908 | 100798 | 0 | 0 | 0.00% | 0.00% | 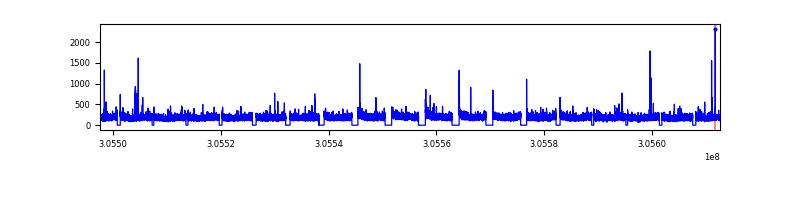 |
| D | 114908 | 100785 | 0 | 0 | 0.00% | 0.00% | 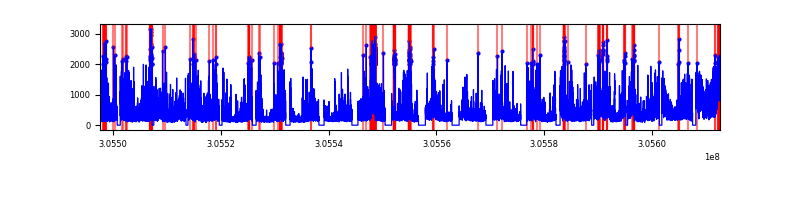 |
Top three noisy pixels from each quadrant. If the there are fewer than three noisy pixels in the level2.evt file, extra rows are filled as -1
| Pixel properties | Quadrant properties | ||||||
|---|---|---|---|---|---|---|---|
| Quadrant | DetID | PixID | Counts | Sigma | Mean | Median | Sigma |
| A | 0 | 29 | 5738 | 11.35 | 1570 | 1475 | 375.7 |
| A | 7 | 110 | 4892 | 9.1 | 1570 | 1475 | 375.7 |
| A | 0 | 30 | 4498 | 8.05 | 1570 | 1475 | 375.7 |
| B | 2 | 9 | 4685 | 10.55 | 1541 | 1469 | 304.8 |
| B | 2 | 8 | 3946 | 8.13 | 1541 | 1469 | 304.8 |
| B | 5 | 128 | 3830 | 7.74 | 1541 | 1469 | 304.8 |
| C | 1 | 80 | 4476 | 7.56 | 1559 | 1455 | 399.6 |
| C | 1 | 81 | 4448 | 7.49 | 1559 | 1455 | 399.6 |
| C | 12 | 241 | 4173 | 6.8 | 1559 | 1455 | 399.6 |
| D | 3 | 14 | 3680 | 6.06 | 1459 | 1329 | 387.8 |
| D | 7 | 3 | 3620 | 5.91 | 1459 | 1329 | 387.8 |
| D | 6 | 231 | 3573 | 5.79 | 1459 | 1329 | 387.8 |
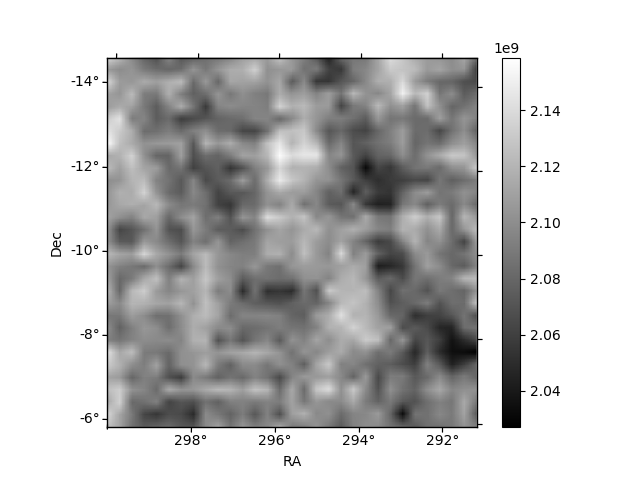
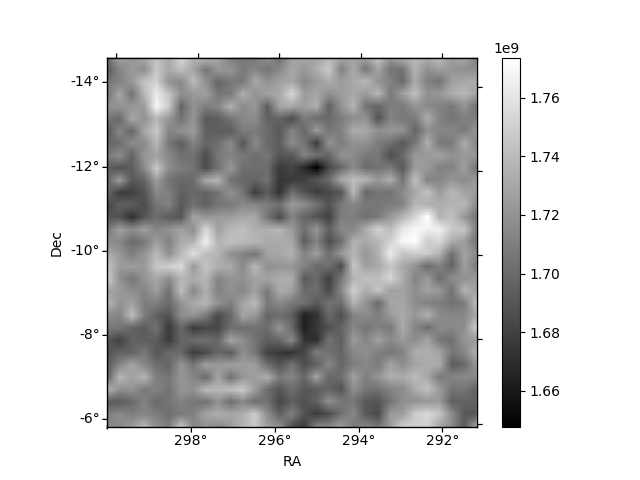
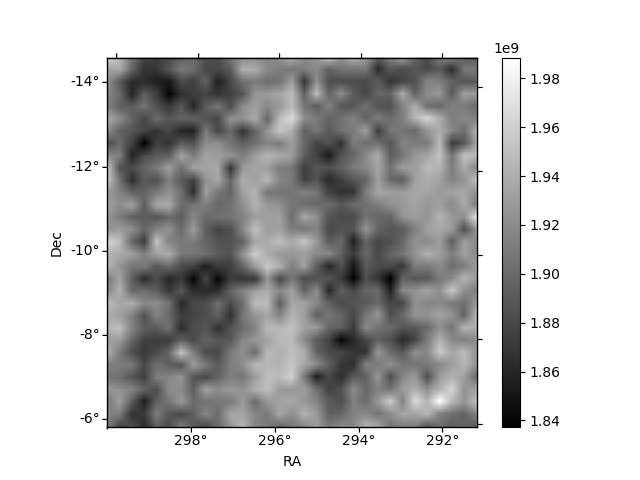
Histogram calculated using DETX and DETY for each event in the final _common_clean file
| Quadrant A | 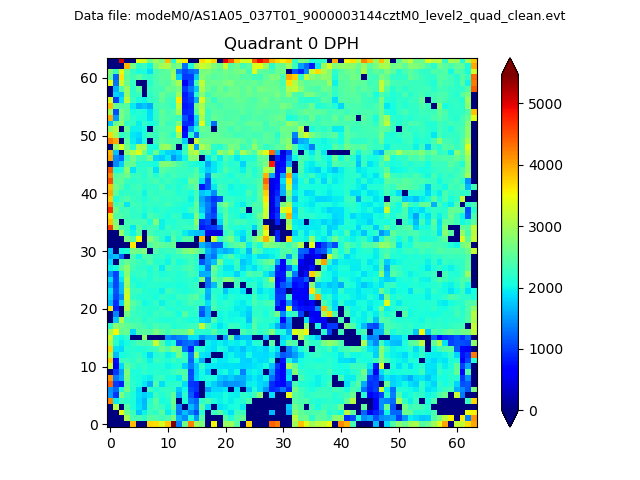 |
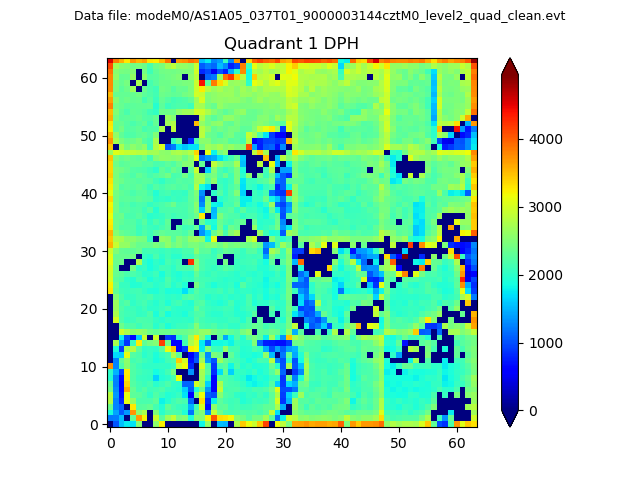 |
Quadrant B |
|---|---|---|---|
| Quadrant D | 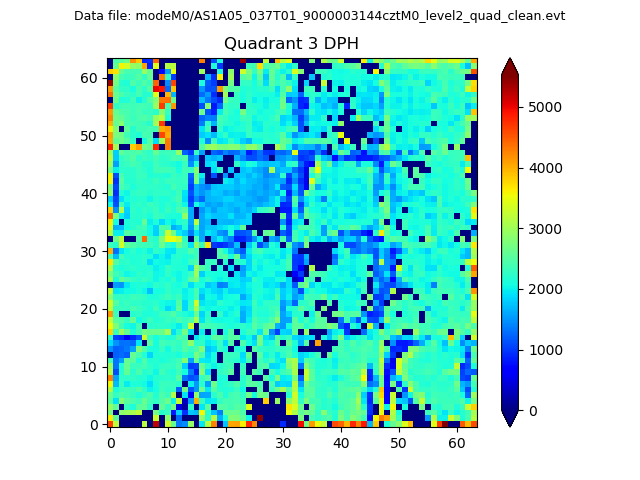 |
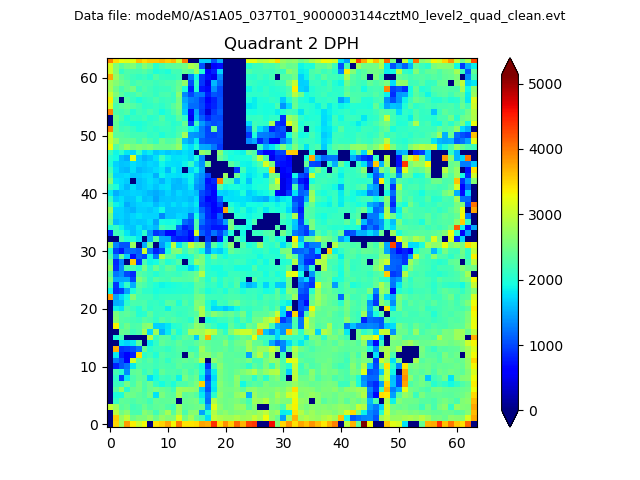 |
Quadrant C |
| Plot type | Count rate plots | Images |
|---|---|---|
| Comparison with Poisson distribution Blue bars denote a histogram of data divided into 1 sec bins. Red curve is a Poisson curve with rate = median count rate of data. |
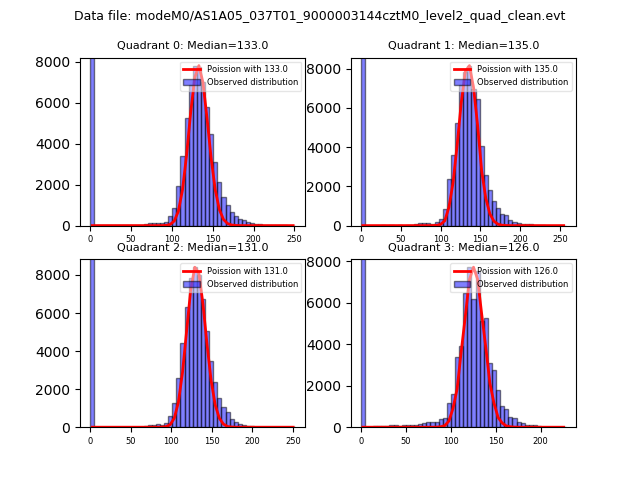 |
 |
| Quadrant-wise count rates Data is divided into 100 sec bins |
 |
|
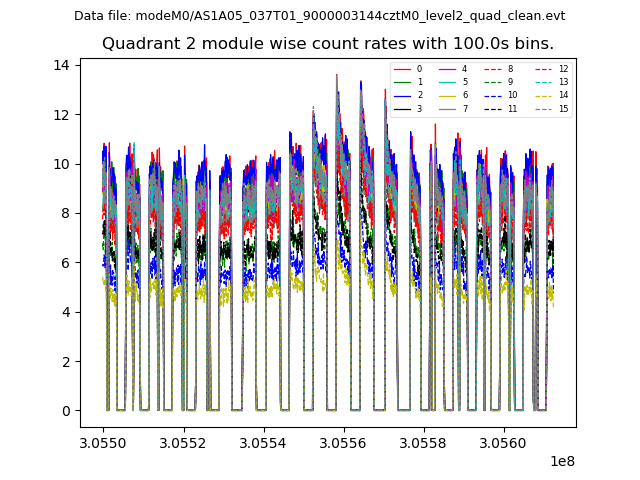
| Module-wise count rates for Quadrant A Data is divided into 100 sec bins |
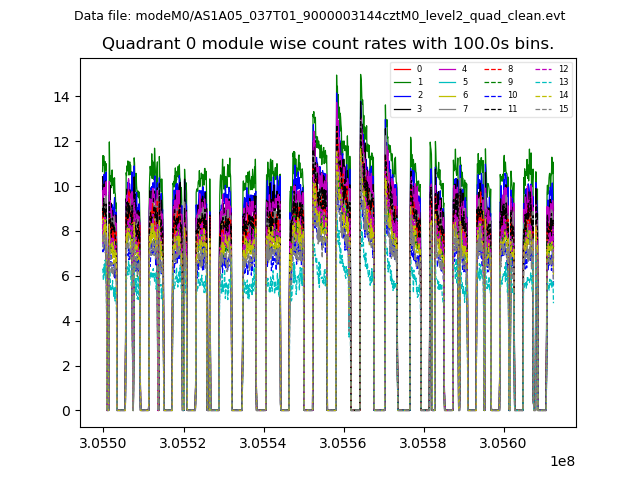 |
 |
| Module-wise count rates for Quadrant B Data is divided into 100 sec bins |
 |
 |
| Module-wise count rates for Quadrant C Data is divided into 100 sec bins |
 |
 |
| Module-wise count rates for Quadrant D Data is divided into 100 sec bins |
 |
 |
| Parameter | Plot |
|---|---|
| CZT HV Monitor | 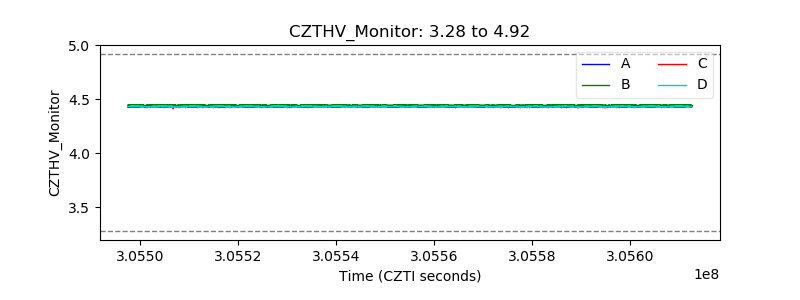 |
| D_VDD | 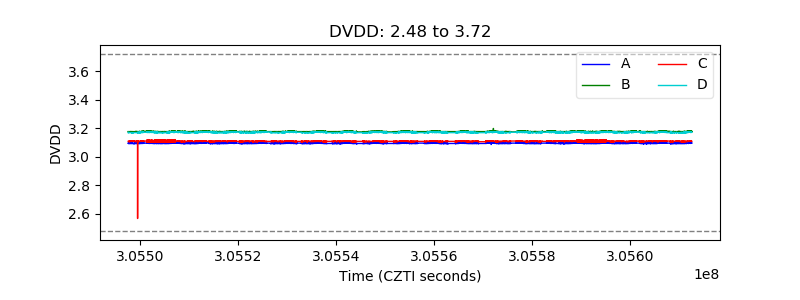 |
| Temperature 1 | 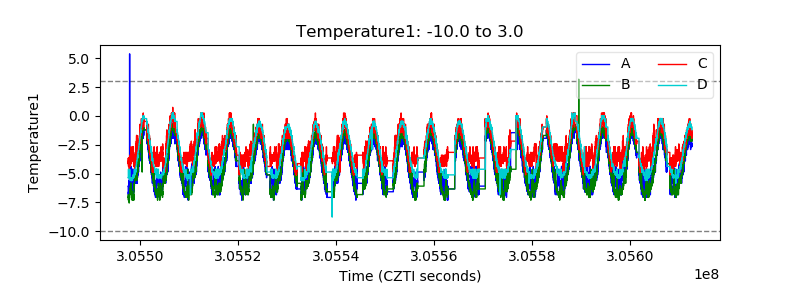 |
| Veto HV Monitor |  |
| Veto LLD | 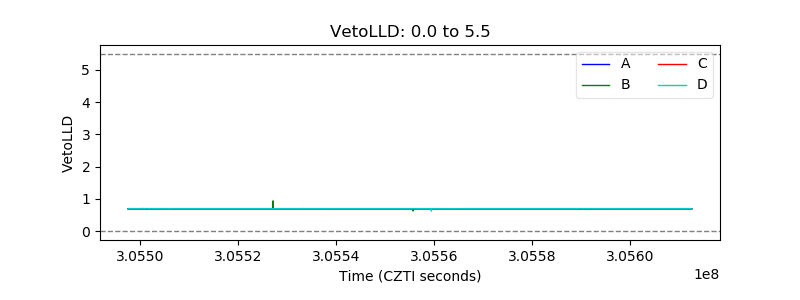 |
| Alpha Counter | 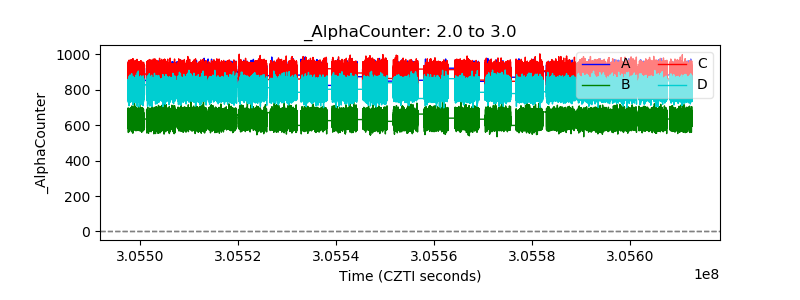 |
| _CPM_Rate | 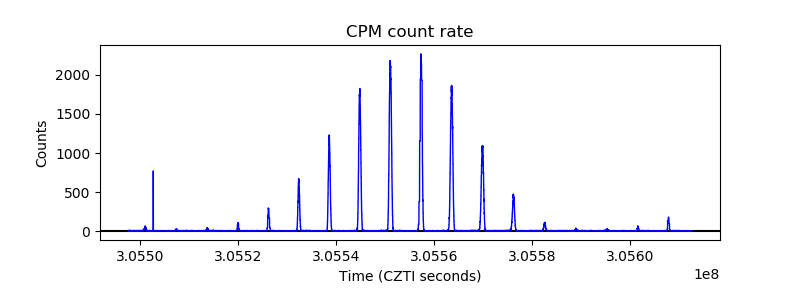 |
| CZT Counter |  |
| +2.5 Volts monitor |  |
| +5 Volts monitor |  |
| _ROLL_ROT | 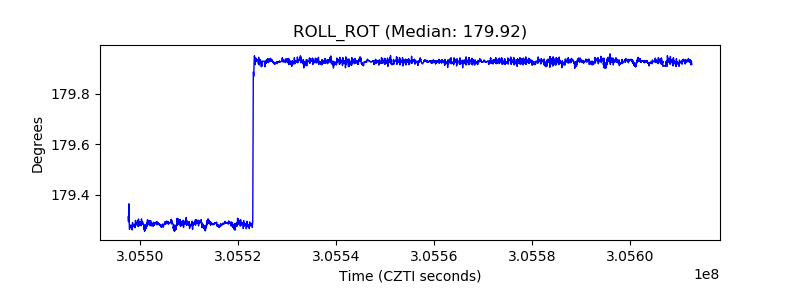 |
| _Roll_DEC | 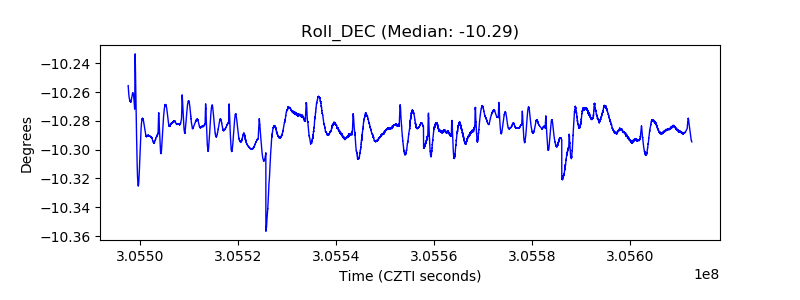 |
| _Roll_RA |  |
| Veto Counter | 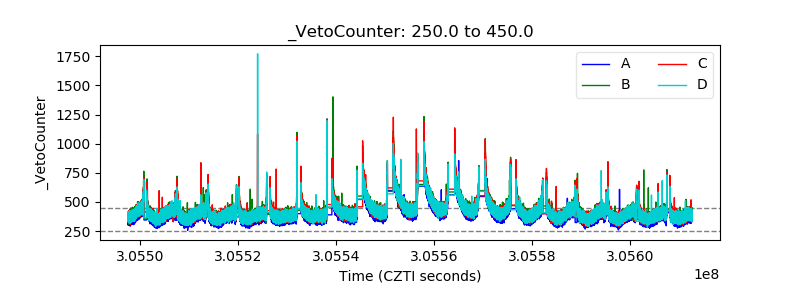 |