| Param | Original file | Final file |
|---|---|---|
| Filename | modeM0/AS1A05_037T01_9000003144_21311cztM0_level2.evt | modeM0/AS1A05_037T01_9000003144_21311cztM0_level2_quad_clean.evt |
| Size (bytes) | 576,357,120 | 107,265,600 |
| Size | 549.7 MB | 102.3 MB |
| Events in quadrant A | 4,414,283 | 686,020 |
| Events in quadrant B | 3,837,525 | 701,180 |
| Events in quadrant C | 3,653,388 | 680,505 |
| Events in quadrant D | 5,034,692 | 652,061 |
| Mode M0 | |||
|---|---|---|---|
| Quadrant | BADHDUFLAG | Total packets | Discarded packets |
| A | 0 | 18503 | 2 |
| B | 0 | 16384 | 2 |
| C | 0 | 15813 | 2 |
| D | 0 | 20195 | 2 |
| Mode SS | |||
|---|---|---|---|
| Quadrant | BADHDUFLAG | Total packets | Discarded packets |
| A | 0 | 156 | 0 |
| B | 0 | 156 | 0 |
| C | 0 | 156 | 0 |
| D | 0 | 156 | 0 |
| Mode M9 | |||
|---|---|---|---|
| Quadrant | BADHDUFLAG | Total packets | Discarded packets |
| A | 0 | 9 | 0 |
| B | 0 | 9 | 0 |
| C | 0 | 9 | 0 |
| D | 0 | 9 | 0 |
| Quadrant | Total seconds | Saturated seconds | Saturation percentage |
|---|---|---|---|
| A | 7600 | 67 | 0.881579% |
| B | 7601 | 81 | 1.065649% |
| C | 7601 | 71 | 0.934088% |
| D | 7601 | 239 | 3.144323% |
Noise dominated data is calculated using 1-second bins in cleaned event files. If a bin has >2000 counts, and if more than 50% of those come from <1% of pixels, then it is considered to be noise-dominated and hence unusable.
| Quadrant | # 1 sec bins | Bins with >0 counts | Bins with >2000 counts | High rate bins dominated by noise | Noise dominated (total time) | Noise dominated (detector-on time) | Marked lightcurve |
|---|---|---|---|---|---|---|---|
| A | 8480 | 7602 | 15 | 15 | 0.18% | 0.20% | 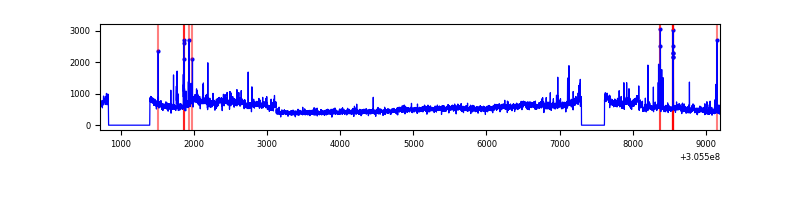 |
| B | 8481 | 7603 | 10 | 10 | 0.12% | 0.13% | 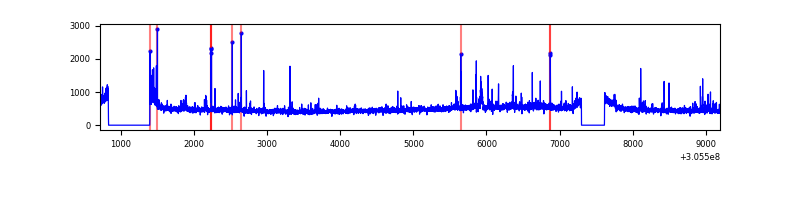 |
| C | 8481 | 7603 | 1 | 1 | 0.01% | 0.01% | 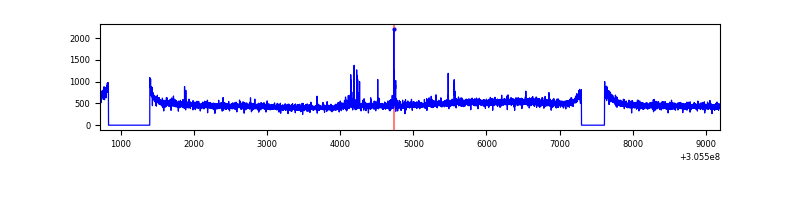 |
| D | 8481 | 7603 | 153 | 153 | 1.80% | 2.01% | 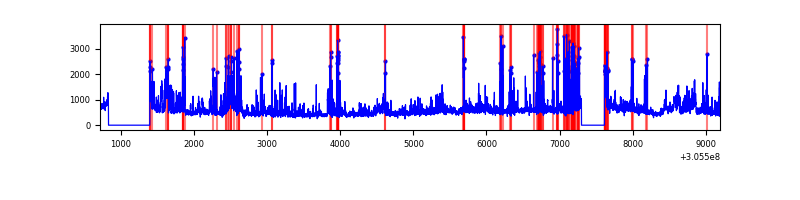 |
Top three noisy pixels from each quadrant. If the there are fewer than three noisy pixels in the level2.evt file, extra rows are filled as -1
| Pixel properties | Quadrant properties | ||||||
|---|---|---|---|---|---|---|---|
| Quadrant | DetID | PixID | Counts | Sigma | Mean | Median | Sigma |
| A | 15 | 236 | 711872 | 3809.08 | 921 | 903 | 186.7 |
| A | 9 | 143 | 74095 | 392.13 | 921 | 903 | 186.7 |
| A | 5 | 16 | 36766 | 192.14 | 921 | 903 | 186.7 |
| B | 3 | 64 | 60804 | 333.51 | 924 | 901 | 179.6 |
| B | 0 | 189 | 39201 | 213.24 | 924 | 901 | 179.6 |
| B | 0 | 230 | 37633 | 204.51 | 924 | 901 | 179.6 |
| C | 14 | 238 | 137357 | 656.73 | 884 | 888 | 207.8 |
| C | 10 | 23 | 44067 | 207.79 | 884 | 888 | 207.8 |
| C | 8 | 128 | 12192 | 54.4 | 884 | 888 | 207.8 |
| D | 1 | 52 | 750381 | 3464.11 | 885 | 862 | 216.4 |
| D | 13 | 174 | 453364 | 2091.36 | 885 | 862 | 216.4 |
| D | 12 | 235 | 148946 | 684.41 | 885 | 862 | 216.4 |
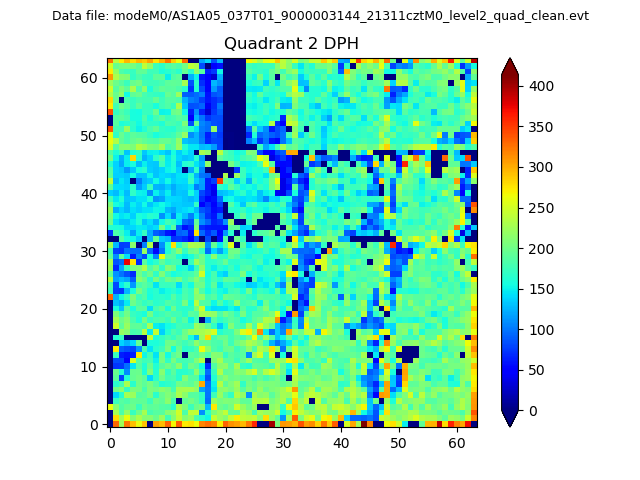
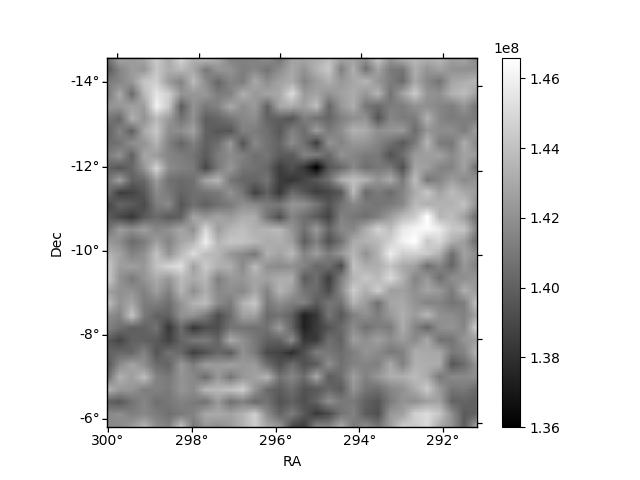
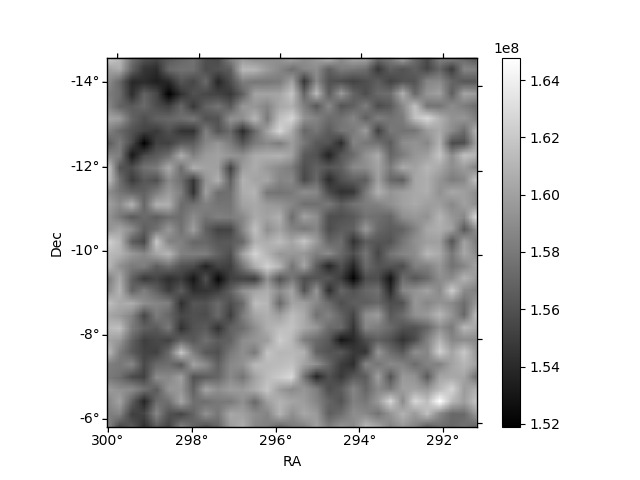
Histogram calculated using DETX and DETY for each event in the final _common_clean file
| Quadrant A | 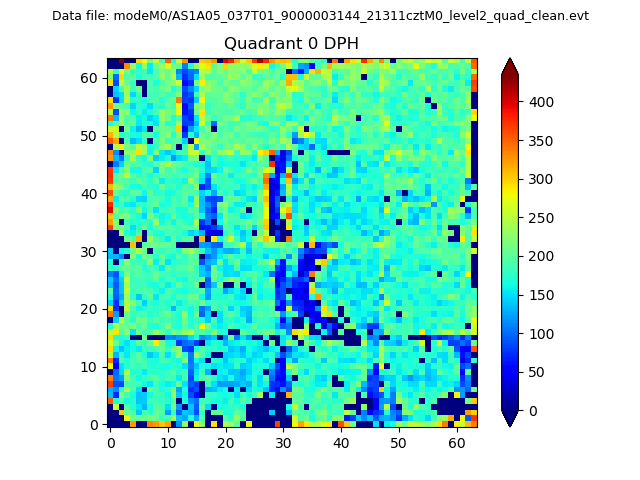 |
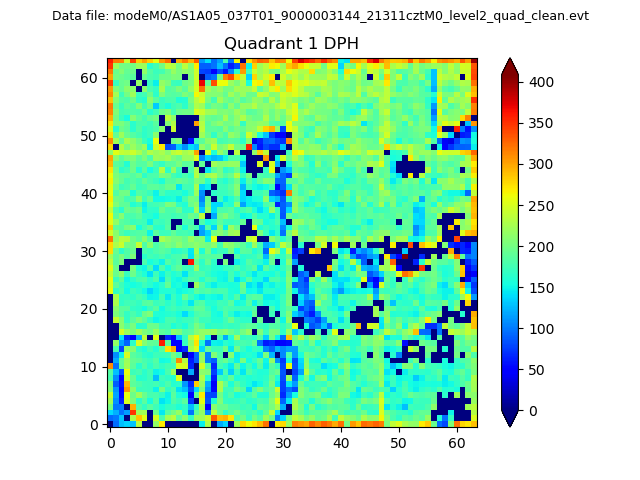 |
Quadrant B |
|---|---|---|---|
| Quadrant D | 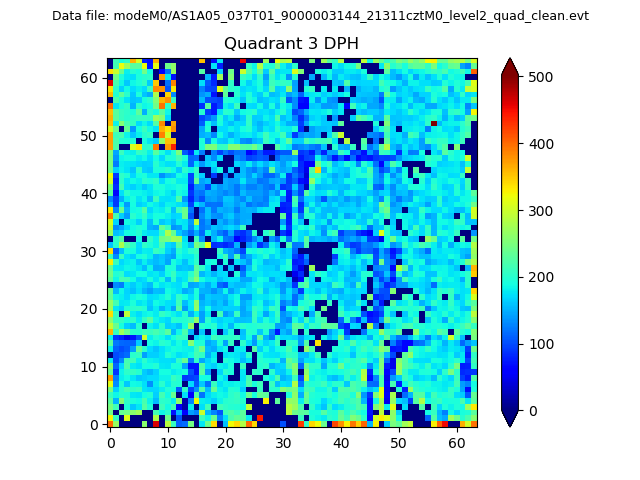 |
 |
Quadrant C |
| Plot type | Count rate plots | Images |
|---|---|---|
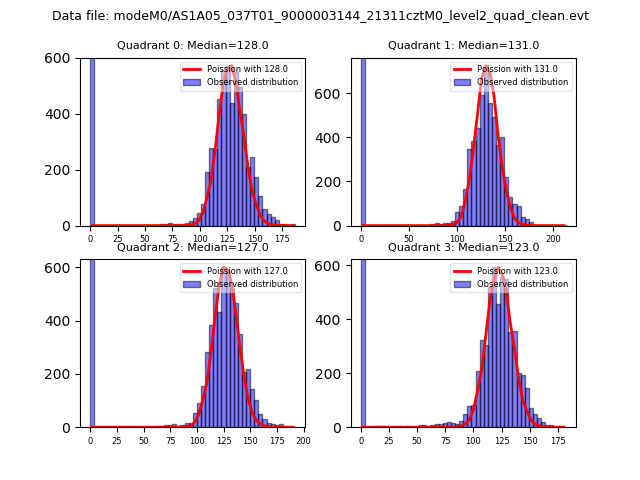
| Comparison with Poisson distribution Blue bars denote a histogram of data divided into 1 sec bins. Red curve is a Poisson curve with rate = median count rate of data. |
 |
 |
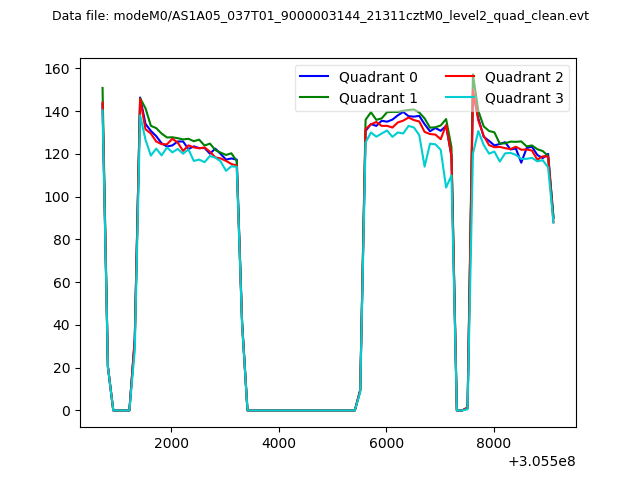
| Quadrant-wise count rates Data is divided into 100 sec bins |
 |
|
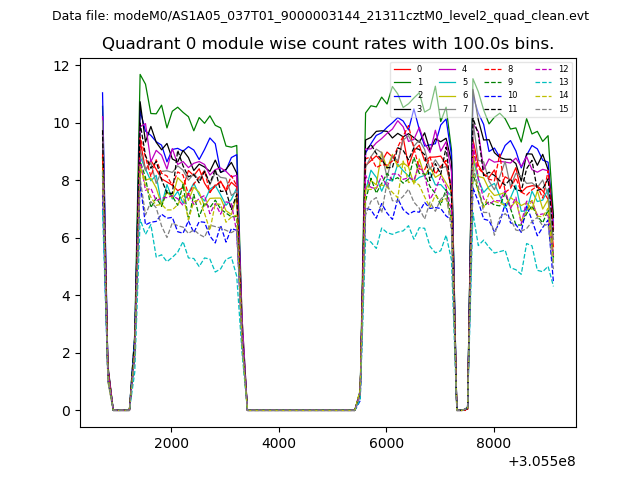
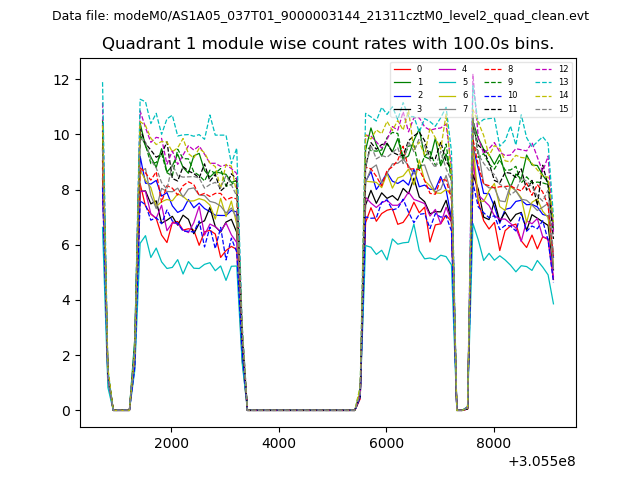
| Module-wise count rates for Quadrant A Data is divided into 100 sec bins |
 |
 |
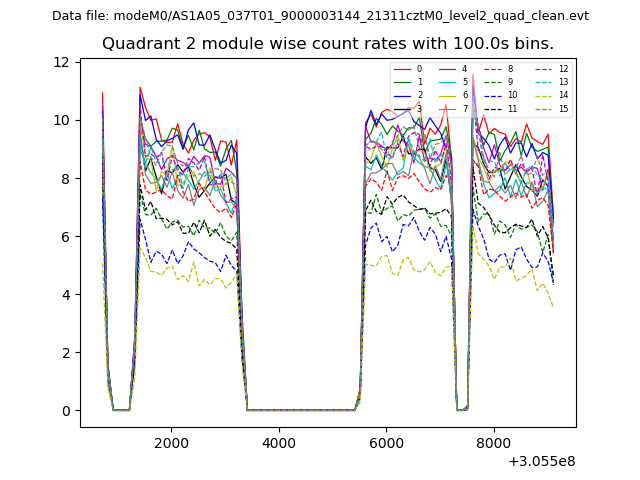
| Module-wise count rates for Quadrant B Data is divided into 100 sec bins |
 |
 |
| Module-wise count rates for Quadrant C Data is divided into 100 sec bins |
 |
 |
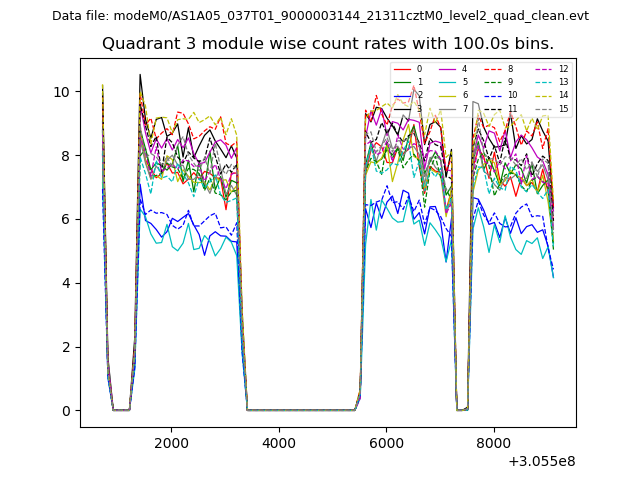
| Module-wise count rates for Quadrant D Data is divided into 100 sec bins |
 |
 |
| Parameter | Plot |
|---|---|
| CZT HV Monitor | 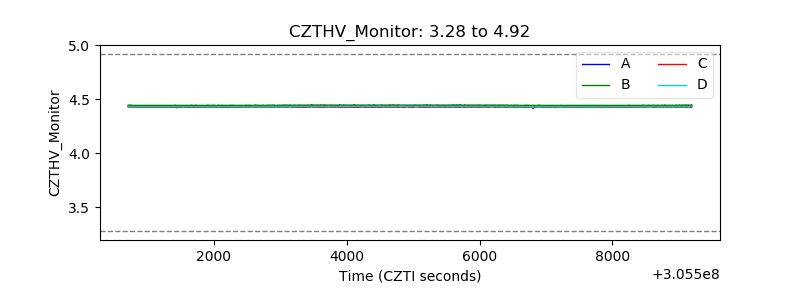 |
| D_VDD | 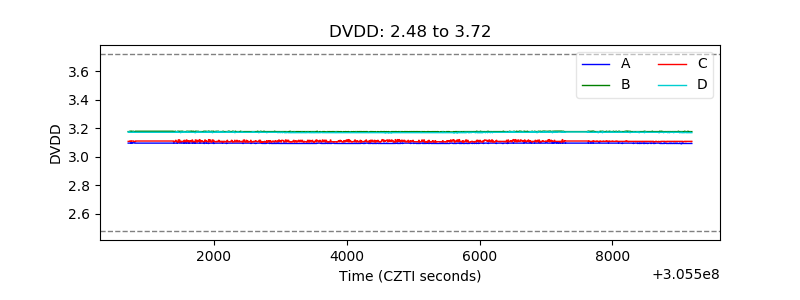 |
| Temperature 1 | 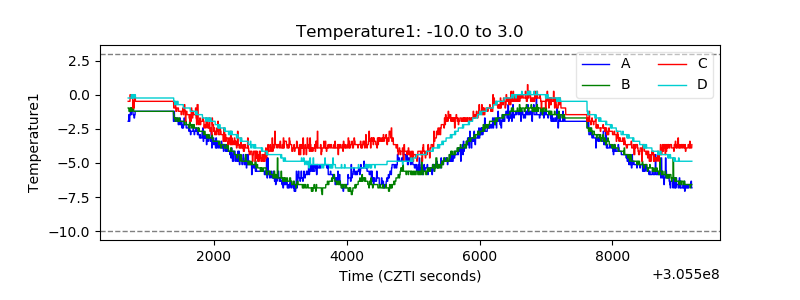 |
| Veto HV Monitor | 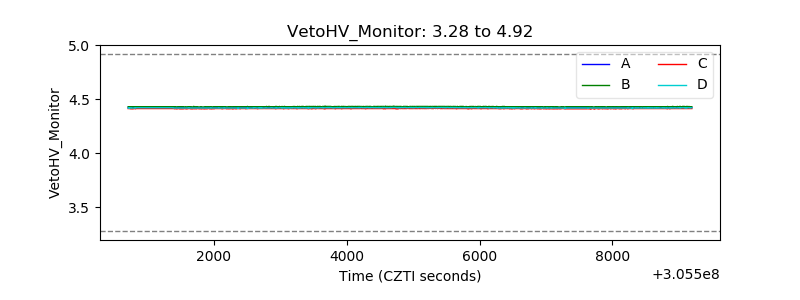 |
| Veto LLD | 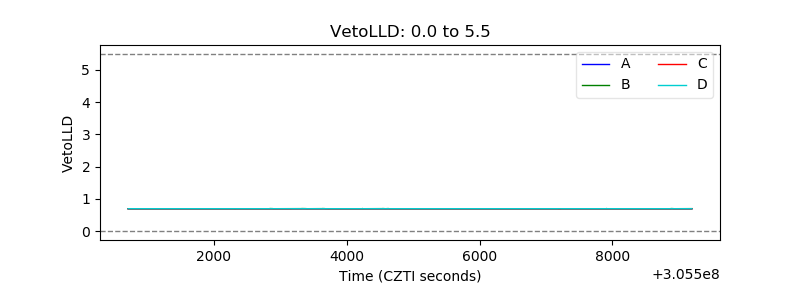 |
| Alpha Counter | 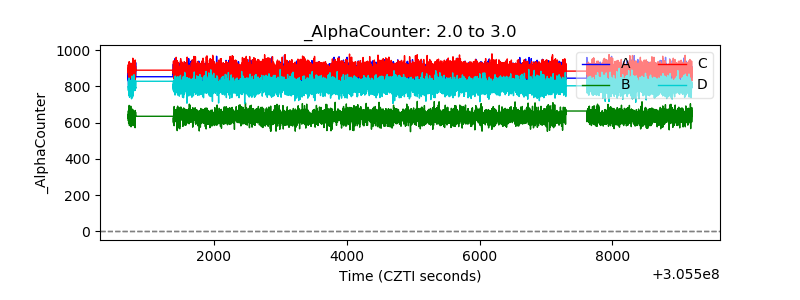 |
| _CPM_Rate | 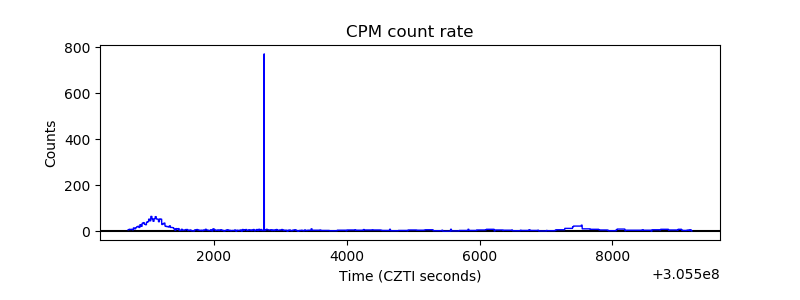 |
| CZT Counter | 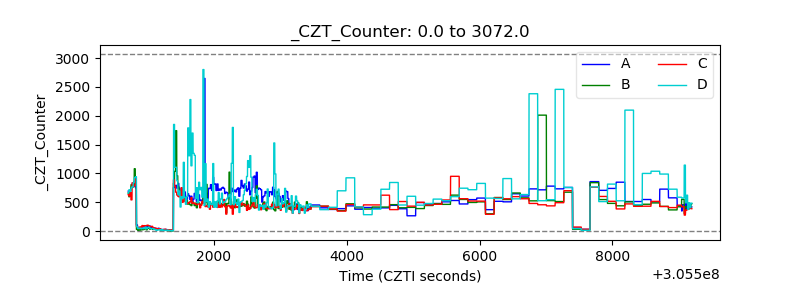 |
| +2.5 Volts monitor |  |
| +5 Volts monitor |  |
| _ROLL_ROT | 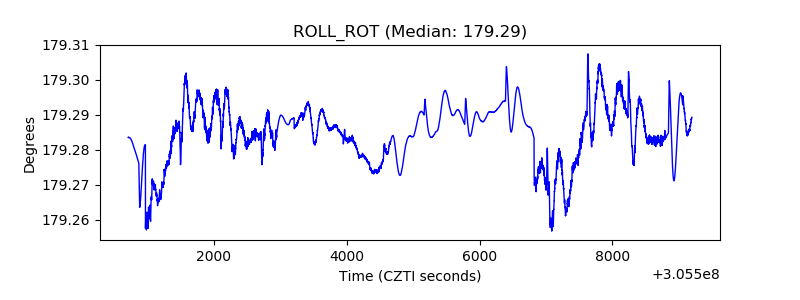 |
| _Roll_DEC | 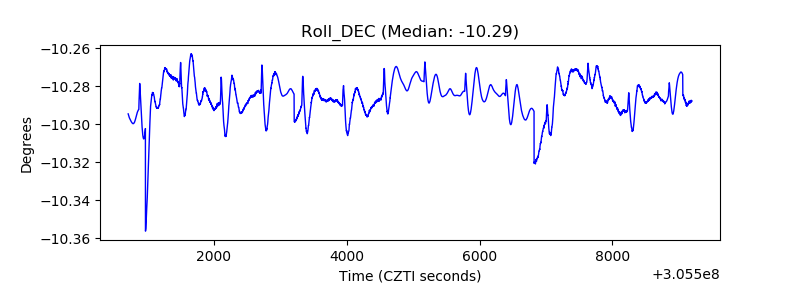 |
| _Roll_RA | 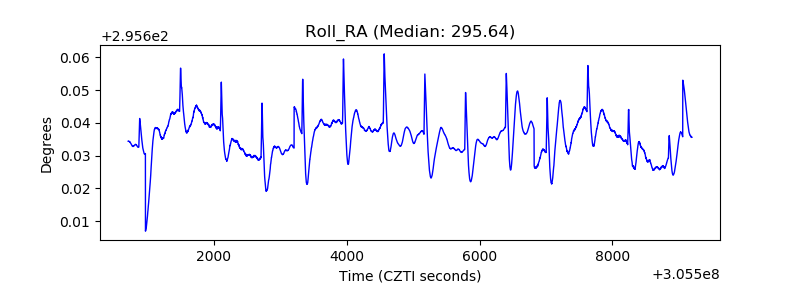 |
| Veto Counter | 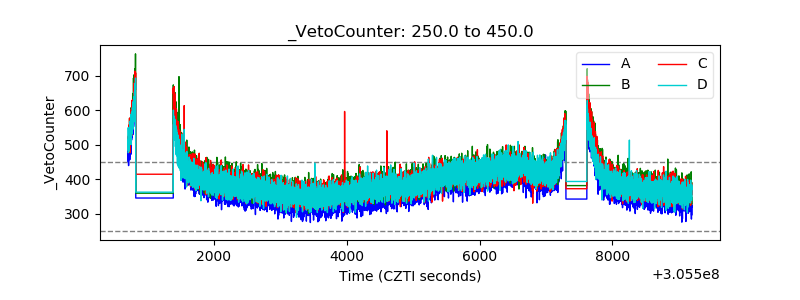 |