| Param | Original file | Final file |
|---|---|---|
| Filename | modeM0/AS1A05_037T01_9000003144_21312cztM0_level2.evt | modeM0/AS1A05_037T01_9000003144_21312cztM0_level2_quad_clean.evt |
| Size (bytes) | 551,211,840 | 98,049,600 |
| Size | 525.7 MB | 93.5 MB |
| Events in quadrant A | 4,198,838 | 614,709 |
| Events in quadrant B | 3,759,555 | 629,364 |
| Events in quadrant C | 3,522,170 | 610,506 |
| Events in quadrant D | 4,701,295 | 589,894 |
| Mode M0 | |||
|---|---|---|---|
| Quadrant | BADHDUFLAG | Total packets | Discarded packets |
| A | 0 | 17469 | 2 |
| B | 0 | 16114 | 2 |
| C | 0 | 15464 | 2 |
| D | 0 | 19111 | 2 |
| Mode SS | |||
|---|---|---|---|
| Quadrant | BADHDUFLAG | Total packets | Discarded packets |
| A | 0 | 152 | 0 |
| B | 0 | 152 | 0 |
| C | 0 | 152 | 0 |
| D | 0 | 152 | 0 |
| Mode M9 | |||
|---|---|---|---|
| Quadrant | BADHDUFLAG | Total packets | Discarded packets |
| A | 0 | 4 | 0 |
| B | 0 | 5 | 0 |
| C | 0 | 5 | 0 |
| D | 0 | 5 | 0 |
| Quadrant | Total seconds | Saturated seconds | Saturation percentage |
|---|---|---|---|
| A | 7546 | 93 | 1.232441% |
| B | 7546 | 53 | 0.702359% |
| C | 7546 | 58 | 0.768619% |
| D | 7546 | 118 | 1.563742% |
Noise dominated data is calculated using 1-second bins in cleaned event files. If a bin has >2000 counts, and if more than 50% of those come from <1% of pixels, then it is considered to be noise-dominated and hence unusable.
| Quadrant | # 1 sec bins | Bins with >0 counts | Bins with >2000 counts | High rate bins dominated by noise | Noise dominated (total time) | Noise dominated (detector-on time) | Marked lightcurve |
|---|---|---|---|---|---|---|---|
| A | 7916 | 7547 | 50 | 50 | 0.63% | 0.66% | 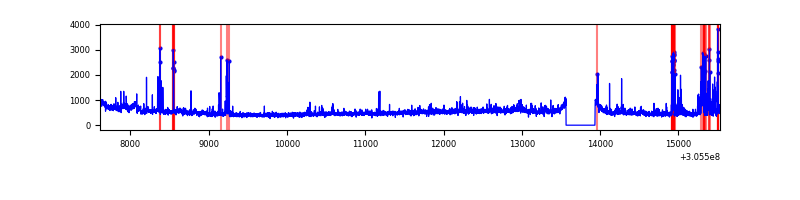 |
| B | 7916 | 7547 | 1 | 1 | 0.01% | 0.01% | 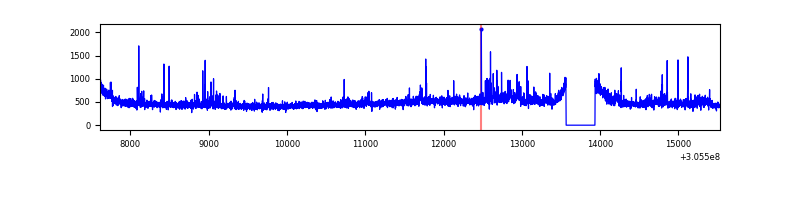 |
| C | 7916 | 7547 | 0 | 0 | 0.00% | 0.00% | 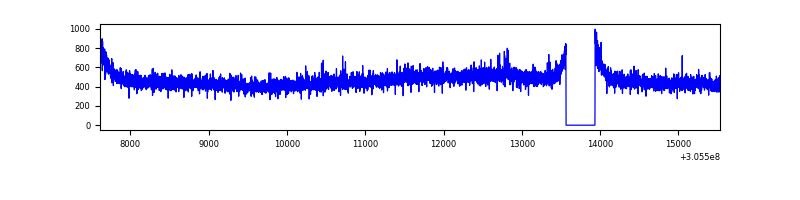 |
| D | 7916 | 7547 | 66 | 66 | 0.83% | 0.87% | 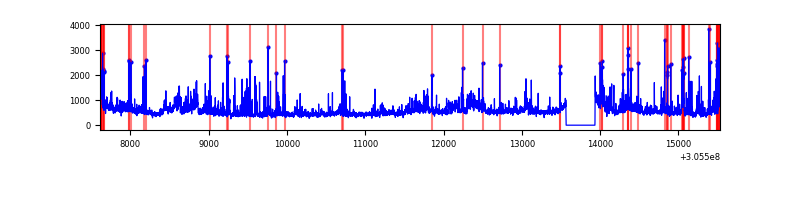 |
Top three noisy pixels from each quadrant. If the there are fewer than three noisy pixels in the level2.evt file, extra rows are filled as -1
| Pixel properties | Quadrant properties | ||||||
|---|---|---|---|---|---|---|---|
| Quadrant | DetID | PixID | Counts | Sigma | Mean | Median | Sigma |
| A | 9 | 143 | 317276 | 1707.71 | 902 | 882 | 185.3 |
| A | 15 | 236 | 223538 | 1201.77 | 902 | 882 | 185.3 |
| A | 11 | 47 | 99564 | 532.63 | 902 | 882 | 185.3 |
| B | 0 | 189 | 109692 | 628.76 | 903 | 879 | 173.1 |
| B | 0 | 230 | 33507 | 188.54 | 903 | 879 | 173.1 |
| B | 0 | 190 | 32569 | 183.12 | 903 | 879 | 173.1 |
| C | 14 | 238 | 134664 | 653.07 | 867 | 873 | 204.9 |
| C | 13 | 61 | 6134 | 25.68 | 867 | 873 | 204.9 |
| C | 0 | 239 | 5678 | 23.45 | 867 | 873 | 204.9 |
| D | 13 | 174 | 555107 | 2609.56 | 871 | 846 | 212.4 |
| D | 1 | 52 | 417895 | 1963.54 | 871 | 846 | 212.4 |
| D | 12 | 235 | 116481 | 544.43 | 871 | 846 | 212.4 |
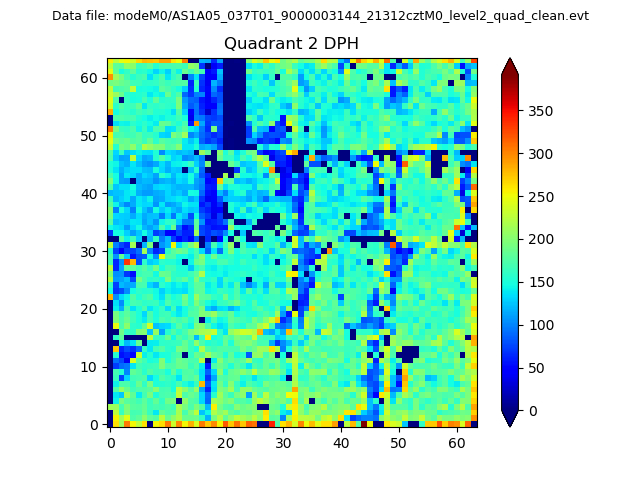
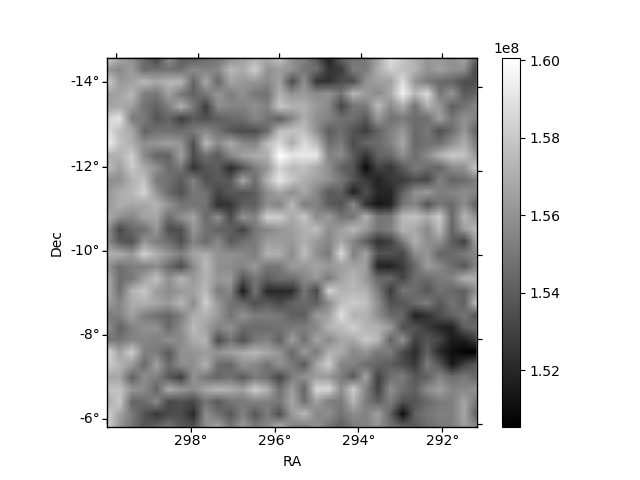
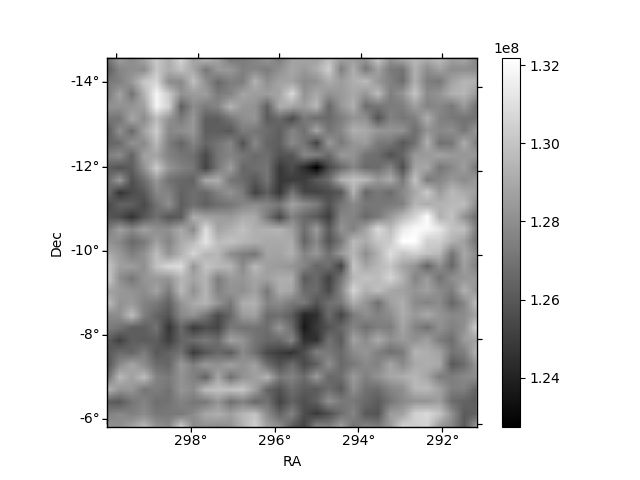
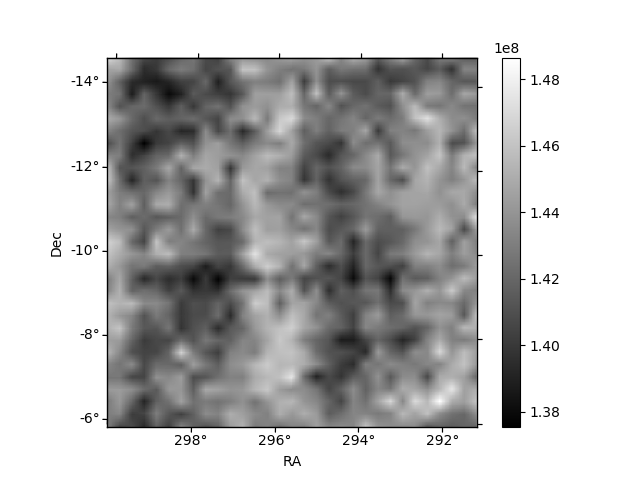
Histogram calculated using DETX and DETY for each event in the final _common_clean file
| Quadrant A | 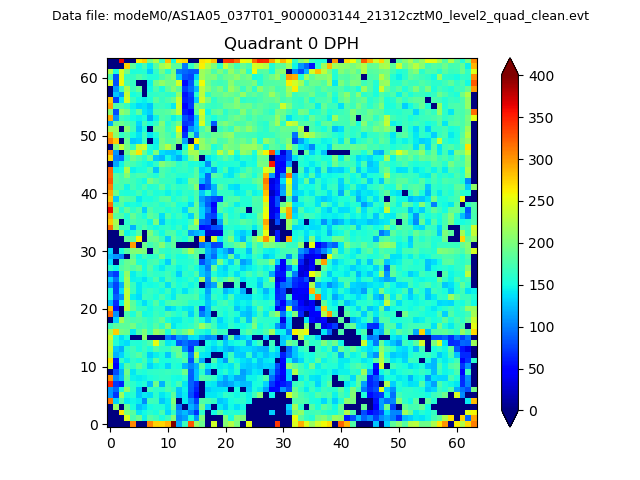 |
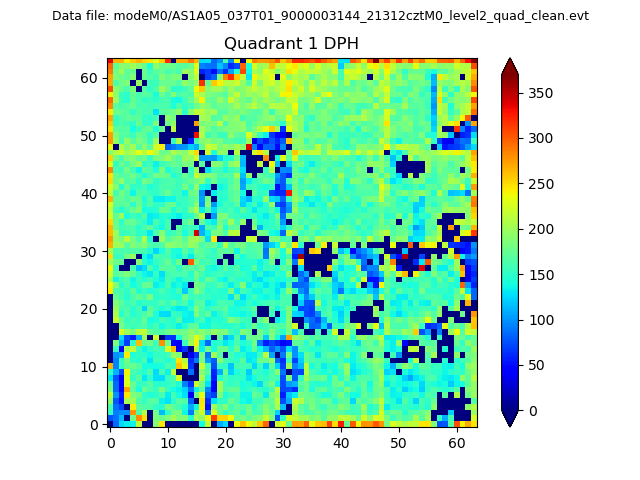 |
Quadrant B |
|---|---|---|---|
| Quadrant D | 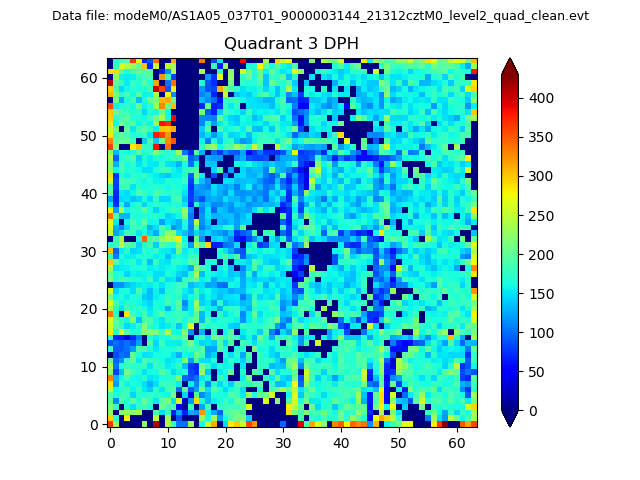 |
 |
Quadrant C |
| Plot type | Count rate plots | Images |
|---|---|---|
| Comparison with Poisson distribution Blue bars denote a histogram of data divided into 1 sec bins. Red curve is a Poisson curve with rate = median count rate of data. |
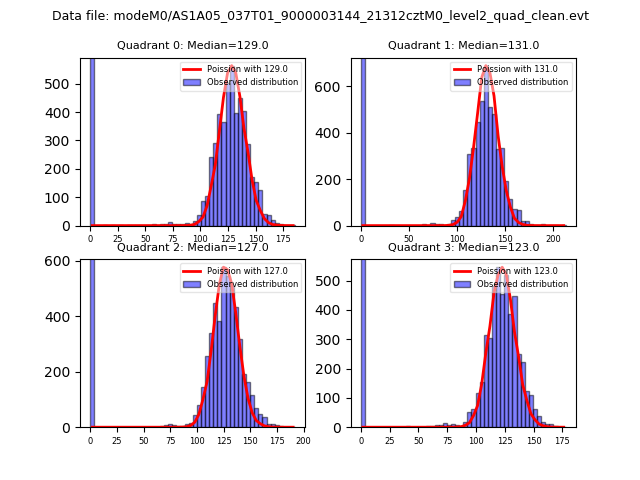 |
 |
| Quadrant-wise count rates Data is divided into 100 sec bins |
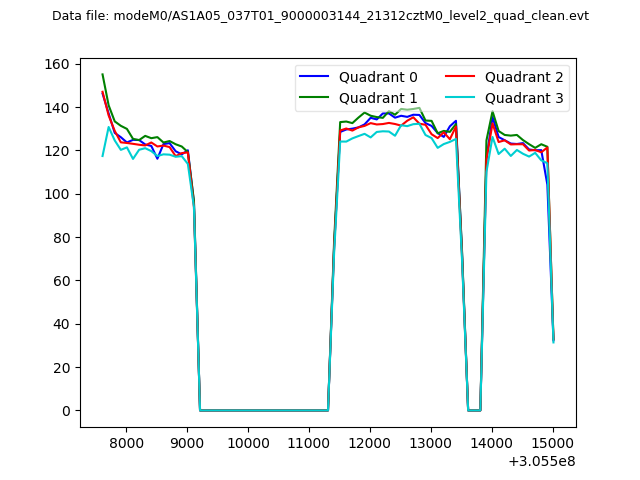 |
|
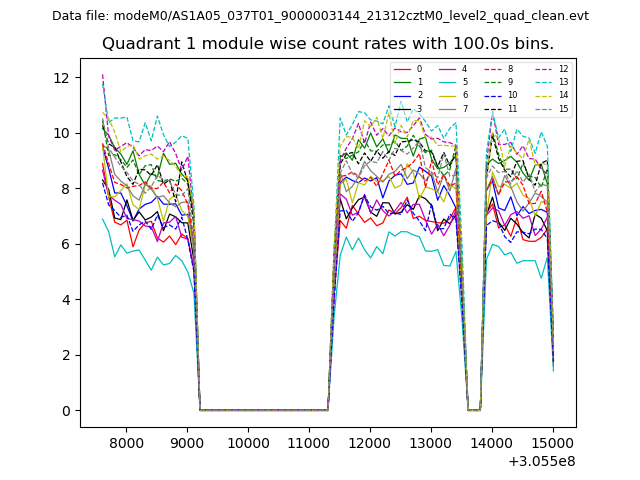
| Module-wise count rates for Quadrant A Data is divided into 100 sec bins |
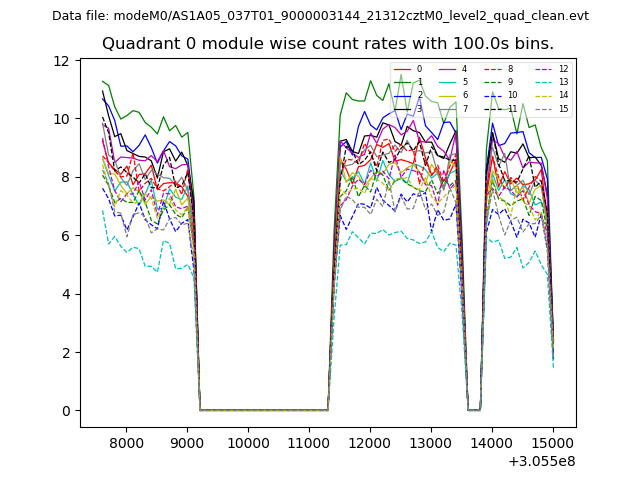 |
 |
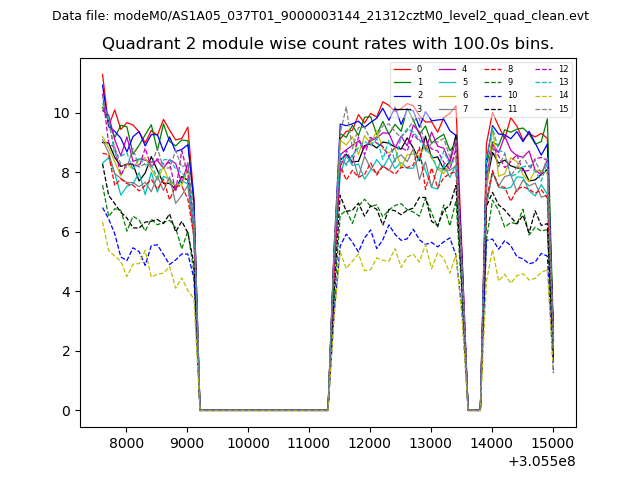
| Module-wise count rates for Quadrant B Data is divided into 100 sec bins |
 |
 |
| Module-wise count rates for Quadrant C Data is divided into 100 sec bins |
 |
 |
| Module-wise count rates for Quadrant D Data is divided into 100 sec bins |
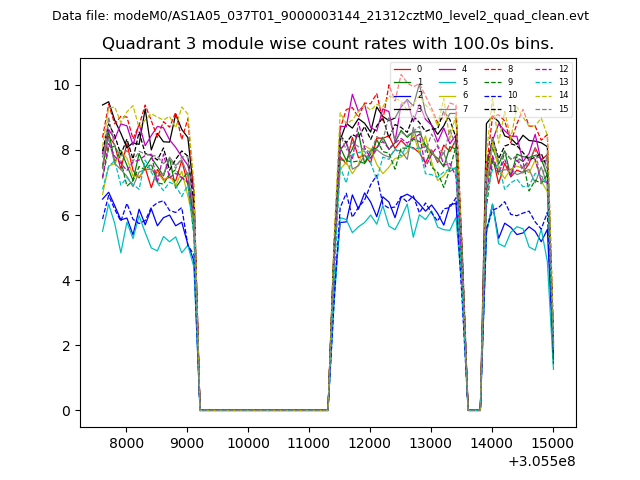 |
 |
| Parameter | Plot |
|---|---|
| CZT HV Monitor | 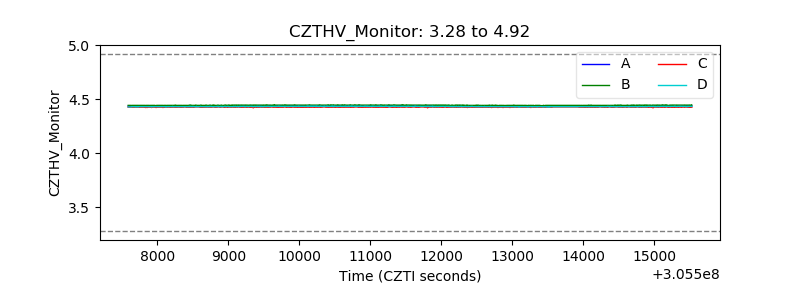 |
| D_VDD |  |
| Temperature 1 | 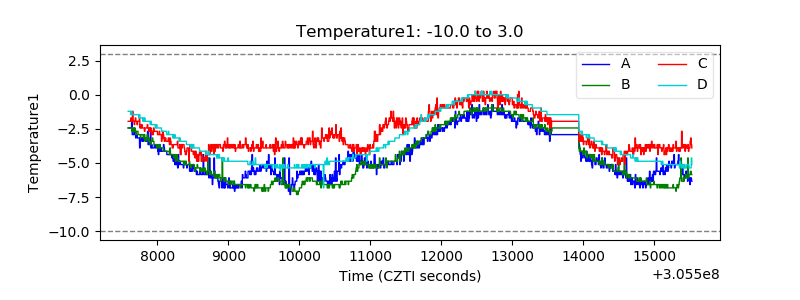 |
| Veto HV Monitor | 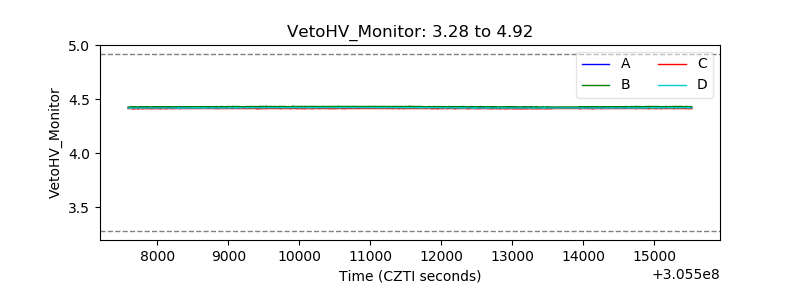 |
| Veto LLD | 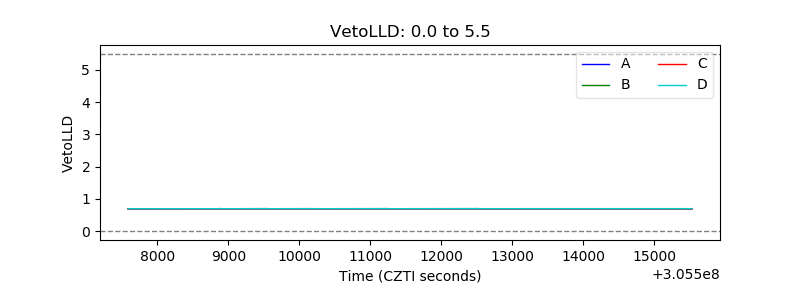 |
| Alpha Counter | 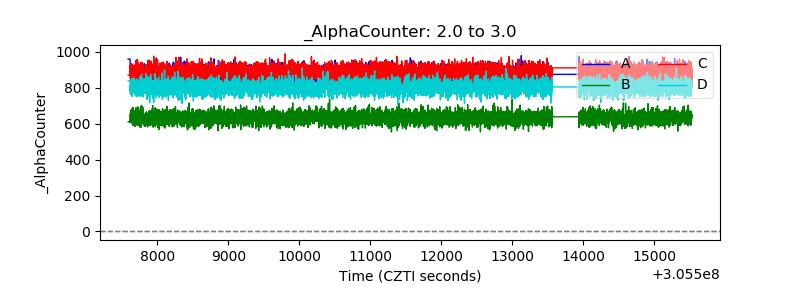 |
| _CPM_Rate | 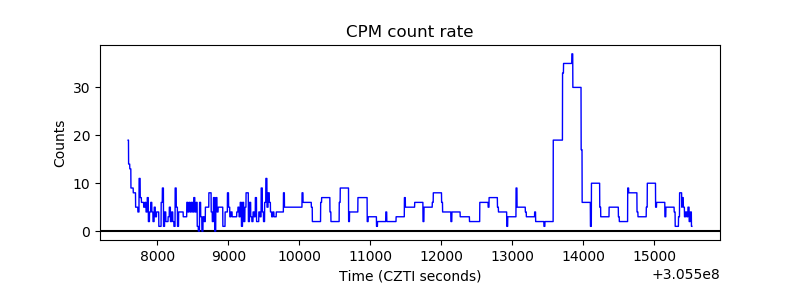 |
| CZT Counter | 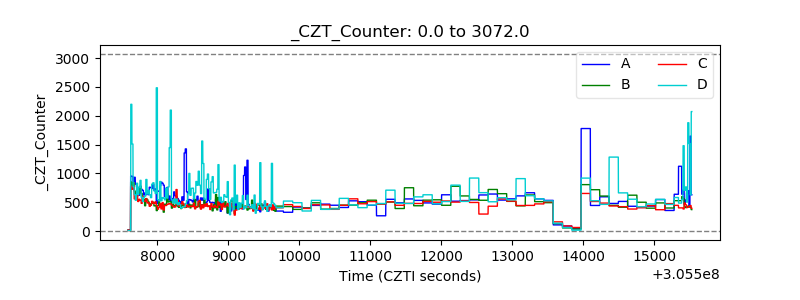 |
| +2.5 Volts monitor |  |
| +5 Volts monitor |  |
| _ROLL_ROT | 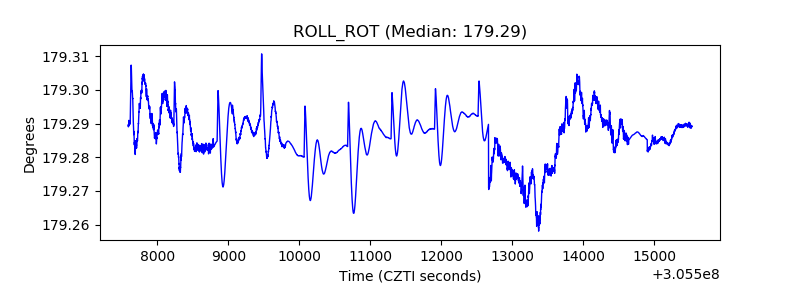 |
| _Roll_DEC | 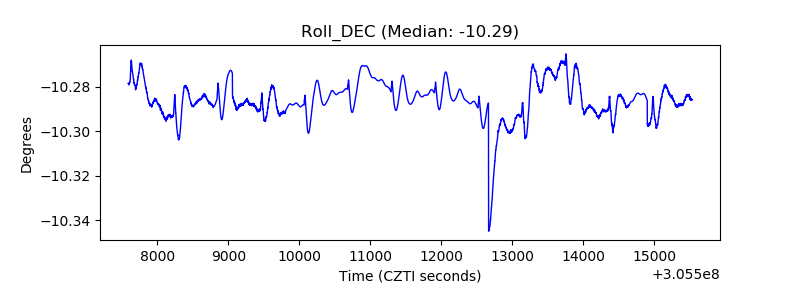 |
| _Roll_RA |  |
| Veto Counter | 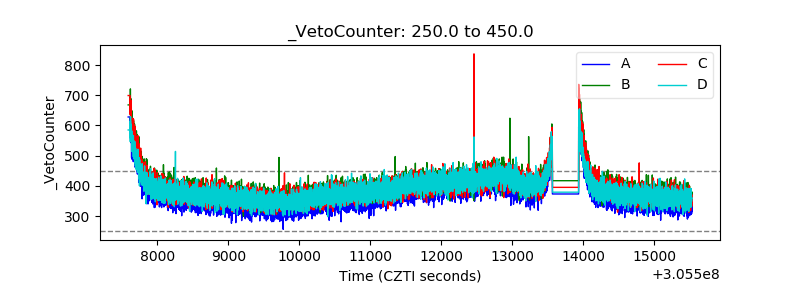 |