| Param | Original file | Final file |
|---|---|---|
| Filename | modeM0/AS1A05_037T01_9000003144_21315cztM0_level2.evt | modeM0/AS1A05_037T01_9000003144_21315cztM0_level2_quad_clean.evt |
| Size (bytes) | 1,399,919,040 | 226,800,000 |
| Size | 1.3 GB | 216.3 MB |
| Events in quadrant A | 10,636,134 | 1,403,194 |
| Events in quadrant B | 9,466,011 | 1,434,139 |
| Events in quadrant C | 9,025,450 | 1,395,012 |
| Events in quadrant D | 11,975,929 | 1,317,432 |
| Mode M0 | |||
|---|---|---|---|
| Quadrant | BADHDUFLAG | Total packets | Discarded packets |
| A | 0 | 43772 | 4 |
| B | 0 | 40103 | 4 |
| C | 0 | 39003 | 4 |
| D | 0 | 48548 | 4 |
| Mode SS | |||
|---|---|---|---|
| Quadrant | BADHDUFLAG | Total packets | Discarded packets |
| A | 0 | 394 | 0 |
| B | 0 | 394 | 0 |
| C | 0 | 394 | 0 |
| D | 0 | 394 | 0 |
| Mode M9 | |||
|---|---|---|---|
| Quadrant | BADHDUFLAG | Total packets | Discarded packets |
| A | 0 | 23 | 0 |
| B | 0 | 23 | 0 |
| C | 0 | 23 | 0 |
| D | 0 | 23 | 0 |
| Quadrant | Total seconds | Saturated seconds | Saturation percentage |
|---|---|---|---|
| A | 19135 | 228 | 1.191534% |
| B | 19136 | 162 | 0.846572% |
| C | 19136 | 162 | 0.846572% |
| D | 19136 | 686 | 3.584866% |
Noise dominated data is calculated using 1-second bins in cleaned event files. If a bin has >2000 counts, and if more than 50% of those come from <1% of pixels, then it is considered to be noise-dominated and hence unusable.
| Quadrant | # 1 sec bins | Bins with >0 counts | Bins with >2000 counts | High rate bins dominated by noise | Noise dominated (total time) | Noise dominated (detector-on time) | Marked lightcurve |
|---|---|---|---|---|---|---|---|
| A | 21525 | 19137 | 99 | 99 | 0.46% | 0.52% | 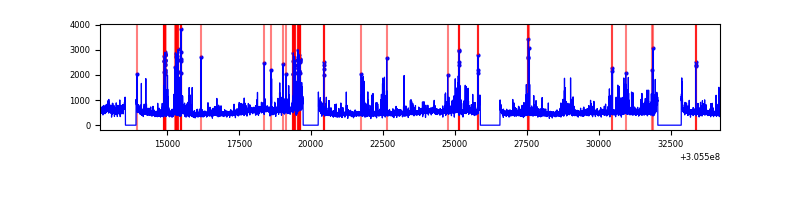 |
| B | 21526 | 19139 | 14 | 14 | 0.07% | 0.07% | 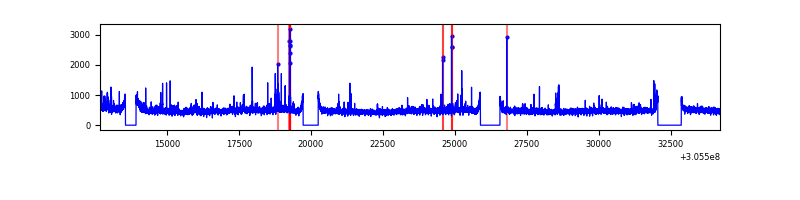 |
| C | 21526 | 19138 | 0 | 0 | 0.00% | 0.00% | 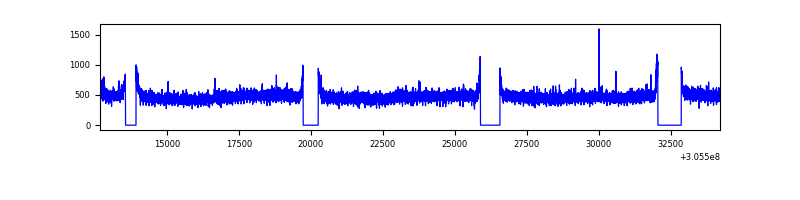 |
| D | 21526 | 19139 | 584 | 584 | 2.71% | 3.05% | 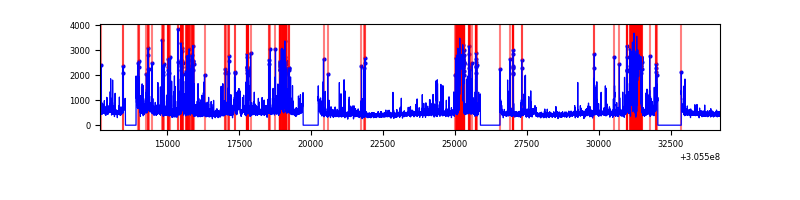 |
Top three noisy pixels from each quadrant. If the there are fewer than three noisy pixels in the level2.evt file, extra rows are filled as -1
| Pixel properties | Quadrant properties | ||||||
|---|---|---|---|---|---|---|---|
| Quadrant | DetID | PixID | Counts | Sigma | Mean | Median | Sigma |
| A | 15 | 236 | 449454 | 964.55 | 2311 | 2268 | 463.6 |
| A | 10 | 253 | 417930 | 896.55 | 2311 | 2268 | 463.6 |
| A | 9 | 143 | 366657 | 785.96 | 2311 | 2268 | 463.6 |
| B | 0 | 189 | 166031 | 372.44 | 2310 | 2249 | 439.7 |
| B | 3 | 64 | 119036 | 265.58 | 2310 | 2249 | 439.7 |
| B | 0 | 190 | 62763 | 137.61 | 2310 | 2249 | 439.7 |
| C | 14 | 238 | 344422 | 658.52 | 2219 | 2239 | 519.6 |
| C | 13 | 61 | 15744 | 25.99 | 2219 | 2239 | 519.6 |
| C | 10 | 91 | 13541 | 21.75 | 2219 | 2239 | 519.6 |
| D | 12 | 233 | 1351295 | 2519.3 | 2211 | 2152 | 535.5 |
| D | 13 | 174 | 858285 | 1598.69 | 2211 | 2152 | 535.5 |
| D | 1 | 52 | 507767 | 944.15 | 2211 | 2152 | 535.5 |
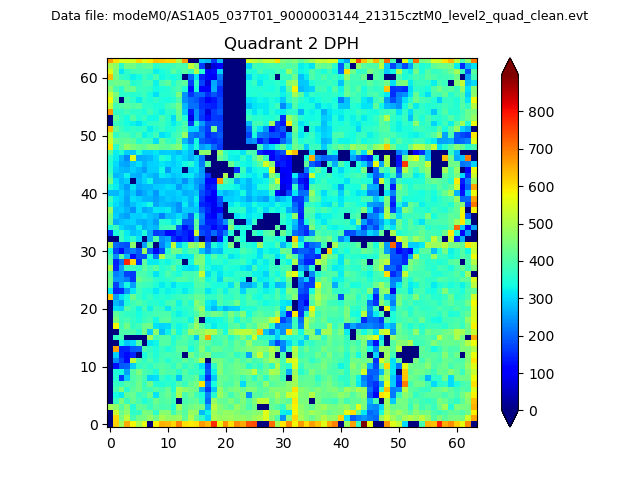
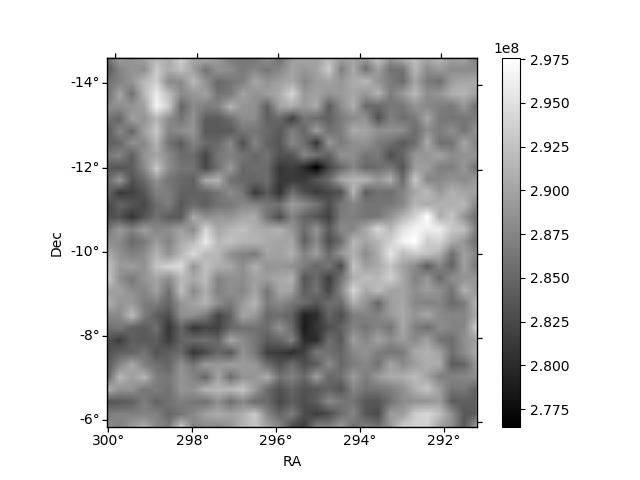
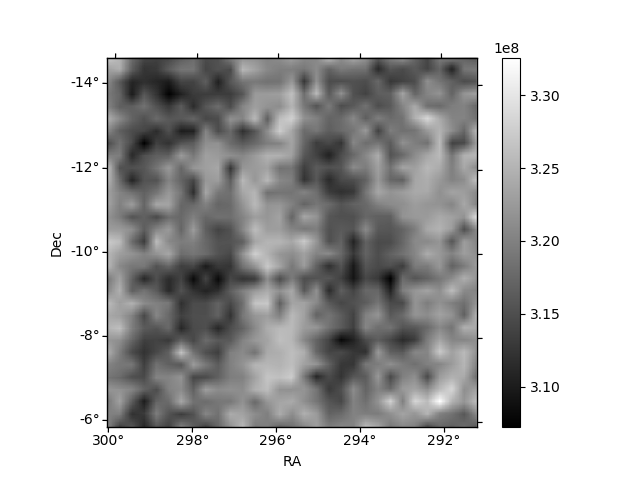
Histogram calculated using DETX and DETY for each event in the final _common_clean file
| Quadrant A | 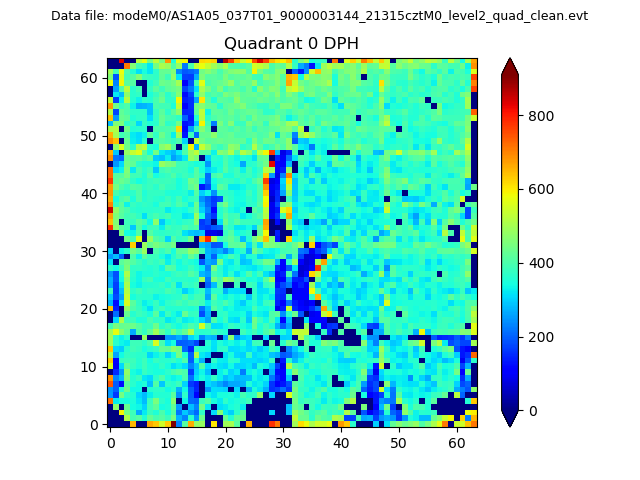 |
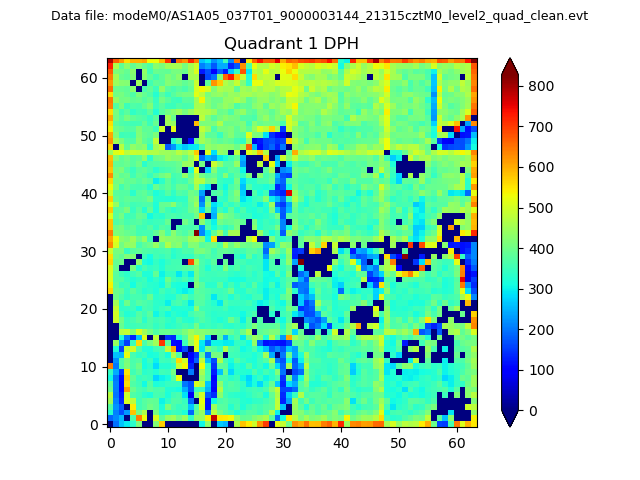 |
Quadrant B |
|---|---|---|---|
| Quadrant D | 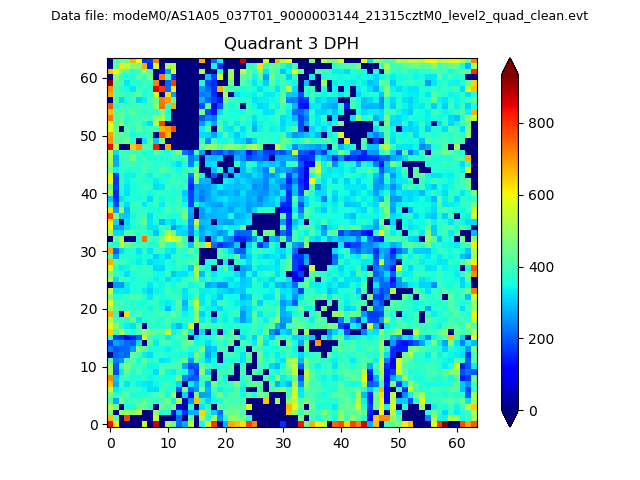 |
 |
Quadrant C |
| Plot type | Count rate plots | Images |
|---|---|---|
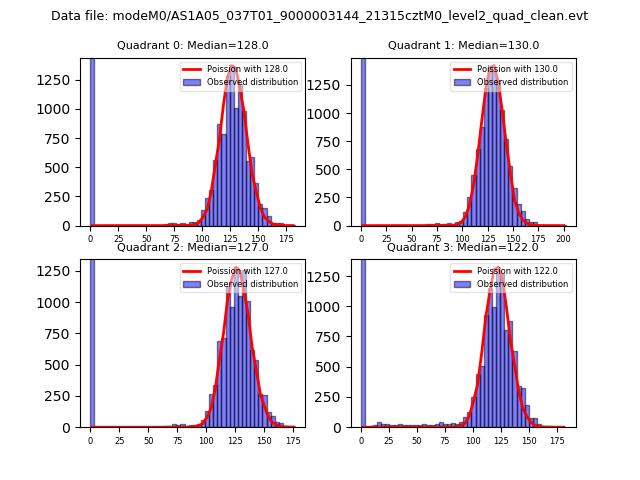
| Comparison with Poisson distribution Blue bars denote a histogram of data divided into 1 sec bins. Red curve is a Poisson curve with rate = median count rate of data. |
 |
 |
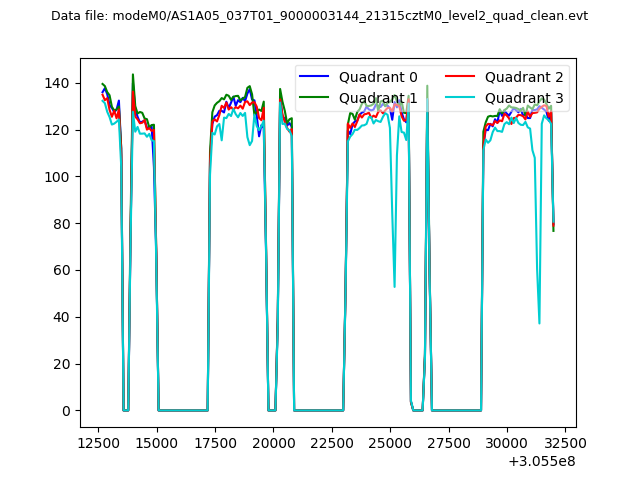
| Quadrant-wise count rates Data is divided into 100 sec bins |
 |
|
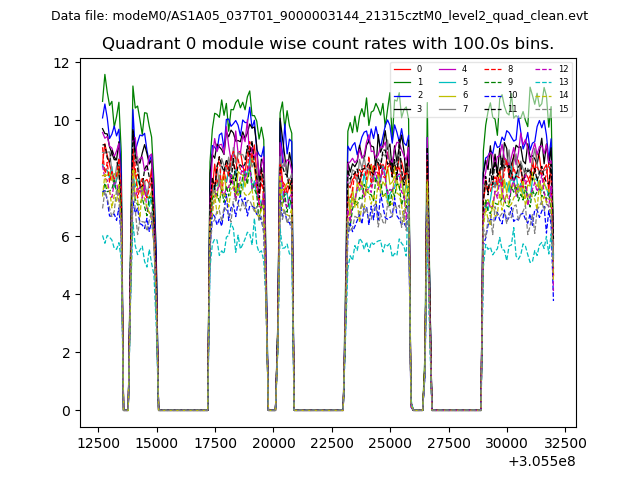
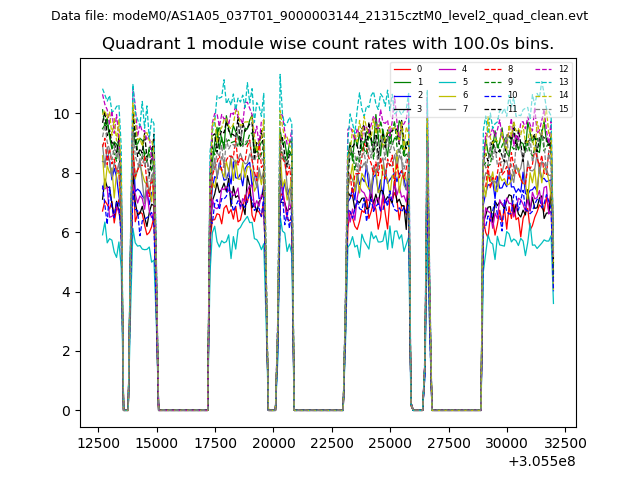
| Module-wise count rates for Quadrant A Data is divided into 100 sec bins |
 |
 |
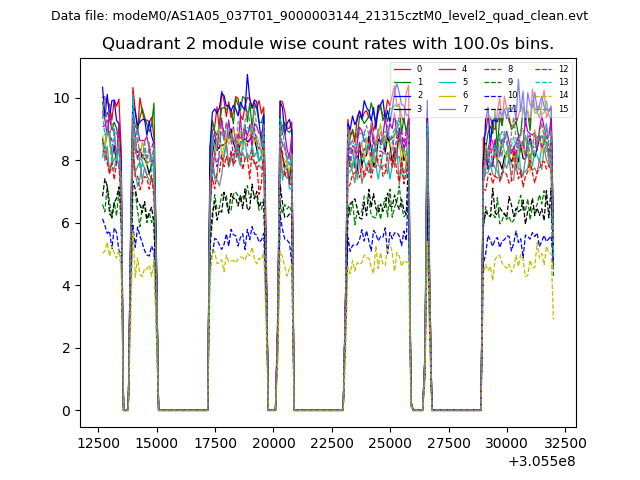
| Module-wise count rates for Quadrant B Data is divided into 100 sec bins |
 |
 |
| Module-wise count rates for Quadrant C Data is divided into 100 sec bins |
 |
 |
| Module-wise count rates for Quadrant D Data is divided into 100 sec bins |
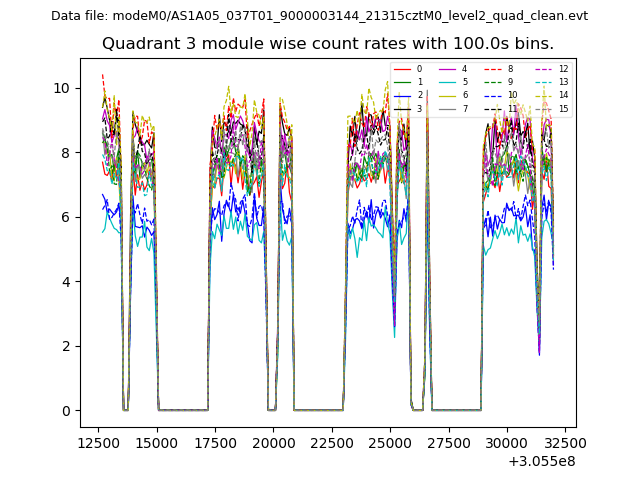 |
 |
| Parameter | Plot |
|---|---|
| CZT HV Monitor |  |
| D_VDD | 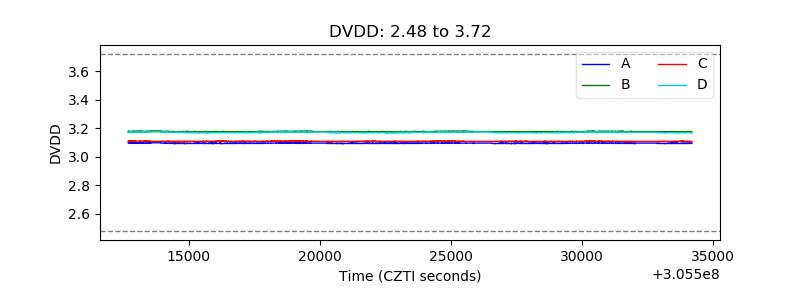 |
| Temperature 1 | 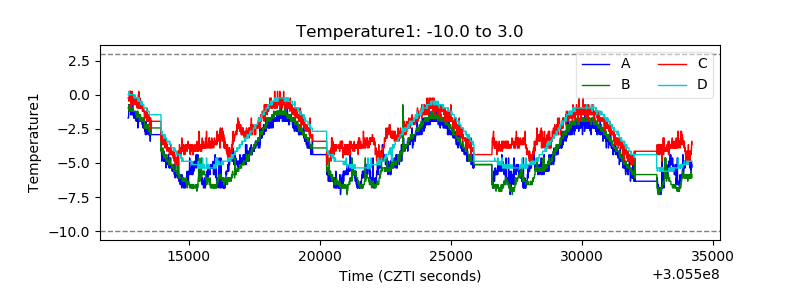 |
| Veto HV Monitor | 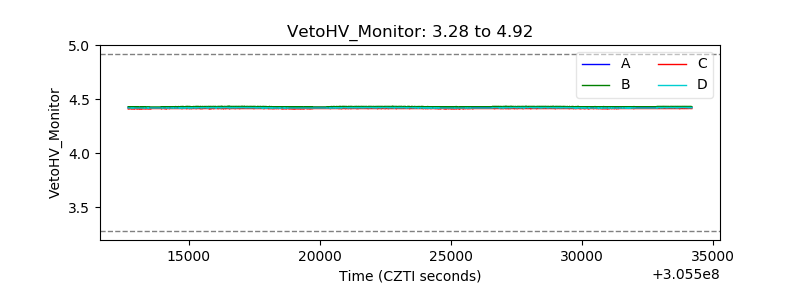 |
| Veto LLD | 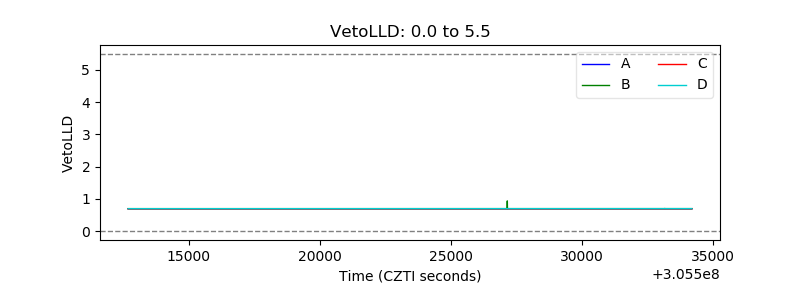 |
| Alpha Counter | 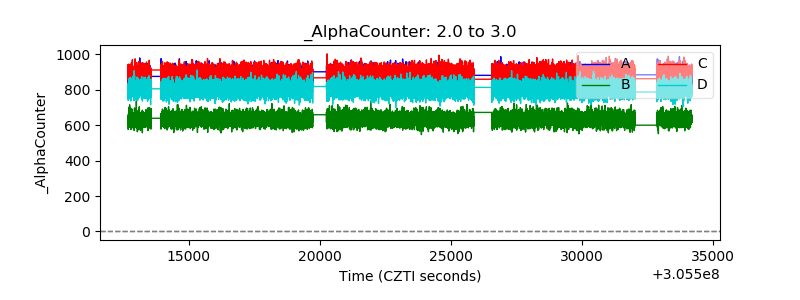 |
| _CPM_Rate | 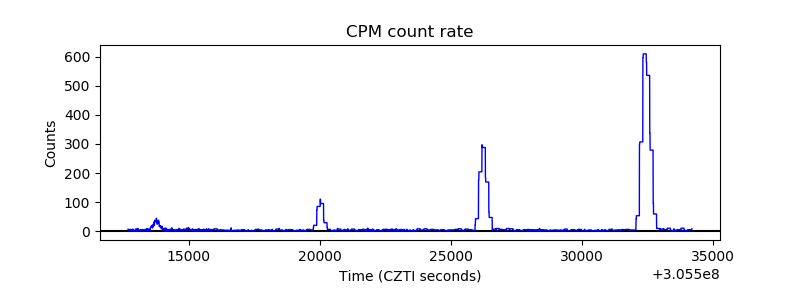 |
| CZT Counter | 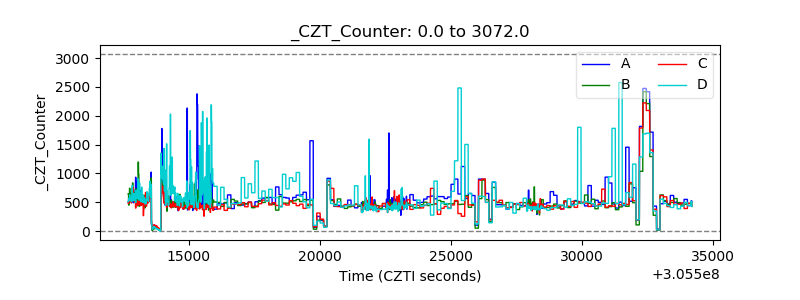 |
| +2.5 Volts monitor |  |
| +5 Volts monitor |  |
| _ROLL_ROT |  |
| _Roll_DEC | 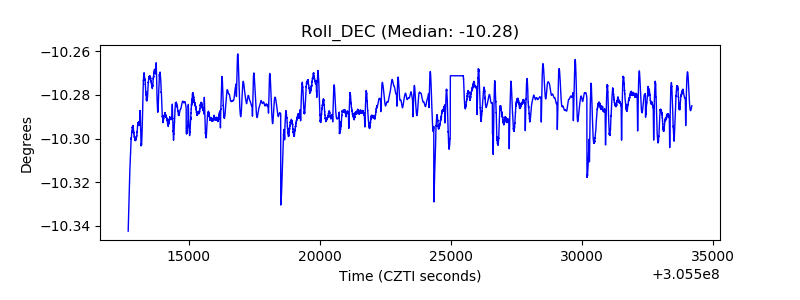 |
| _Roll_RA | 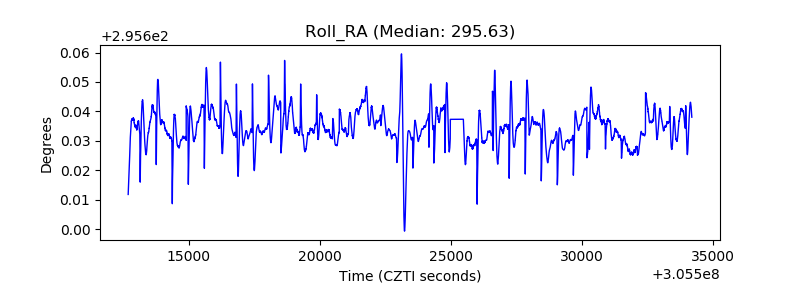 |
| Veto Counter |  |