| Param | Original file | Final file |
|---|---|---|
| Filename | modeM0/AS1A05_037T01_9000003144_21316cztM0_level2.evt | modeM0/AS1A05_037T01_9000003144_21316cztM0_level2_quad_clean.evt |
| Size (bytes) | 482,722,560 | 75,021,120 |
| Size | 460.4 MB | 71.5 MB |
| Events in quadrant A | 3,633,209 | 451,602 |
| Events in quadrant B | 3,426,583 | 461,478 |
| Events in quadrant C | 3,345,546 | 447,447 |
| Events in quadrant D | 3,751,142 | 436,395 |
| Mode M0 | |||
|---|---|---|---|
| Quadrant | BADHDUFLAG | Total packets | Discarded packets |
| A | 0 | 14945 | 2 |
| B | 0 | 14301 | 2 |
| C | 0 | 14152 | 2 |
| D | 0 | 15590 | 2 |
| Mode SS | |||
|---|---|---|---|
| Quadrant | BADHDUFLAG | Total packets | Discarded packets |
| A | 0 | 142 | 0 |
| B | 0 | 142 | 0 |
| C | 0 | 142 | 0 |
| D | 0 | 142 | 0 |
| Mode M9 | |||
|---|---|---|---|
| Quadrant | BADHDUFLAG | Total packets | Discarded packets |
| A | 0 | 17 | 0 |
| B | 0 | 17 | 0 |
| C | 0 | 17 | 0 |
| D | 0 | 17 | 0 |
| Quadrant | Total seconds | Saturated seconds | Saturation percentage |
|---|---|---|---|
| A | 6806 | 120 | 1.763150% |
| B | 6806 | 120 | 1.763150% |
| C | 6807 | 131 | 1.924489% |
| D | 6806 | 126 | 1.851308% |
Noise dominated data is calculated using 1-second bins in cleaned event files. If a bin has >2000 counts, and if more than 50% of those come from <1% of pixels, then it is considered to be noise-dominated and hence unusable.
| Quadrant | # 1 sec bins | Bins with >0 counts | Bins with >2000 counts | High rate bins dominated by noise | Noise dominated (total time) | Noise dominated (detector-on time) | Marked lightcurve |
|---|---|---|---|---|---|---|---|
| A | 8596 | 6806 | 13 | 13 | 0.15% | 0.19% | 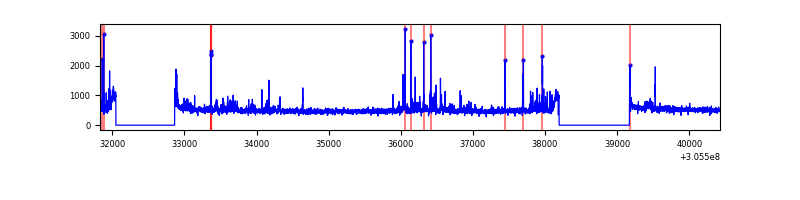 |
| B | 8596 | 6806 | 1 | 1 | 0.01% | 0.01% | 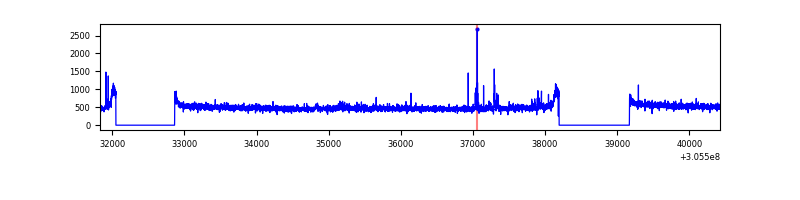 |
| C | 8597 | 6807 | 0 | 0 | 0.00% | 0.00% |  |
| D | 8596 | 6806 | 34 | 34 | 0.40% | 0.50% | 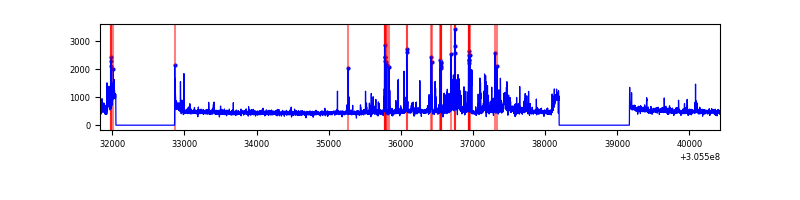 |
Top three noisy pixels from each quadrant. If the there are fewer than three noisy pixels in the level2.evt file, extra rows are filled as -1
| Pixel properties | Quadrant properties | ||||||
|---|---|---|---|---|---|---|---|
| Quadrant | DetID | PixID | Counts | Sigma | Mean | Median | Sigma |
| A | 4 | 2 | 135694 | 773.44 | 859 | 842 | 174.4 |
| A | 5 | 16 | 70621 | 400.21 | 859 | 842 | 174.4 |
| A | 11 | 47 | 28181 | 156.8 | 859 | 842 | 174.4 |
| B | 12 | 111 | 19871 | 115.49 | 859 | 839 | 164.8 |
| B | 3 | 64 | 18691 | 108.33 | 859 | 839 | 164.8 |
| B | 0 | 230 | 17863 | 103.31 | 859 | 839 | 164.8 |
| C | 14 | 238 | 128193 | 656.09 | 824 | 828 | 194.1 |
| C | 13 | 61 | 5777 | 25.49 | 824 | 828 | 194.1 |
| C | 10 | 23 | 4901 | 20.98 | 824 | 828 | 194.1 |
| D | 13 | 153 | 324865 | 1600.41 | 833 | 809 | 202.5 |
| D | 12 | 235 | 126544 | 620.97 | 833 | 809 | 202.5 |
| D | 12 | 233 | 105523 | 517.15 | 833 | 809 | 202.5 |
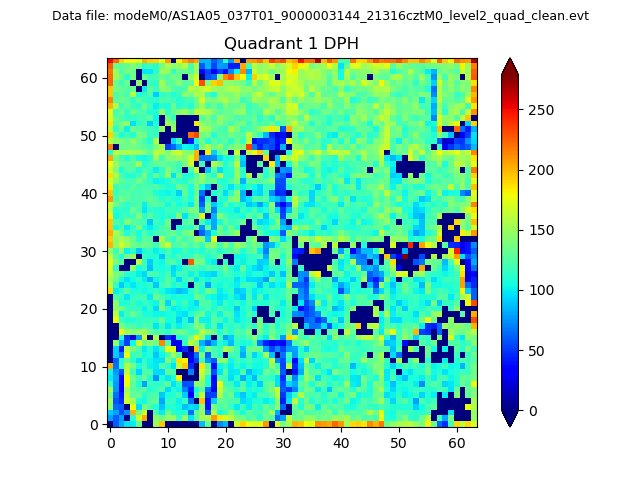
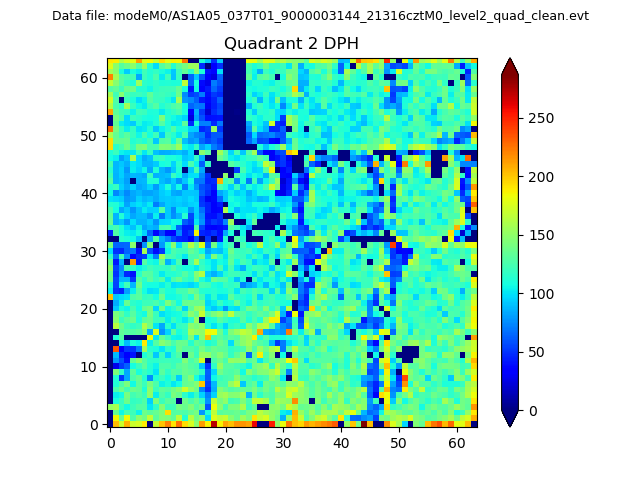
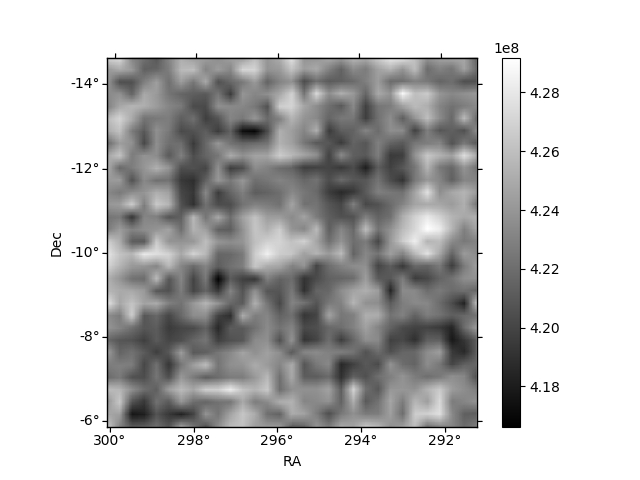
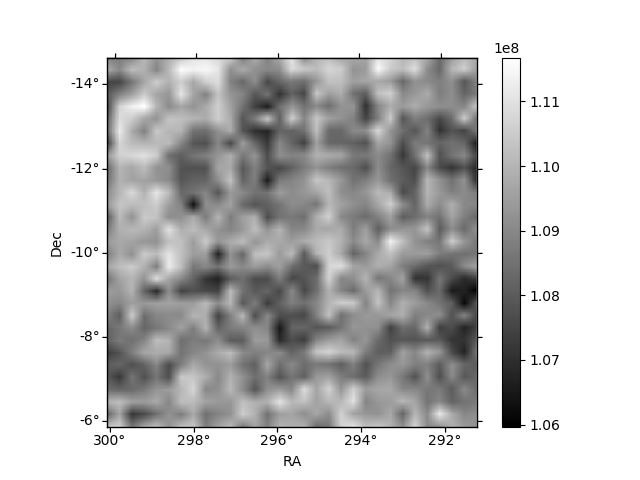
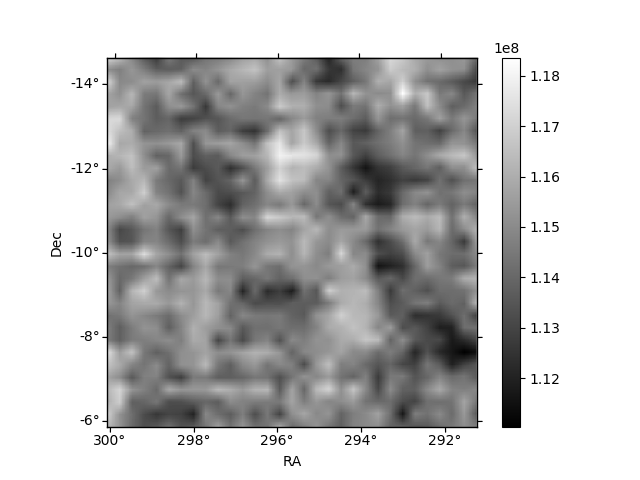
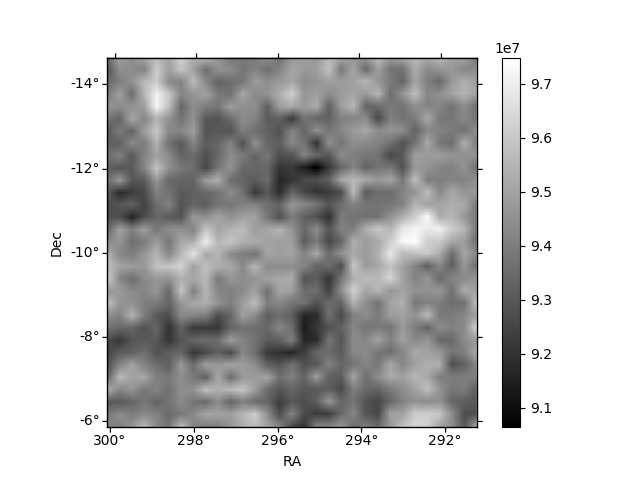
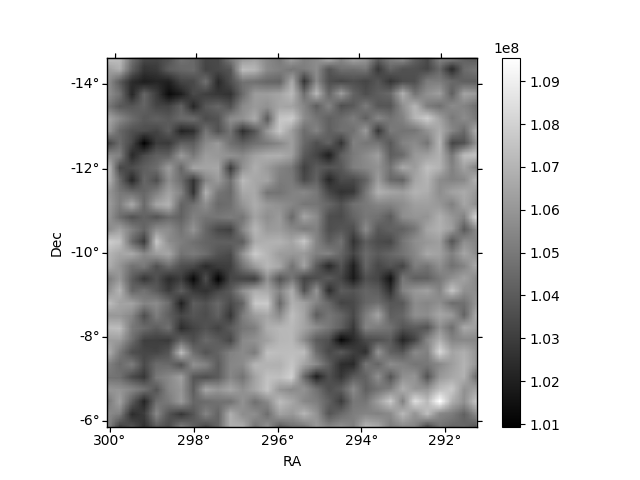
Histogram calculated using DETX and DETY for each event in the final _common_clean file
| Quadrant A | 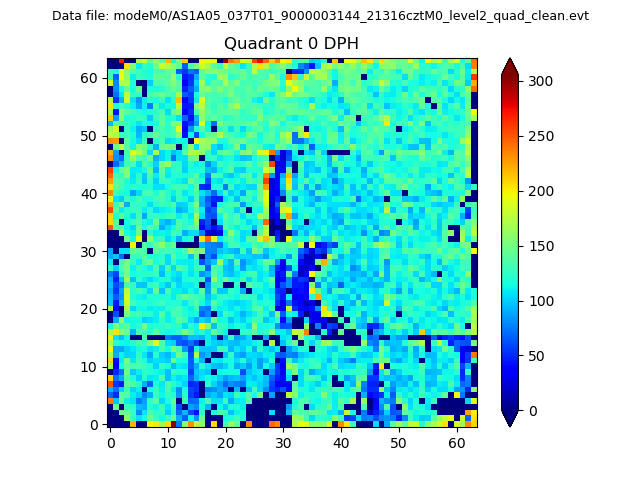 |
 |
Quadrant B |
|---|---|---|---|
| Quadrant D | 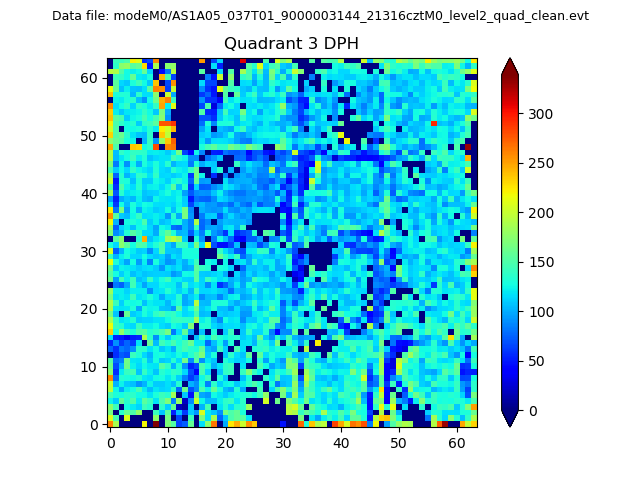 |
 |
Quadrant C |
| Plot type | Count rate plots | Images |
|---|---|---|
| Comparison with Poisson distribution Blue bars denote a histogram of data divided into 1 sec bins. Red curve is a Poisson curve with rate = median count rate of data. |
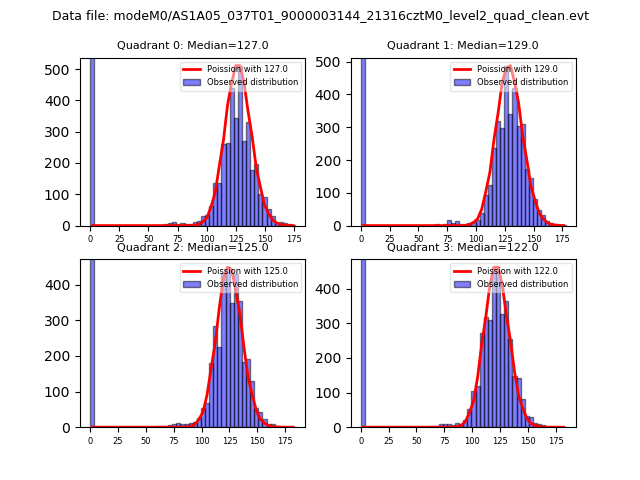 |
 |
| Quadrant-wise count rates Data is divided into 100 sec bins |
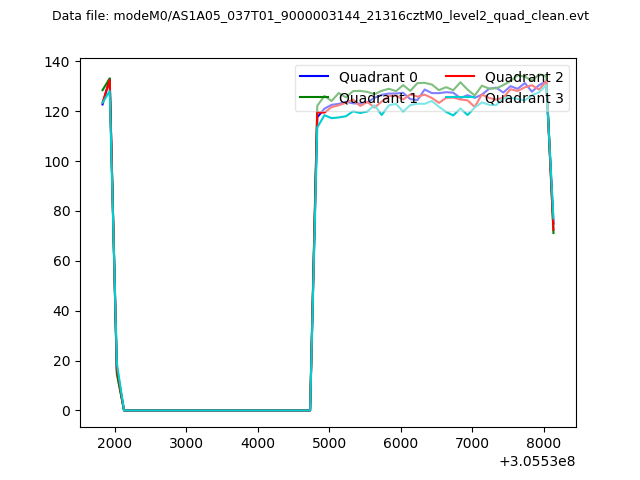 |
|
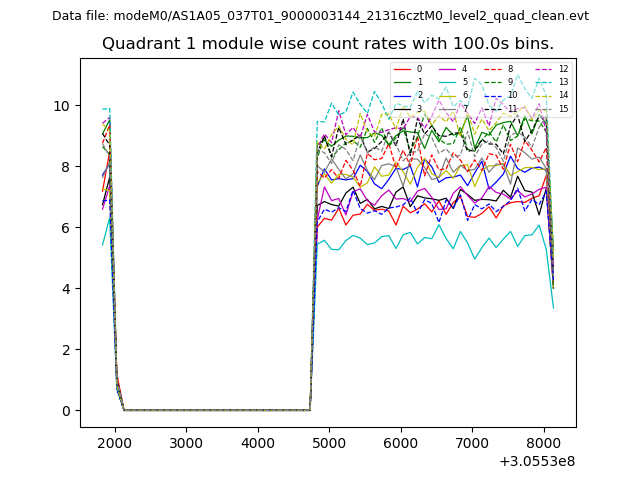
| Module-wise count rates for Quadrant A Data is divided into 100 sec bins |
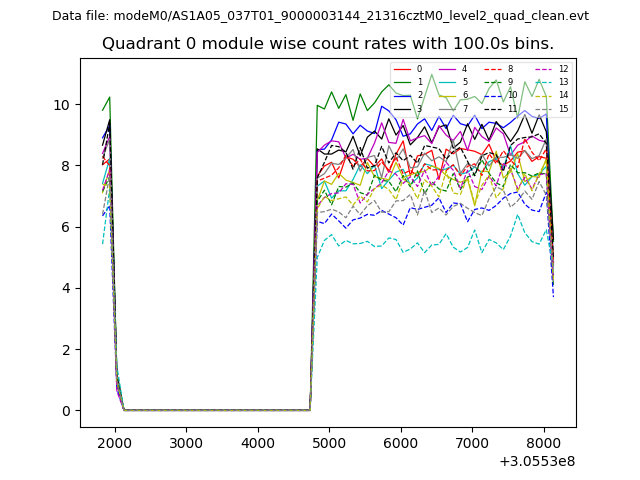 |
 |
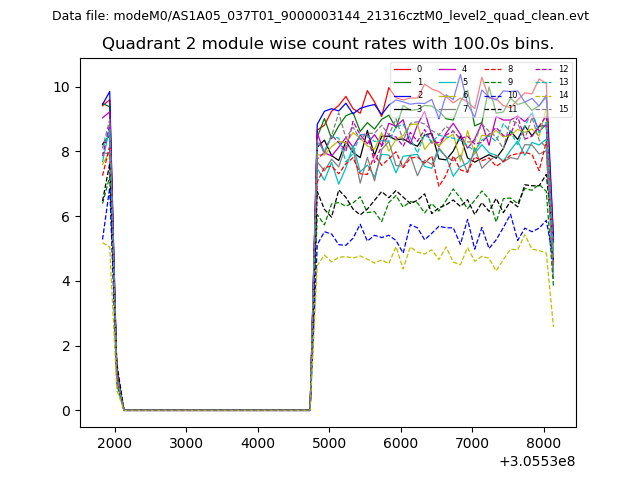
| Module-wise count rates for Quadrant B Data is divided into 100 sec bins |
 |
 |
| Module-wise count rates for Quadrant C Data is divided into 100 sec bins |
 |
 |
| Module-wise count rates for Quadrant D Data is divided into 100 sec bins |
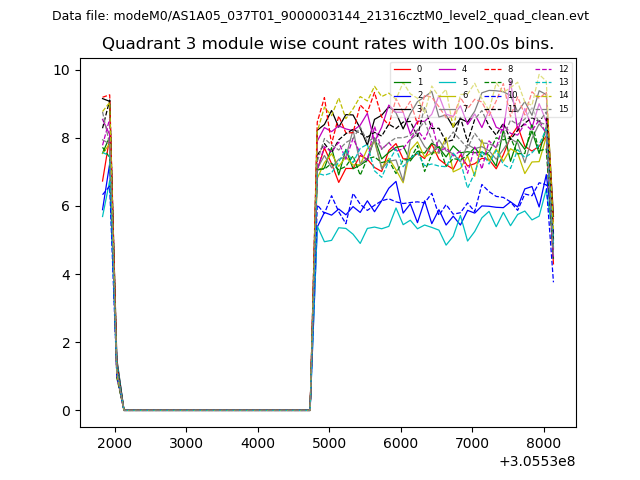 |
 |
| Parameter | Plot |
|---|---|
| CZT HV Monitor | 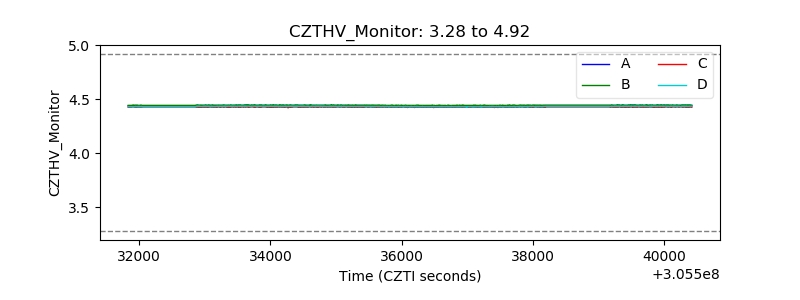 |
| D_VDD | 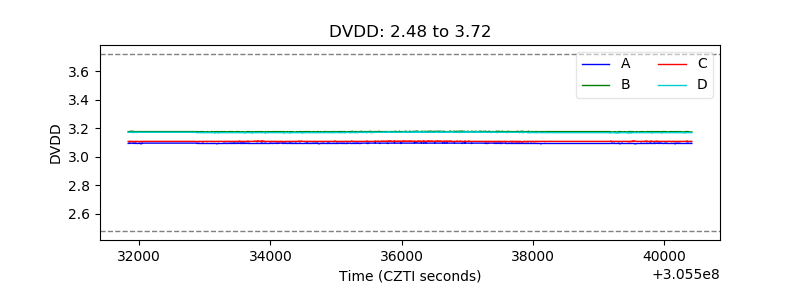 |
| Temperature 1 | 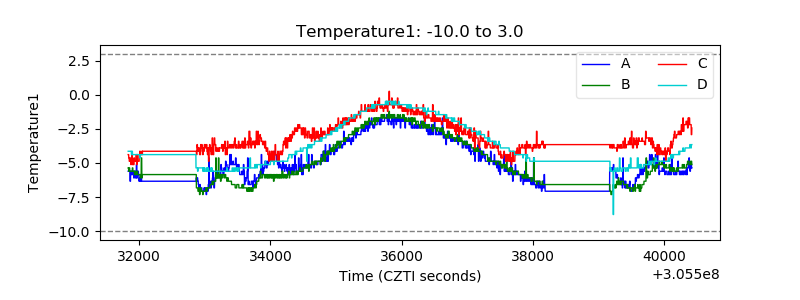 |
| Veto HV Monitor | 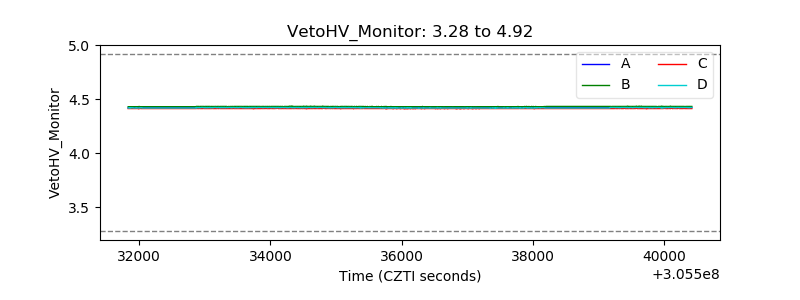 |
| Veto LLD | 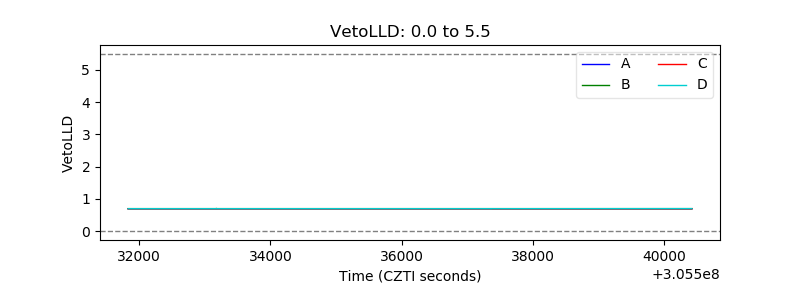 |
| Alpha Counter | 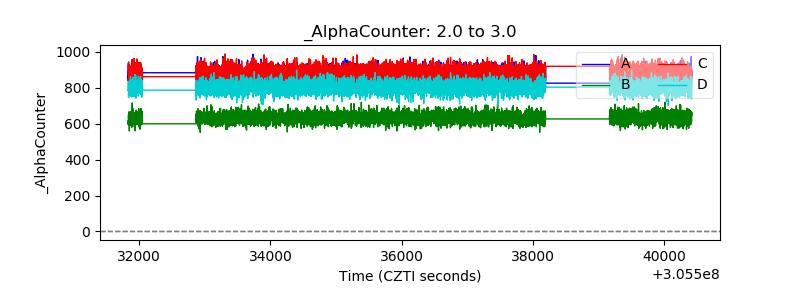 |
| _CPM_Rate | 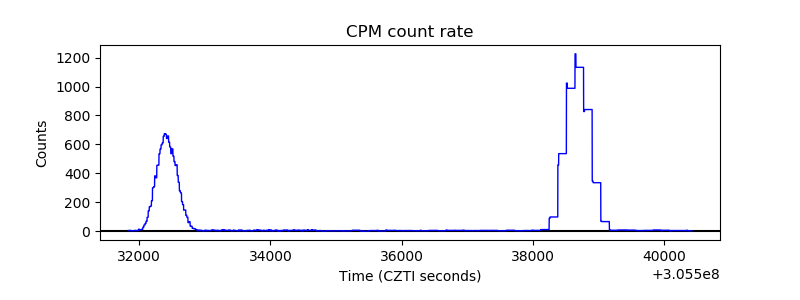 |
| CZT Counter | 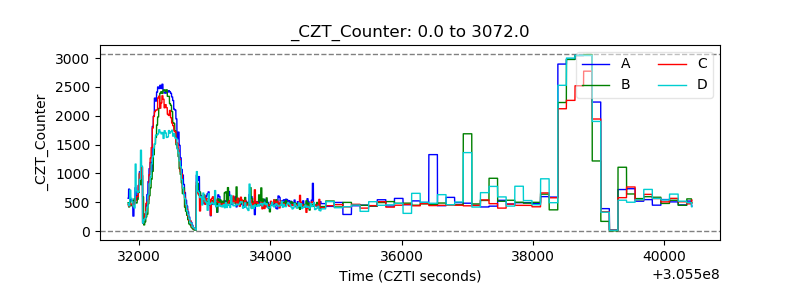 |
| +2.5 Volts monitor | 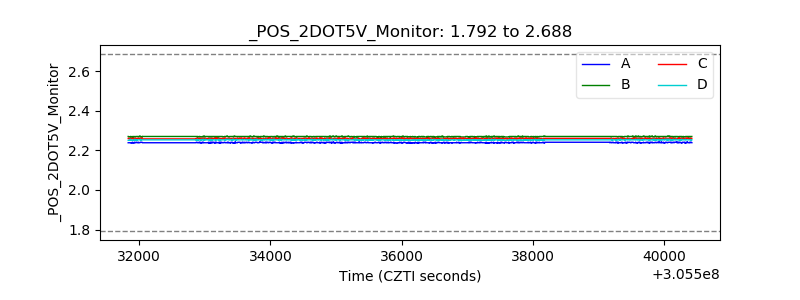 |
| +5 Volts monitor | 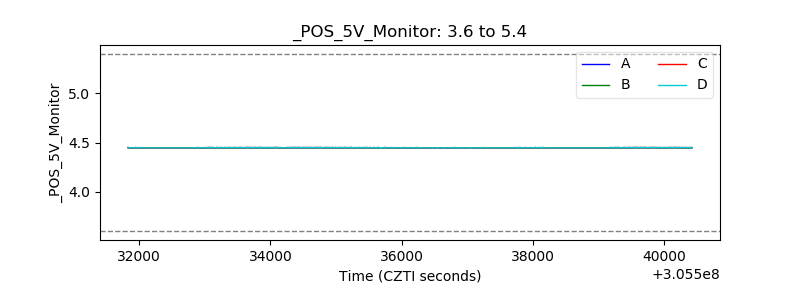 |
| _ROLL_ROT | 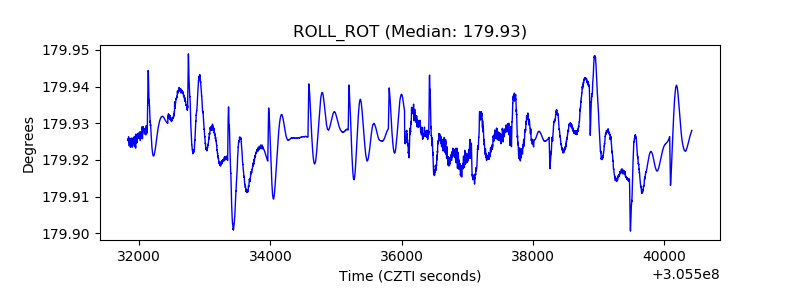 |
| _Roll_DEC | 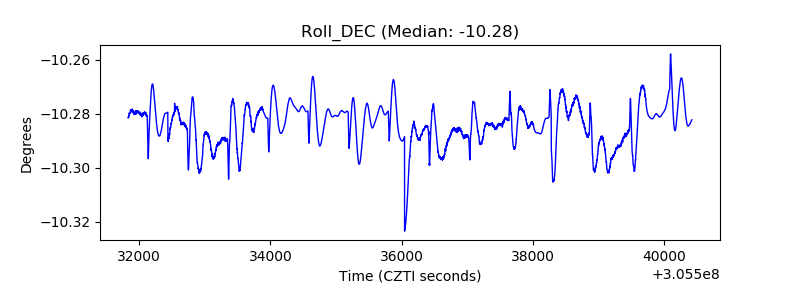 |
| _Roll_RA | 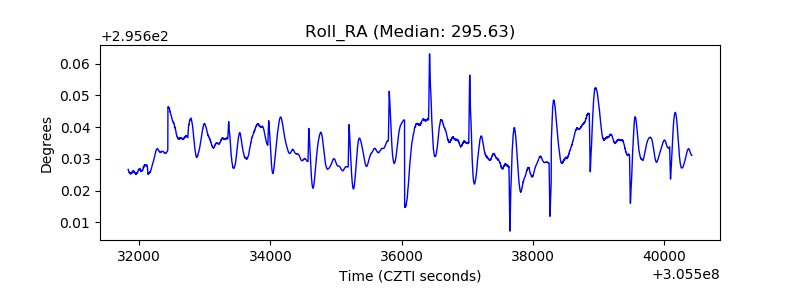 |
| Veto Counter | 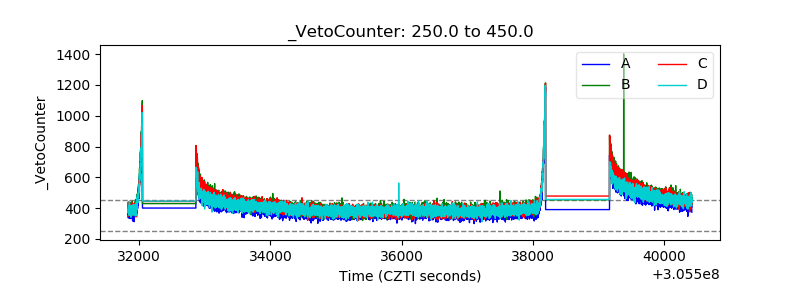 |