| Param | Original file | Final file |
|---|---|---|
| Filename | modeM0/AS1A05_037T01_9000003144_21318cztM0_level2.evt | modeM0/AS1A05_037T01_9000003144_21318cztM0_level2_quad_clean.evt |
| Size (bytes) | 490,648,320 | 80,449,920 |
| Size | 467.9 MB | 76.7 MB |
| Events in quadrant A | 4,375,419 | 494,636 |
| Events in quadrant B | 3,369,563 | 512,519 |
| Events in quadrant C | 3,263,586 | 494,706 |
| Events in quadrant D | 3,412,366 | 484,054 |
| Mode M0 | |||
|---|---|---|---|
| Quadrant | BADHDUFLAG | Total packets | Discarded packets |
| A | 0 | 16977 | 2 |
| B | 0 | 13969 | 2 |
| C | 0 | 13708 | 2 |
| D | 0 | 14157 | 2 |
| Mode SS | |||
|---|---|---|---|
| Quadrant | BADHDUFLAG | Total packets | Discarded packets |
| A | 0 | 132 | 0 |
| B | 0 | 132 | 0 |
| C | 0 | 132 | 0 |
| D | 0 | 132 | 0 |
| Mode M9 | |||
|---|---|---|---|
| Quadrant | BADHDUFLAG | Total packets | Discarded packets |
| A | 0 | 15 | 0 |
| B | 0 | 16 | 0 |
| C | 0 | 16 | 0 |
| D | 0 | 16 | 0 |
| Quadrant | Total seconds | Saturated seconds | Saturation percentage |
|---|---|---|---|
| A | 6451 | 557 | 8.634320% |
| B | 6451 | 66 | 1.023097% |
| C | 6450 | 80 | 1.240310% |
| D | 6450 | 40 | 0.620155% |
Noise dominated data is calculated using 1-second bins in cleaned event files. If a bin has >2000 counts, and if more than 50% of those come from <1% of pixels, then it is considered to be noise-dominated and hence unusable.
| Quadrant | # 1 sec bins | Bins with >0 counts | Bins with >2000 counts | High rate bins dominated by noise | Noise dominated (total time) | Noise dominated (detector-on time) | Marked lightcurve |
|---|---|---|---|---|---|---|---|
| A | 7576 | 6451 | 431 | 431 | 5.69% | 6.68% | 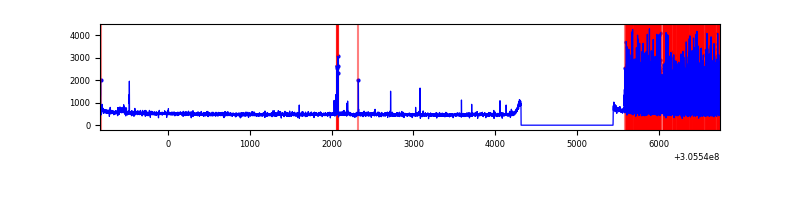 |
| B | 7576 | 6451 | 2 | 2 | 0.03% | 0.03% | 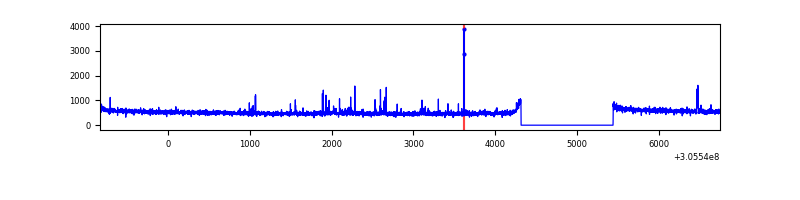 |
| C | 7575 | 6450 | 1 | 1 | 0.01% | 0.02% | 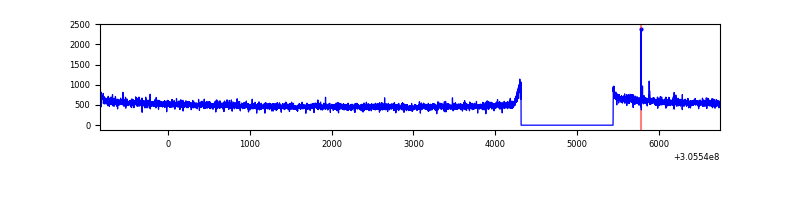 |
| D | 7575 | 6450 | 12 | 12 | 0.16% | 0.19% | 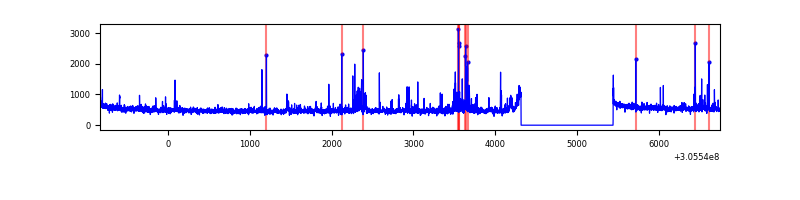 |
Top three noisy pixels from each quadrant. If the there are fewer than three noisy pixels in the level2.evt file, extra rows are filled as -1
| Pixel properties | Quadrant properties | ||||||
|---|---|---|---|---|---|---|---|
| Quadrant | DetID | PixID | Counts | Sigma | Mean | Median | Sigma |
| A | 15 | 236 | 1188017 | 7376.09 | 800 | 786 | 161.0 |
| A | 5 | 16 | 48291 | 295.14 | 800 | 786 | 161.0 |
| A | 8 | 192 | 34097 | 206.96 | 800 | 786 | 161.0 |
| B | 3 | 64 | 36871 | 226.2 | 839 | 821 | 159.4 |
| B | 0 | 190 | 26433 | 160.71 | 839 | 821 | 159.4 |
| B | 12 | 111 | 18978 | 113.93 | 839 | 821 | 159.4 |
| C | 14 | 238 | 126420 | 676.9 | 802 | 807 | 185.6 |
| C | 10 | 23 | 8457 | 41.22 | 802 | 807 | 185.6 |
| C | 13 | 61 | 5673 | 26.22 | 802 | 807 | 185.6 |
| D | 13 | 153 | 135092 | 687.45 | 815 | 793 | 195.4 |
| D | 12 | 235 | 92026 | 467.01 | 815 | 793 | 195.4 |
| D | 1 | 52 | 49211 | 247.84 | 815 | 793 | 195.4 |
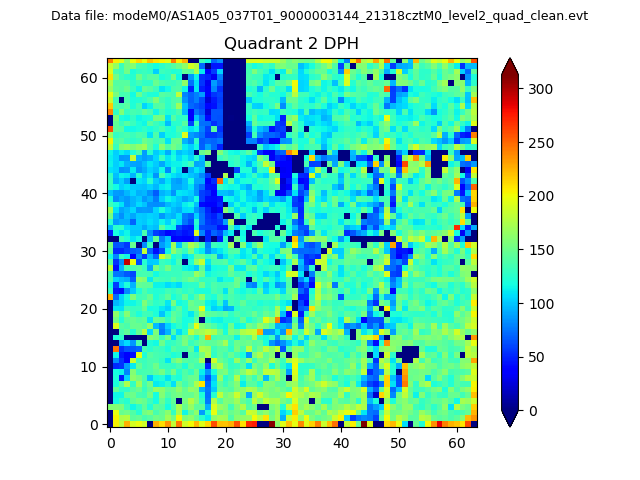
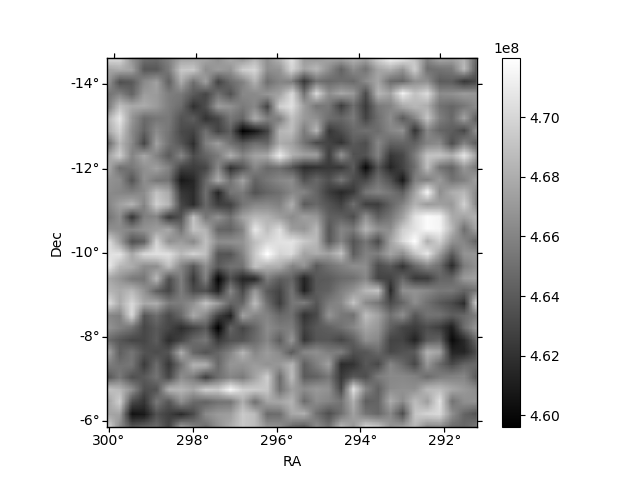
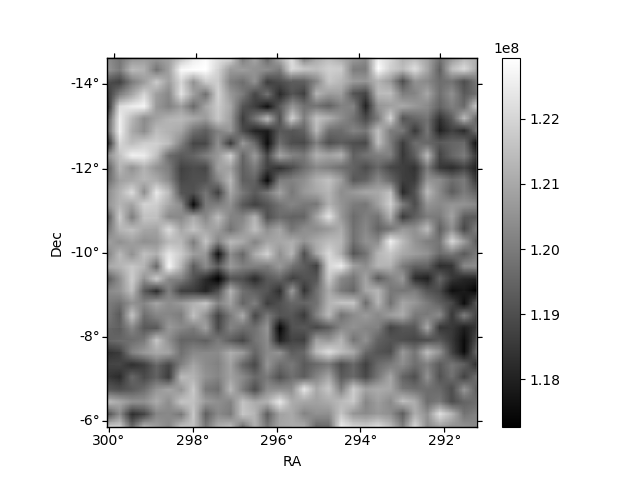
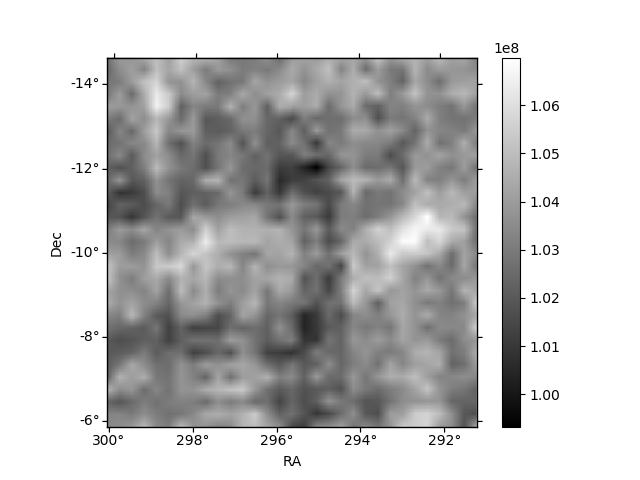
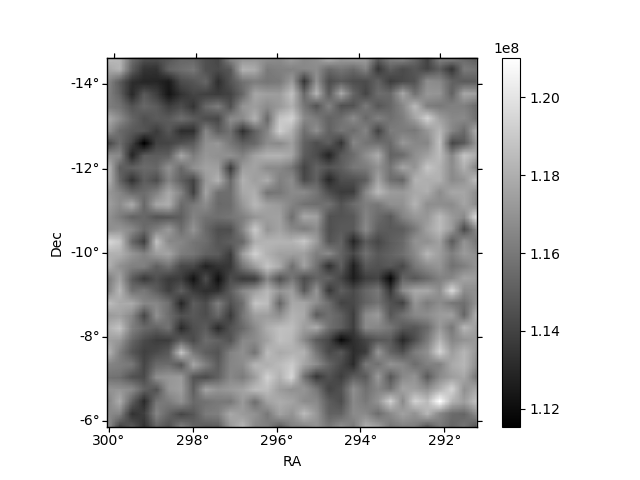
Histogram calculated using DETX and DETY for each event in the final _common_clean file
| Quadrant A | 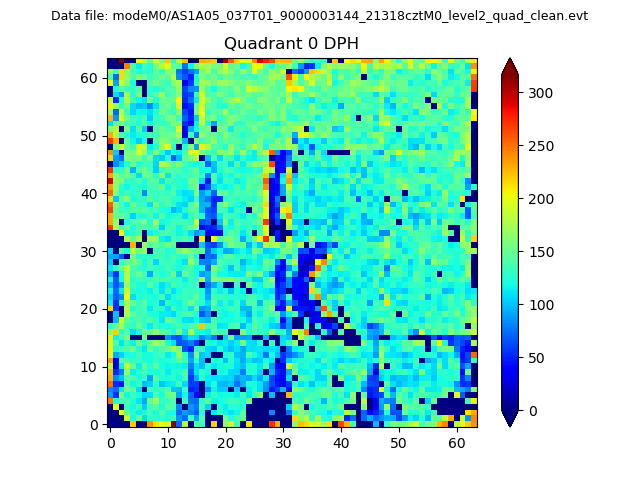 |
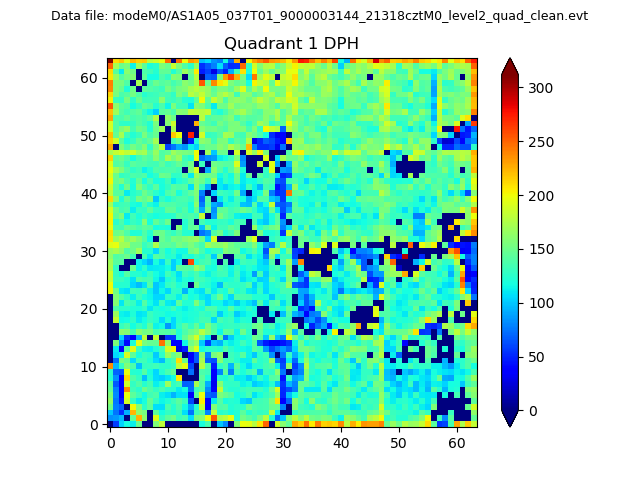 |
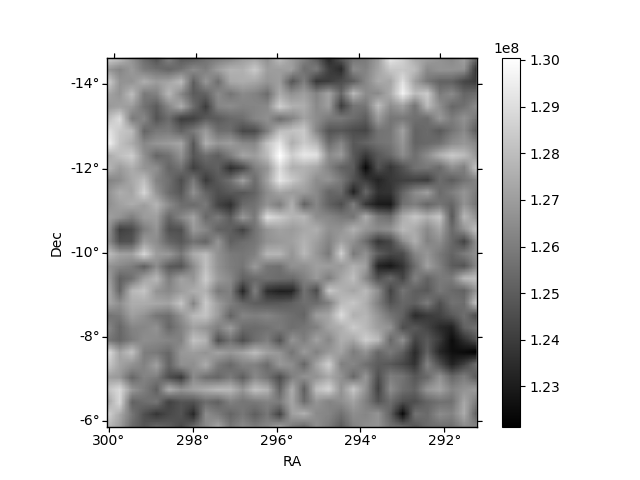
Quadrant B |
|---|---|---|---|
| Quadrant D | 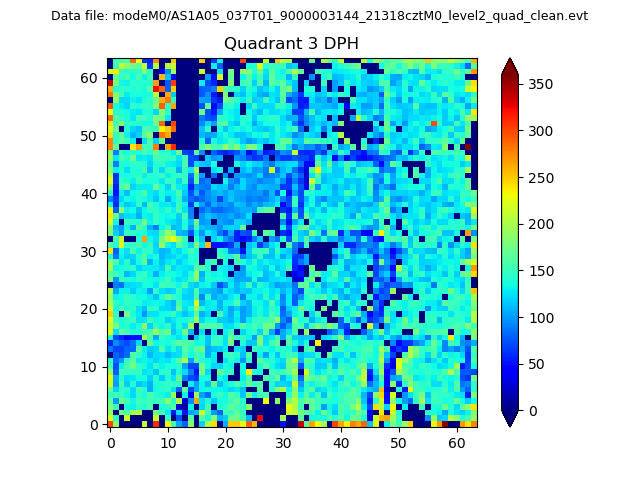 |
 |
Quadrant C |
| Plot type | Count rate plots | Images |
|---|---|---|
| Comparison with Poisson distribution Blue bars denote a histogram of data divided into 1 sec bins. Red curve is a Poisson curve with rate = median count rate of data. |
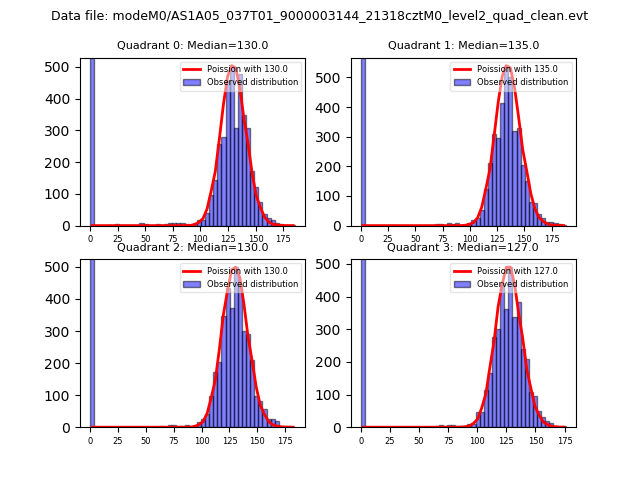 |
 |
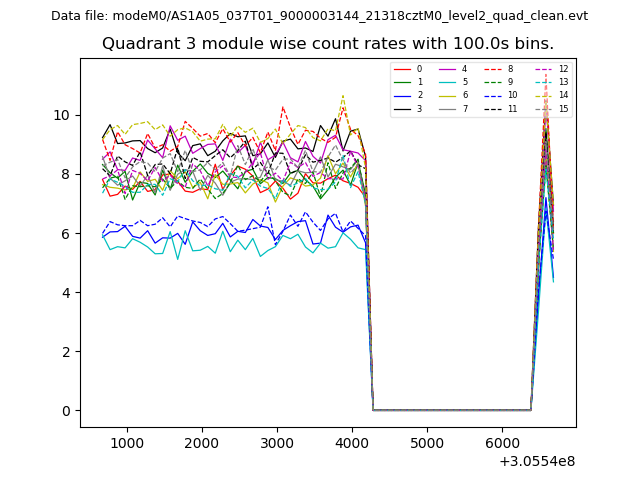
| Quadrant-wise count rates Data is divided into 100 sec bins |
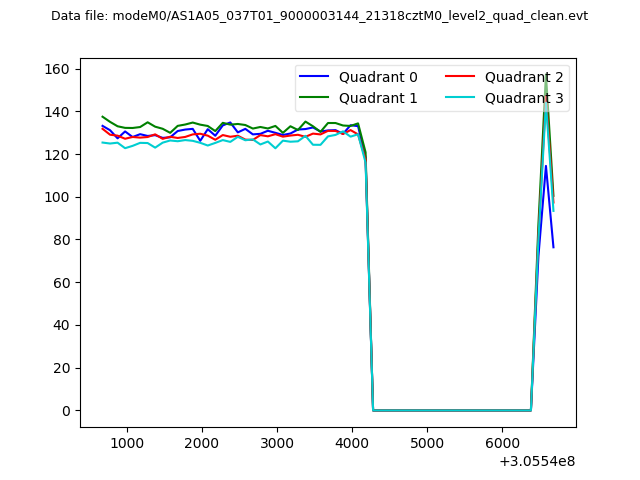 |
|
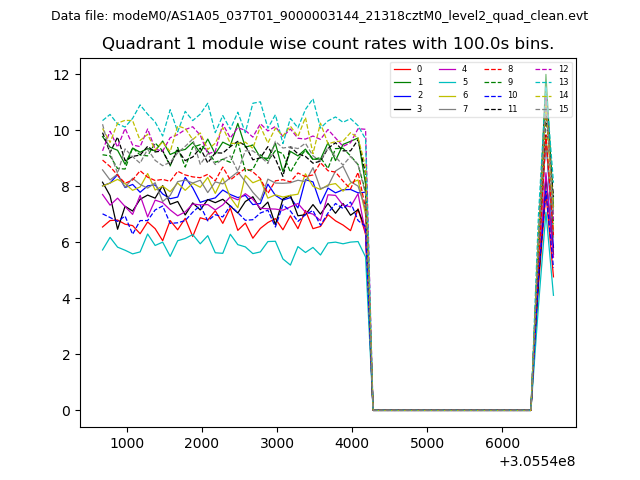
| Module-wise count rates for Quadrant A Data is divided into 100 sec bins |
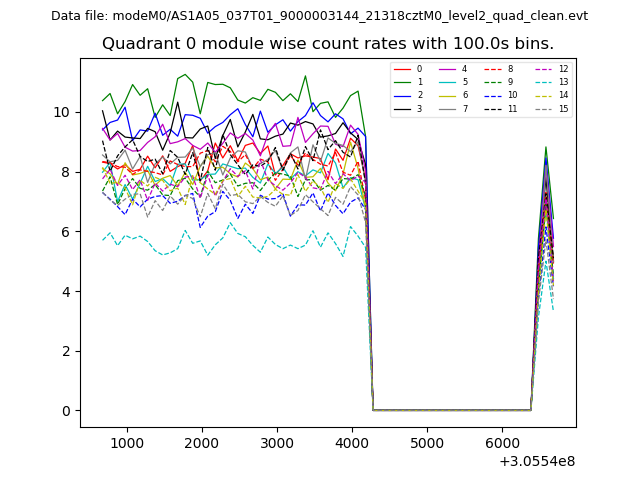 |
 |
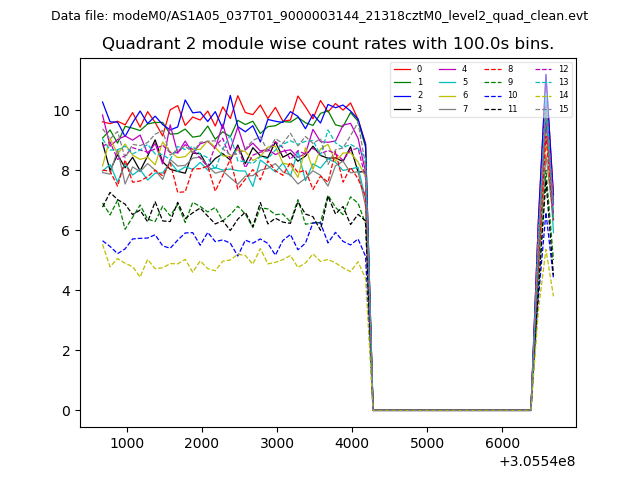
| Module-wise count rates for Quadrant B Data is divided into 100 sec bins |
 |
 |
| Module-wise count rates for Quadrant C Data is divided into 100 sec bins |
 |
 |
| Module-wise count rates for Quadrant D Data is divided into 100 sec bins |
 |
 |
| Parameter | Plot |
|---|---|
| CZT HV Monitor | 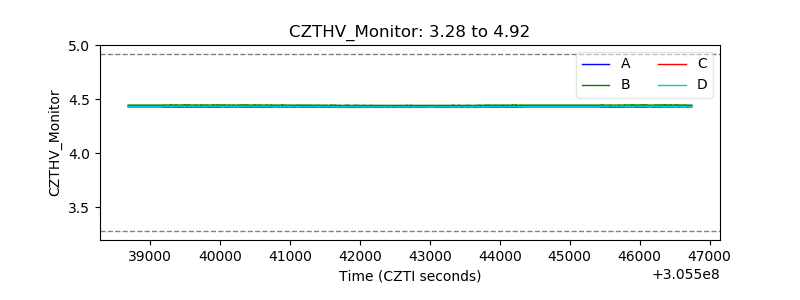 |
| D_VDD | 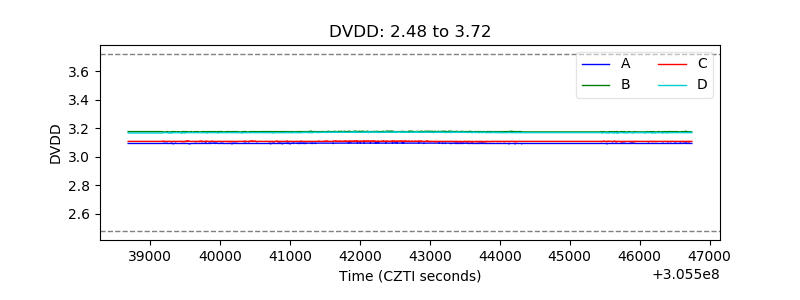 |
| Temperature 1 | 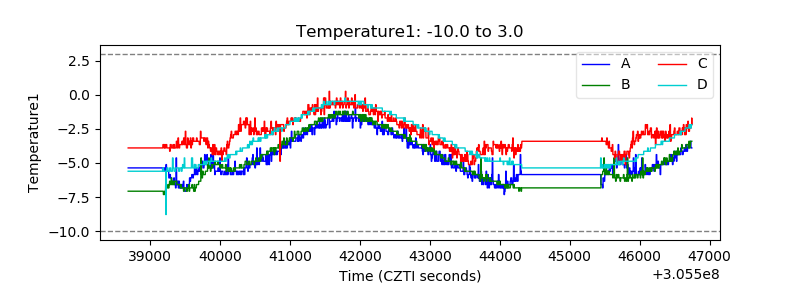 |
| Veto HV Monitor | 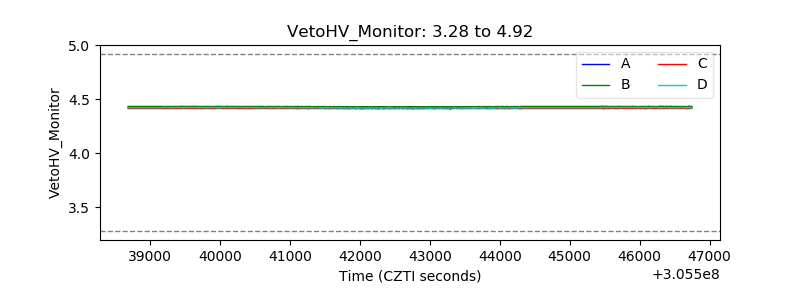 |
| Veto LLD | 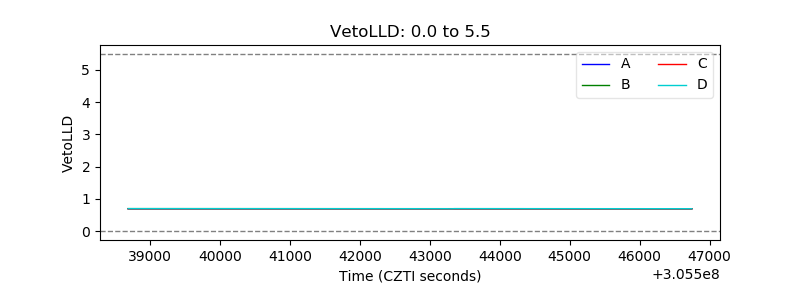 |
| Alpha Counter | 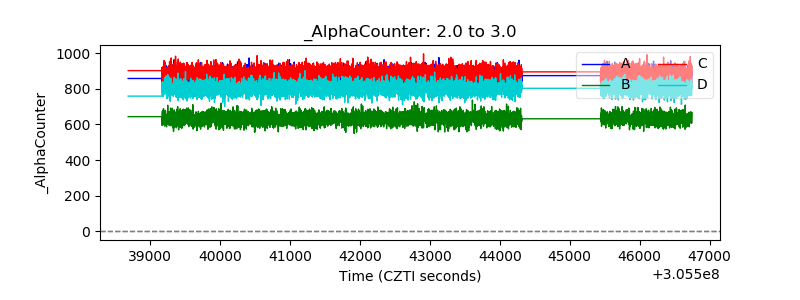 |
| _CPM_Rate | 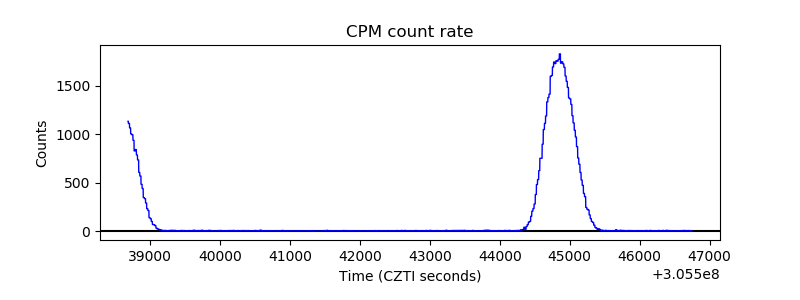 |
| CZT Counter | 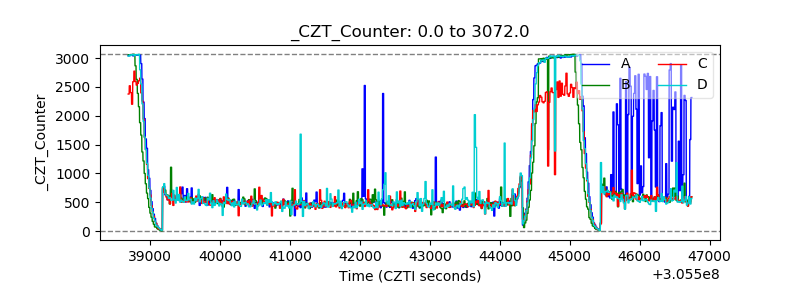 |
| +2.5 Volts monitor |  |
| +5 Volts monitor | 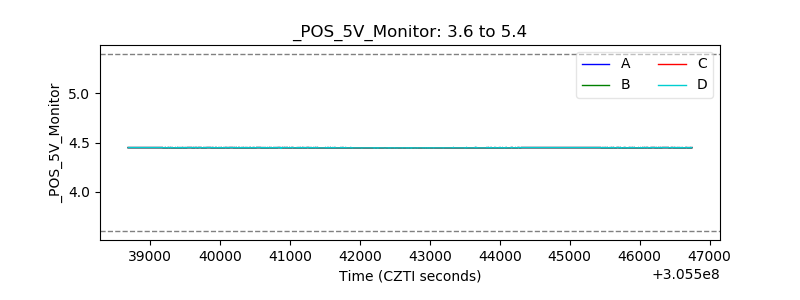 |
| _ROLL_ROT | 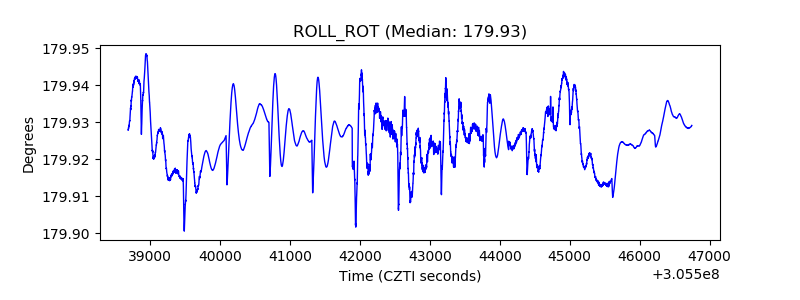 |
| _Roll_DEC | 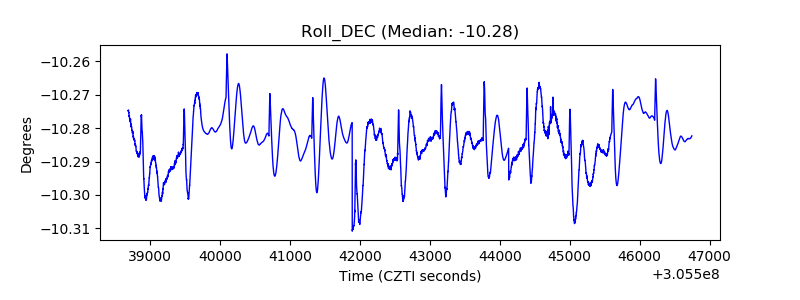 |
| _Roll_RA | 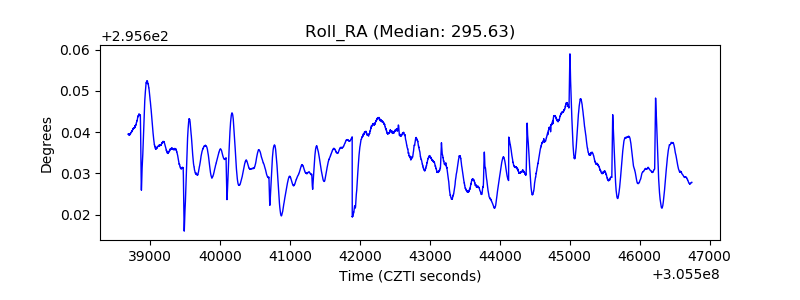 |
| Veto Counter | 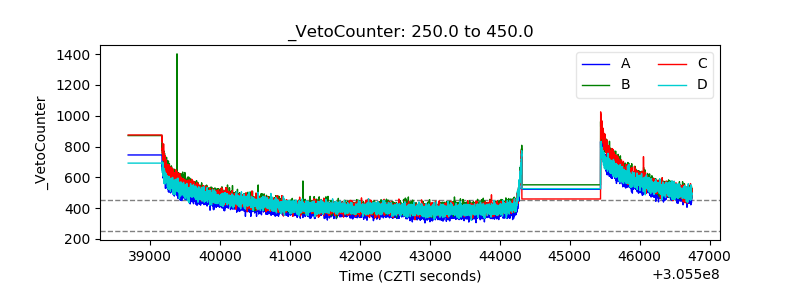 |