| Param | Original file | Final file |
|---|---|---|
| Filename | modeM0/AS1A05_037T01_9000003144_21322cztM0_level2.evt | modeM0/AS1A05_037T01_9000003144_21322cztM0_level2_quad_clean.evt |
| Size (bytes) | 487,123,200 | 114,598,080 |
| Size | 464.6 MB | 109.3 MB |
| Events in quadrant A | 3,468,883 | 774,264 |
| Events in quadrant B | 3,572,984 | 778,376 |
| Events in quadrant C | 3,361,360 | 737,962 |
| Events in quadrant D | 3,907,112 | 725,831 |
| Mode M0 | |||
|---|---|---|---|
| Quadrant | BADHDUFLAG | Total packets | Discarded packets |
| A | 0 | 14444 | 2 |
| B | 0 | 14815 | 2 |
| C | 0 | 14058 | 2 |
| D | 0 | 15980 | 3 |
| Mode SS | |||
|---|---|---|---|
| Quadrant | BADHDUFLAG | Total packets | Discarded packets |
| A | 0 | 132 | 0 |
| B | 0 | 132 | 0 |
| C | 0 | 132 | 0 |
| D | 0 | 132 | 0 |
| Mode M9 | |||
|---|---|---|---|
| Quadrant | BADHDUFLAG | Total packets | Discarded packets |
| A | 0 | 22 | 0 |
| B | 0 | 23 | 0 |
| C | 0 | 23 | 0 |
| D | 0 | 23 | 0 |
| Quadrant | Total seconds | Saturated seconds | Saturation percentage |
|---|---|---|---|
| A | 6519 | 87 | 1.334561% |
| B | 6519 | 102 | 1.564657% |
| C | 6519 | 98 | 1.503298% |
| D | 6518 | 80 | 1.227370% |
Noise dominated data is calculated using 1-second bins in cleaned event files. If a bin has >2000 counts, and if more than 50% of those come from <1% of pixels, then it is considered to be noise-dominated and hence unusable.
| Quadrant | # 1 sec bins | Bins with >0 counts | Bins with >2000 counts | High rate bins dominated by noise | Noise dominated (total time) | Noise dominated (detector-on time) | Marked lightcurve |
|---|---|---|---|---|---|---|---|
| A | 7814 | 6519 | 0 | 0 | 0.00% | 0.00% | 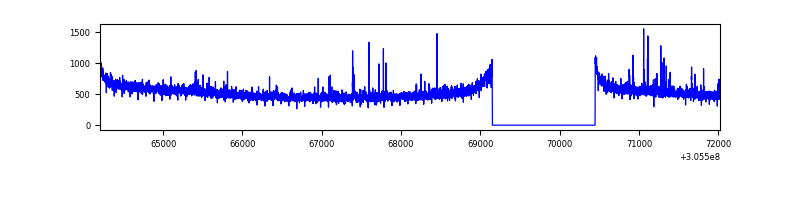 |
| B | 7814 | 6520 | 13 | 13 | 0.17% | 0.20% | 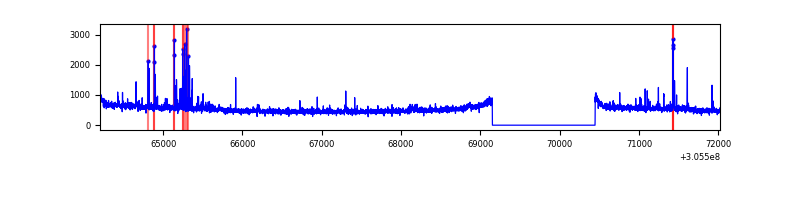 |
| C | 7814 | 6520 | 0 | 0 | 0.00% | 0.00% | 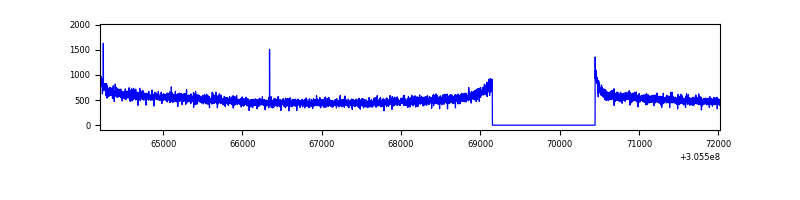 |
| D | 7813 | 6518 | 24 | 24 | 0.31% | 0.37% | 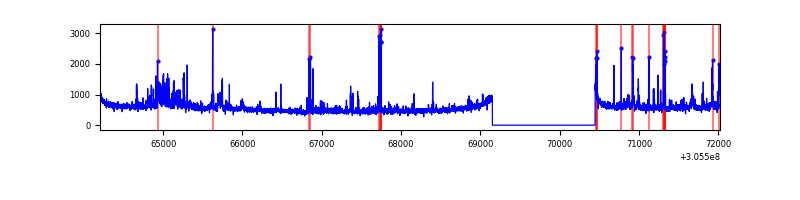 |
Top three noisy pixels from each quadrant. If the there are fewer than three noisy pixels in the level2.evt file, extra rows are filled as -1
| Pixel properties | Quadrant properties | ||||||
|---|---|---|---|---|---|---|---|
| Quadrant | DetID | PixID | Counts | Sigma | Mean | Median | Sigma |
| A | 10 | 253 | 32099 | 175.22 | 884 | 870 | 178.2 |
| A | 13 | 254 | 11201 | 57.97 | 884 | 870 | 178.2 |
| A | 5 | 16 | 8691 | 43.88 | 884 | 870 | 178.2 |
| B | 3 | 64 | 101521 | 620.87 | 866 | 847 | 162.1 |
| B | 0 | 190 | 29238 | 175.09 | 866 | 847 | 162.1 |
| B | 0 | 230 | 23319 | 138.59 | 866 | 847 | 162.1 |
| C | 14 | 238 | 132188 | 685.97 | 826 | 834 | 191.5 |
| C | 13 | 61 | 5954 | 26.74 | 826 | 834 | 191.5 |
| C | 0 | 10 | 5753 | 25.69 | 826 | 834 | 191.5 |
| D | 12 | 235 | 214833 | 1041.82 | 849 | 826 | 205.4 |
| D | 12 | 233 | 150082 | 726.6 | 849 | 826 | 205.4 |
| D | 13 | 153 | 93906 | 453.13 | 849 | 826 | 205.4 |
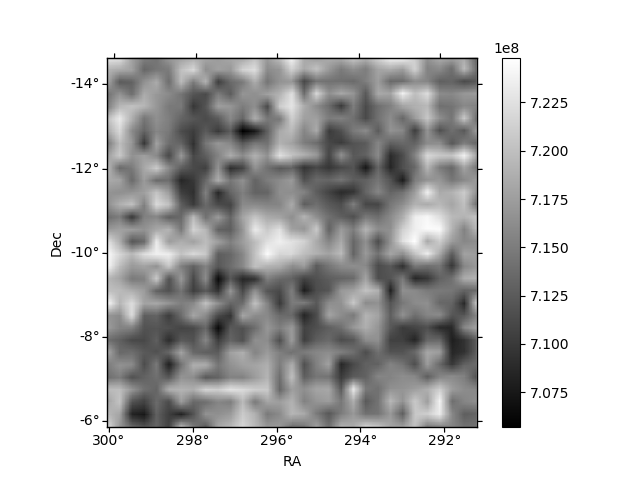
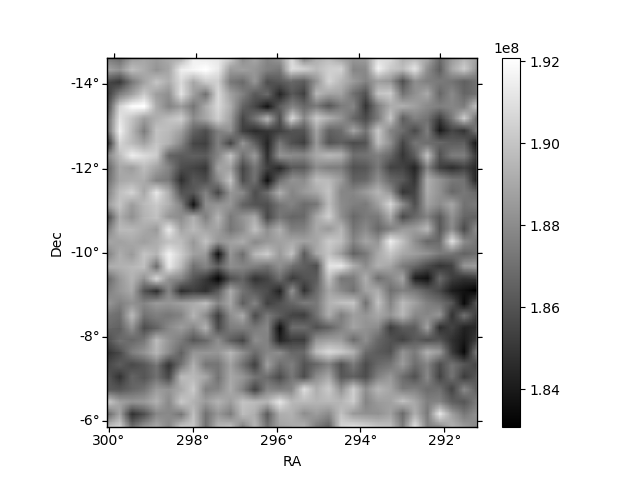
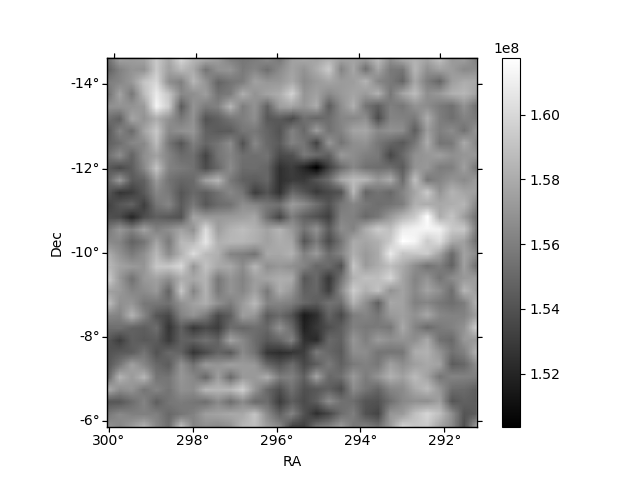
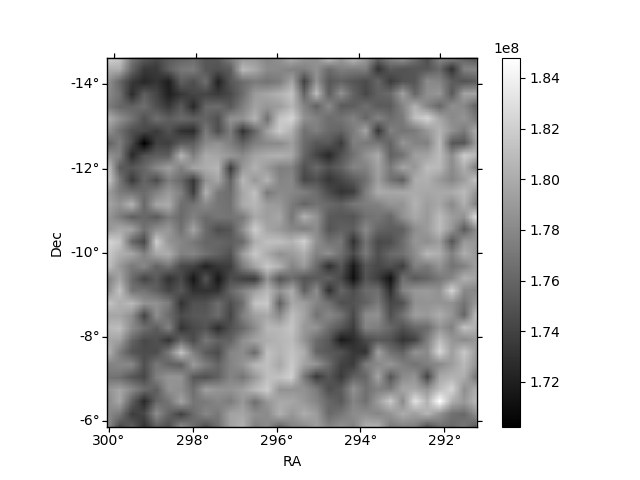
Histogram calculated using DETX and DETY for each event in the final _common_clean file
| Quadrant A | 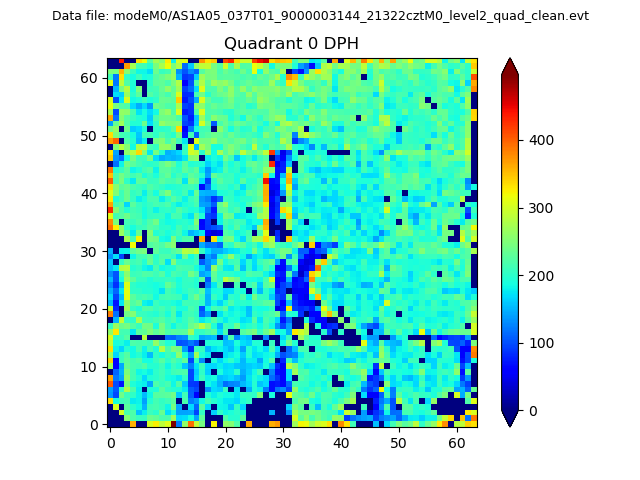 |
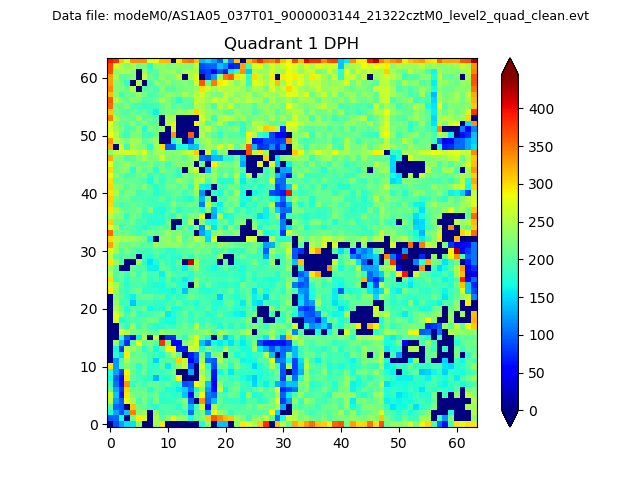 |
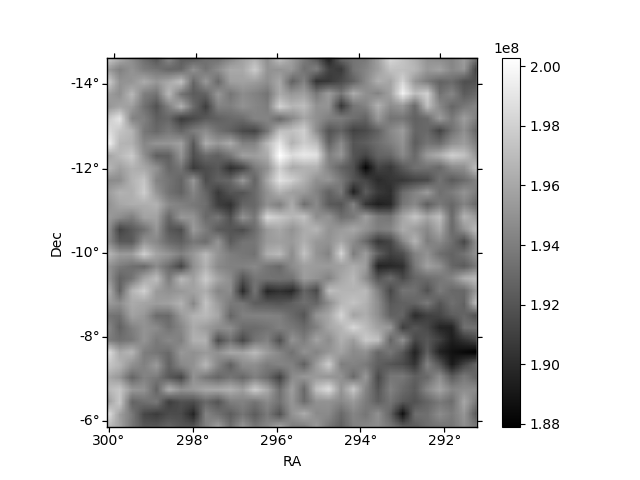
Quadrant B |
|---|---|---|---|
| Quadrant D | 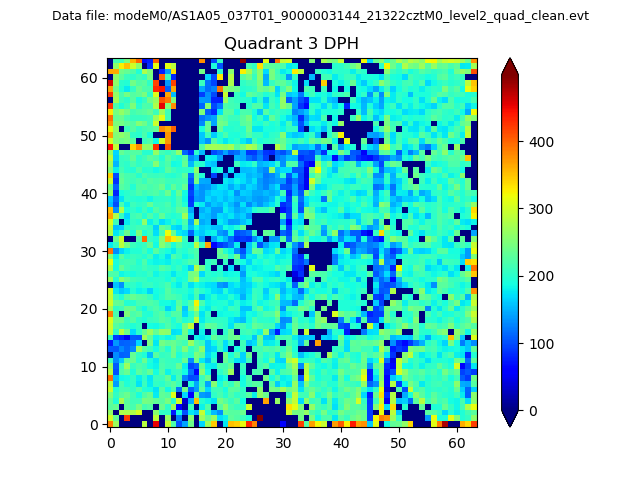 |
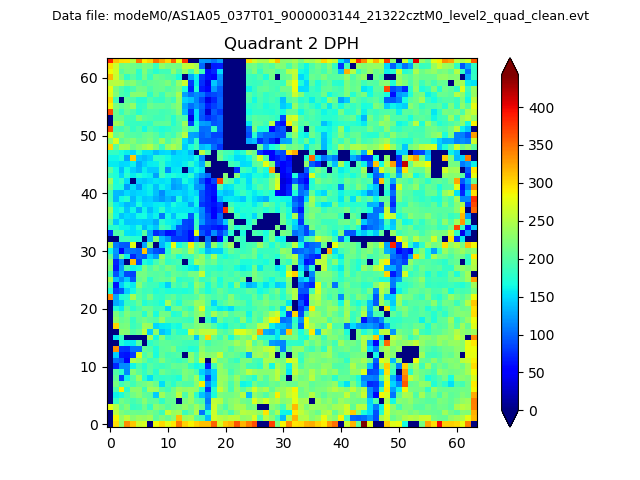 |
Quadrant C |
| Plot type | Count rate plots | Images |
|---|---|---|
| Comparison with Poisson distribution Blue bars denote a histogram of data divided into 1 sec bins. Red curve is a Poisson curve with rate = median count rate of data. |
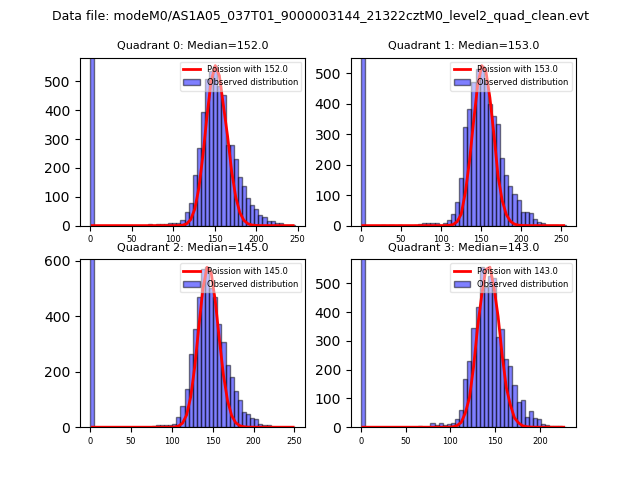 |
 |
| Quadrant-wise count rates Data is divided into 100 sec bins |
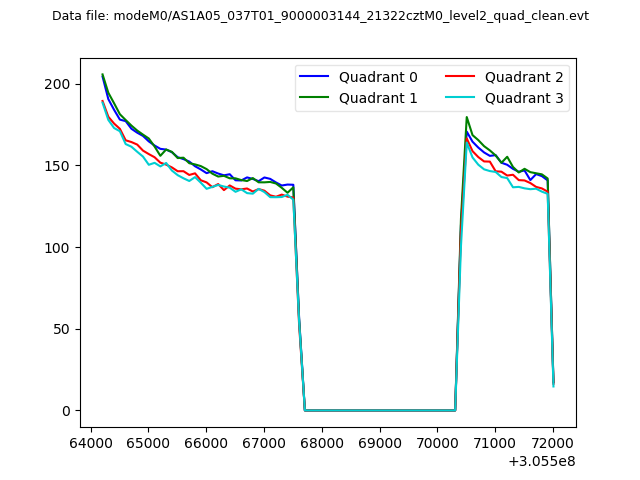 |
|
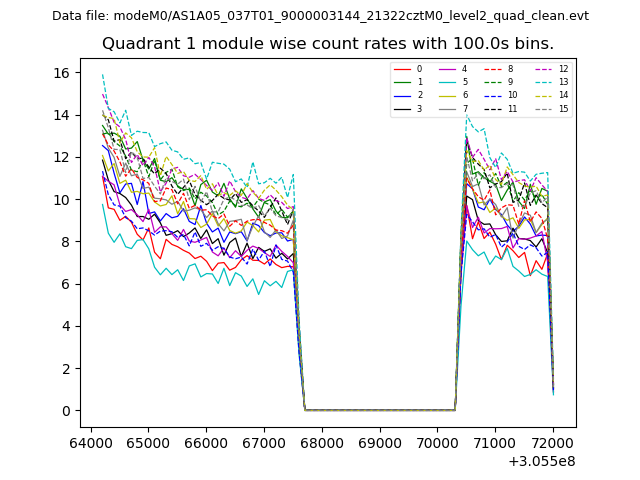
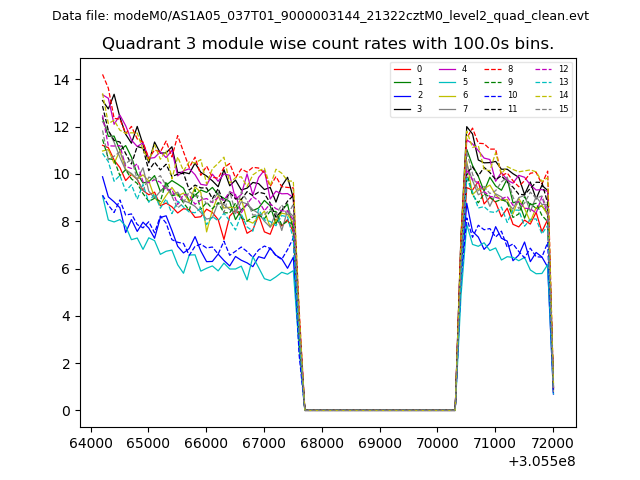
| Module-wise count rates for Quadrant A Data is divided into 100 sec bins |
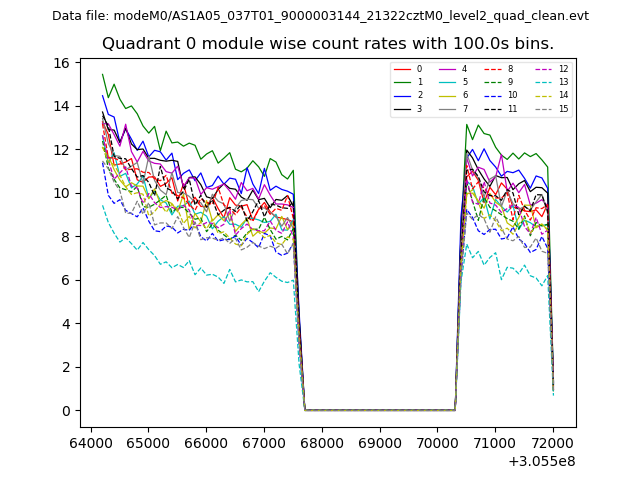 |
 |
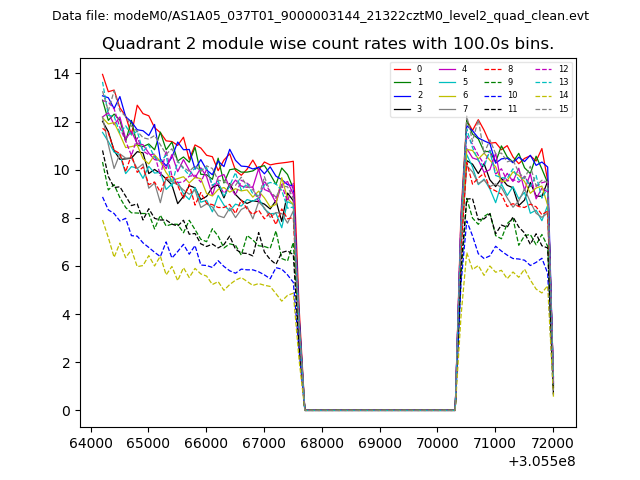
| Module-wise count rates for Quadrant B Data is divided into 100 sec bins |
 |
 |
| Module-wise count rates for Quadrant C Data is divided into 100 sec bins |
 |
 |
| Module-wise count rates for Quadrant D Data is divided into 100 sec bins |
 |
 |
| Parameter | Plot |
|---|---|
| CZT HV Monitor | 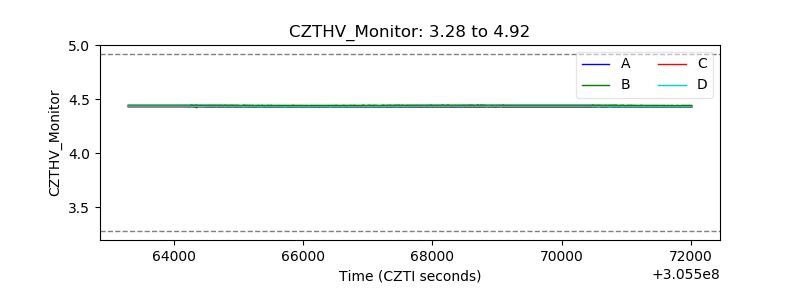 |
| D_VDD | 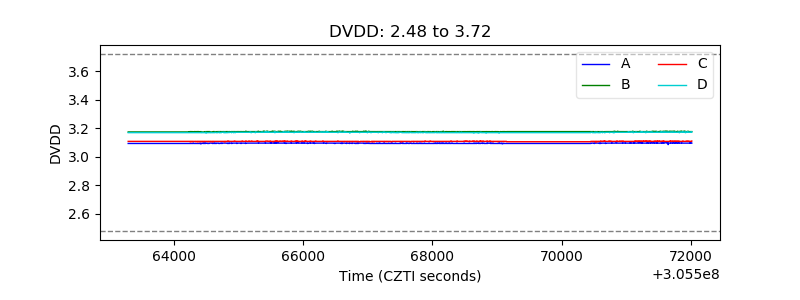 |
| Temperature 1 | 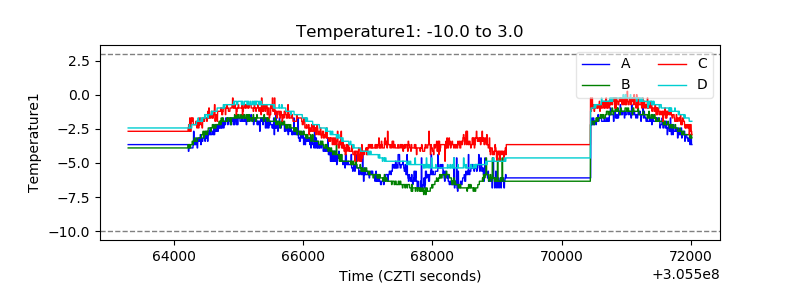 |
| Veto HV Monitor | 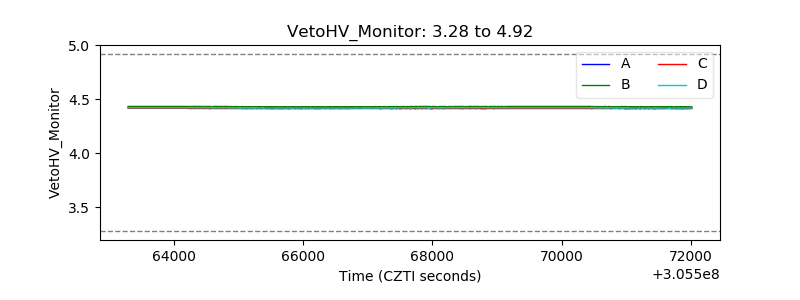 |
| Veto LLD | 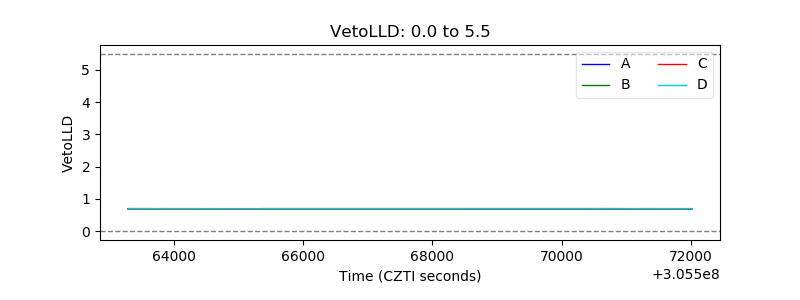 |
| Alpha Counter | 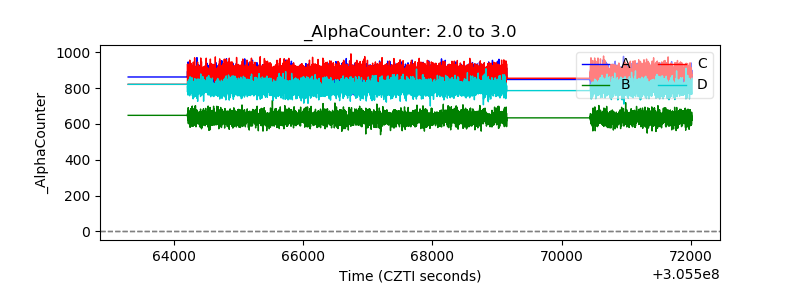 |
| _CPM_Rate | 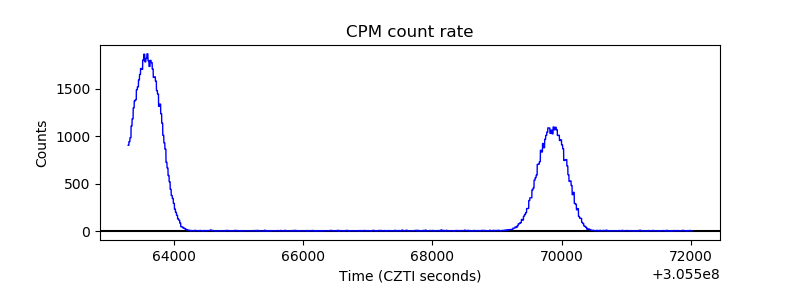 |
| CZT Counter | 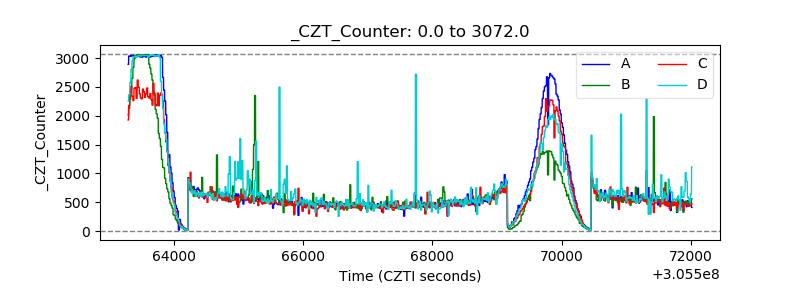 |
| +2.5 Volts monitor |  |
| +5 Volts monitor |  |
| _ROLL_ROT | 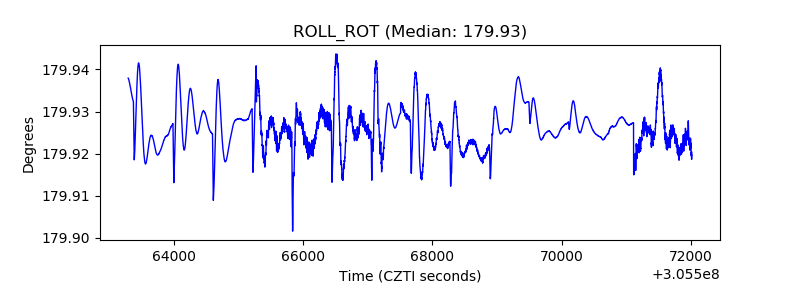 |
| _Roll_DEC | 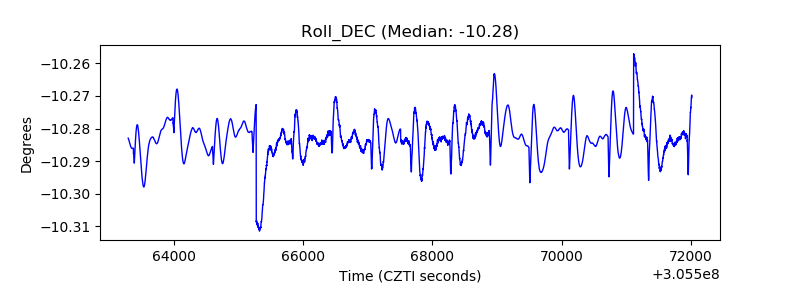 |
| _Roll_RA | 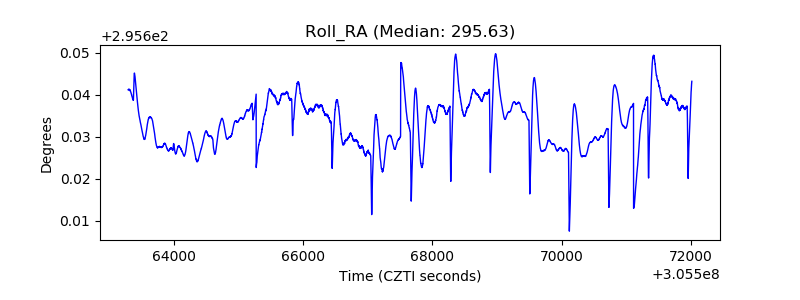 |
| Veto Counter | 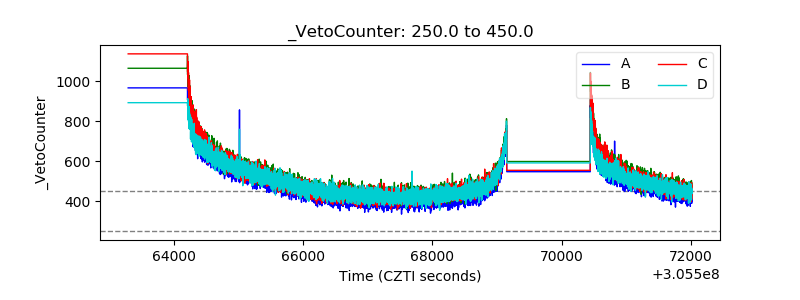 |