| Param | Original file | Final file |
|---|---|---|
| Filename | modeM0/AS1A05_037T01_9000003144_21323cztM0_level2.evt | modeM0/AS1A05_037T01_9000003144_21323cztM0_level2_quad_clean.evt |
| Size (bytes) | 482,558,400 | 96,912,000 |
| Size | 460.2 MB | 92.4 MB |
| Events in quadrant A | 3,434,314 | 631,551 |
| Events in quadrant B | 3,427,954 | 640,788 |
| Events in quadrant C | 3,266,265 | 611,323 |
| Events in quadrant D | 4,040,533 | 593,821 |
| Mode M0 | |||
|---|---|---|---|
| Quadrant | BADHDUFLAG | Total packets | Discarded packets |
| A | 0 | 14363 | 2 |
| B | 0 | 14304 | 2 |
| C | 0 | 13858 | 2 |
| D | 0 | 16405 | 2 |
| Mode SS | |||
|---|---|---|---|
| Quadrant | BADHDUFLAG | Total packets | Discarded packets |
| A | 0 | 134 | 0 |
| B | 0 | 134 | 0 |
| C | 0 | 134 | 0 |
| D | 0 | 134 | 0 |
| Mode M9 | |||
|---|---|---|---|
| Quadrant | BADHDUFLAG | Total packets | Discarded packets |
| A | 0 | 11 | 0 |
| B | 0 | 11 | 0 |
| C | 0 | 11 | 0 |
| D | 0 | 11 | 0 |
| Quadrant | Total seconds | Saturated seconds | Saturation percentage |
|---|---|---|---|
| A | 6556 | 80 | 1.220256% |
| B | 6557 | 84 | 1.281074% |
| C | 6557 | 96 | 1.464084% |
| D | 6557 | 121 | 1.845356% |
Noise dominated data is calculated using 1-second bins in cleaned event files. If a bin has >2000 counts, and if more than 50% of those come from <1% of pixels, then it is considered to be noise-dominated and hence unusable.
| Quadrant | # 1 sec bins | Bins with >0 counts | Bins with >2000 counts | High rate bins dominated by noise | Noise dominated (total time) | Noise dominated (detector-on time) | Marked lightcurve |
|---|---|---|---|---|---|---|---|
| A | 7646 | 6556 | 4 | 4 | 0.05% | 0.06% | 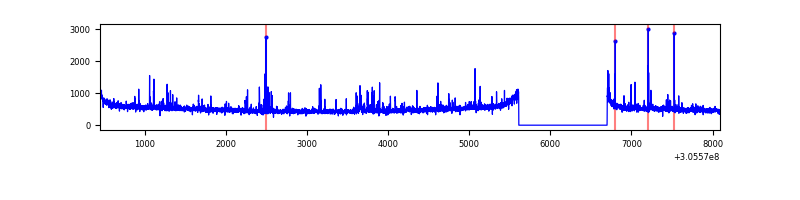 |
| B | 7647 | 6557 | 3 | 3 | 0.04% | 0.05% | 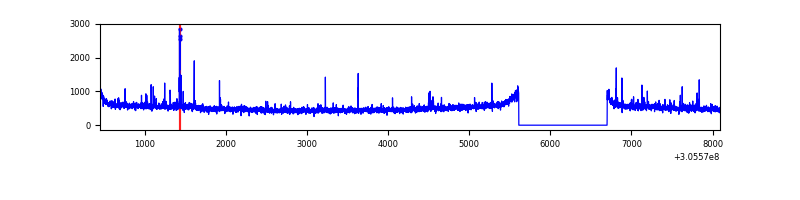 |
| C | 7647 | 6557 | 0 | 0 | 0.00% | 0.00% | 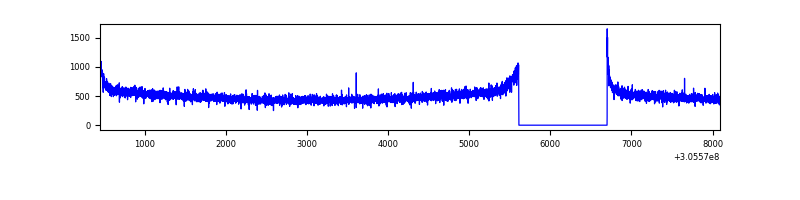 |
| D | 7647 | 6557 | 68 | 68 | 0.89% | 1.04% | 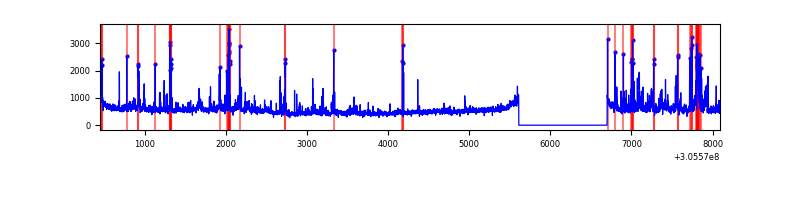 |
Top three noisy pixels from each quadrant. If the there are fewer than three noisy pixels in the level2.evt file, extra rows are filled as -1
| Pixel properties | Quadrant properties | ||||||
|---|---|---|---|---|---|---|---|
| Quadrant | DetID | PixID | Counts | Sigma | Mean | Median | Sigma |
| A | 10 | 253 | 99146 | 572.59 | 850 | 835 | 171.7 |
| A | 9 | 143 | 24096 | 135.48 | 850 | 835 | 171.7 |
| A | 12 | 96 | 12098 | 65.6 | 850 | 835 | 171.7 |
| B | 3 | 64 | 39737 | 243.59 | 842 | 824 | 159.7 |
| B | 0 | 190 | 34391 | 210.13 | 842 | 824 | 159.7 |
| B | 0 | 230 | 22498 | 135.68 | 842 | 824 | 159.7 |
| C | 14 | 238 | 127936 | 679.06 | 801 | 808 | 187.2 |
| C | 0 | 10 | 10832 | 53.54 | 801 | 808 | 187.2 |
| C | 13 | 61 | 5705 | 26.16 | 801 | 808 | 187.2 |
| D | 12 | 235 | 270629 | 1378.74 | 815 | 795 | 195.7 |
| D | 7 | 38 | 182573 | 928.81 | 815 | 795 | 195.7 |
| D | 13 | 153 | 120384 | 611.05 | 815 | 795 | 195.7 |
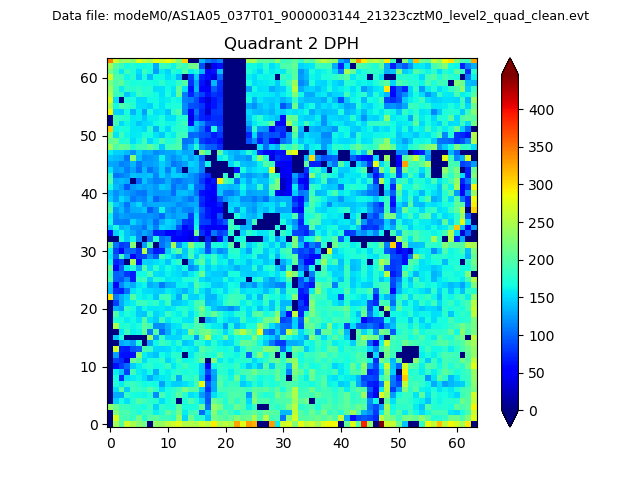
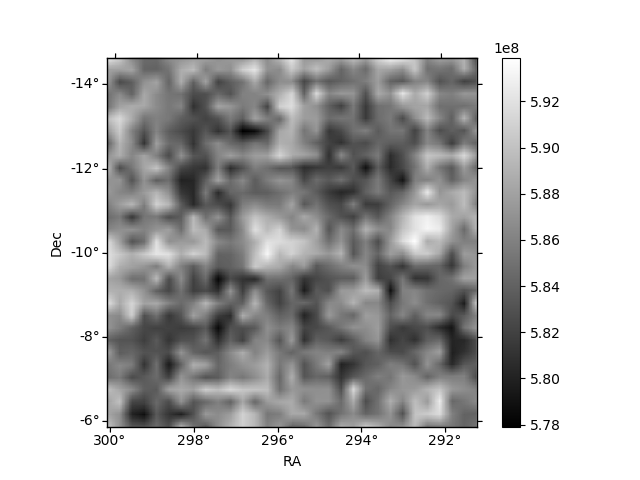
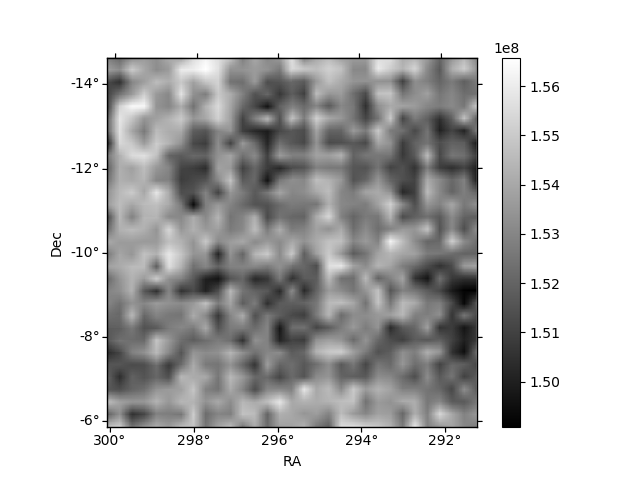
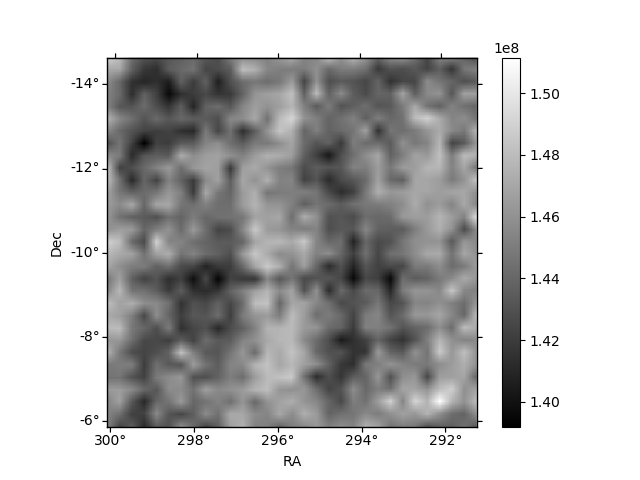
Histogram calculated using DETX and DETY for each event in the final _common_clean file
| Quadrant A | 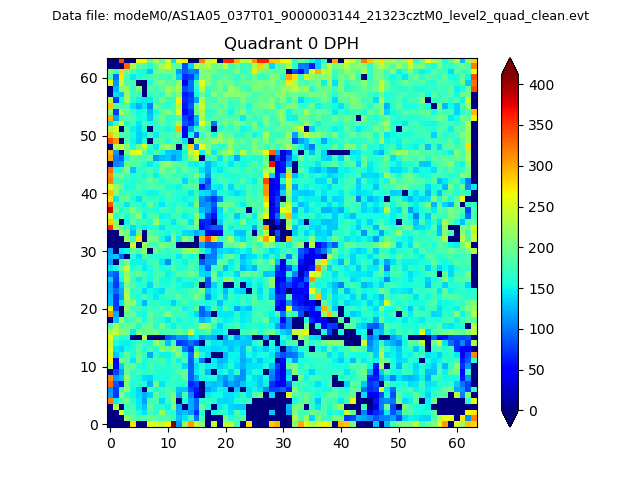 |
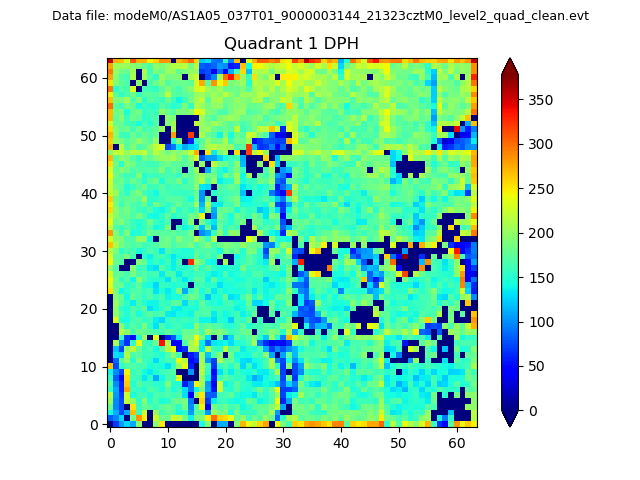 |
Quadrant B |
|---|---|---|---|
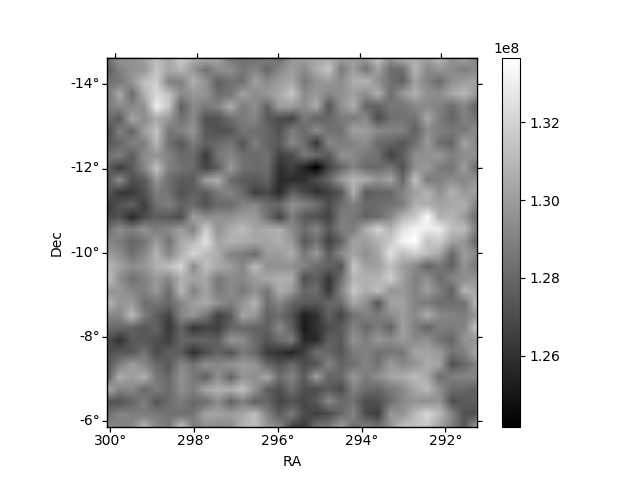
| Quadrant D | 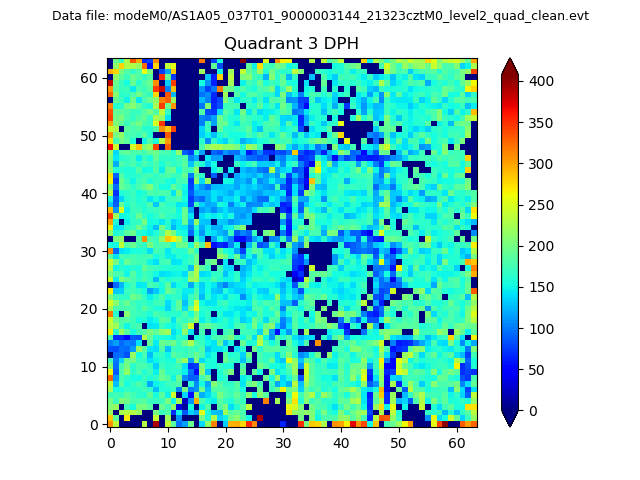 |
 |
Quadrant C |
| Plot type | Count rate plots | Images |
|---|---|---|
| Comparison with Poisson distribution Blue bars denote a histogram of data divided into 1 sec bins. Red curve is a Poisson curve with rate = median count rate of data. |
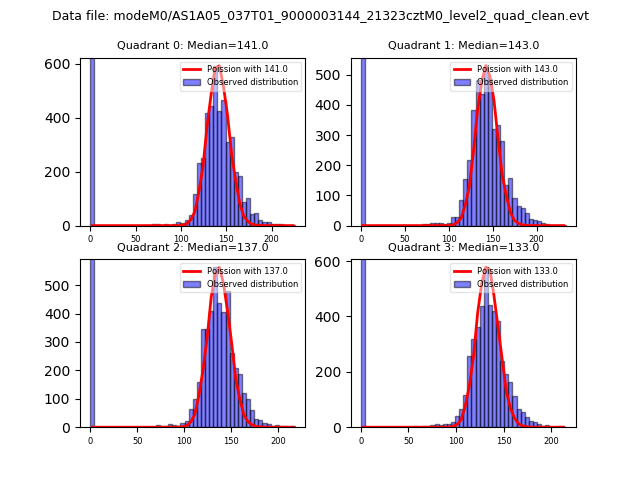 |
 |
| Quadrant-wise count rates Data is divided into 100 sec bins |
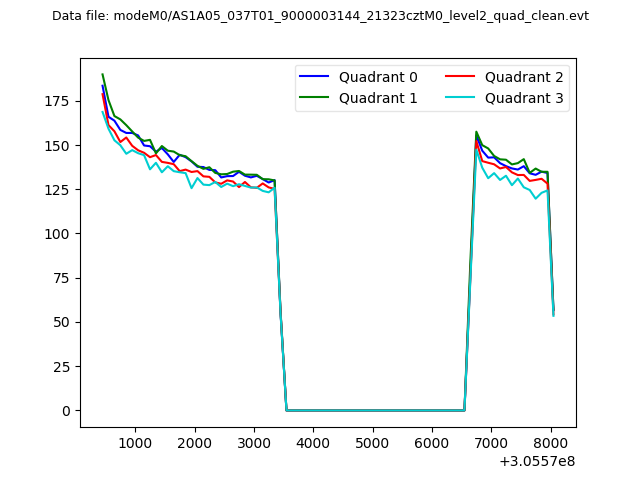 |
|
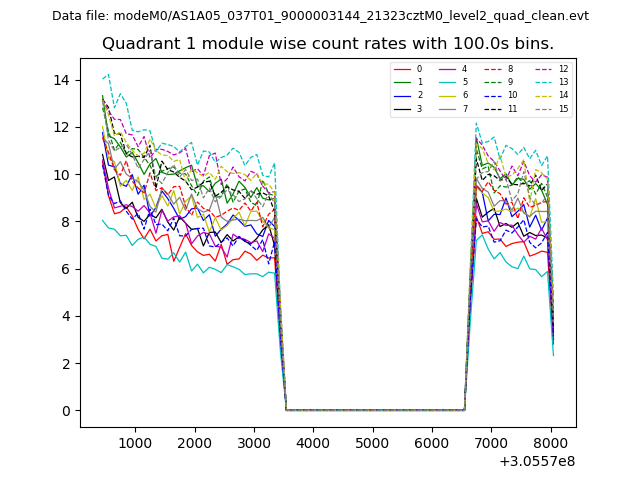
| Module-wise count rates for Quadrant A Data is divided into 100 sec bins |
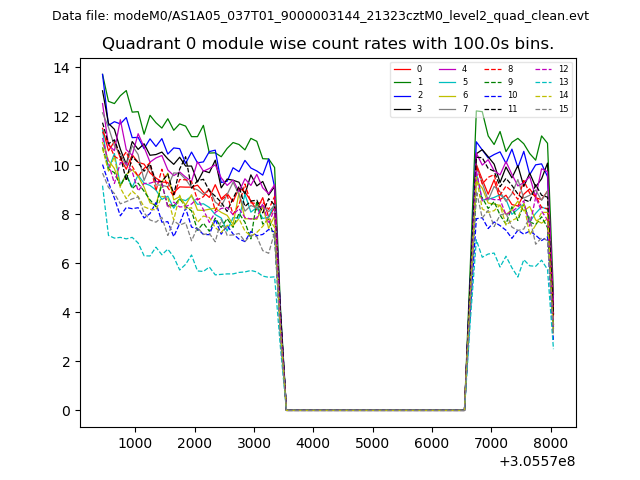 |
 |
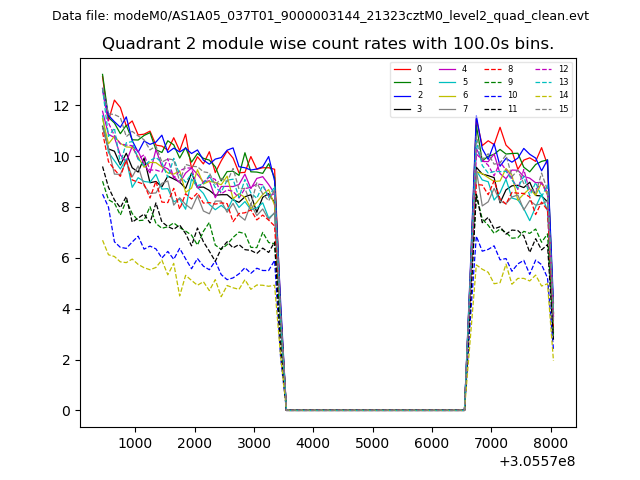
| Module-wise count rates for Quadrant B Data is divided into 100 sec bins |
 |
 |
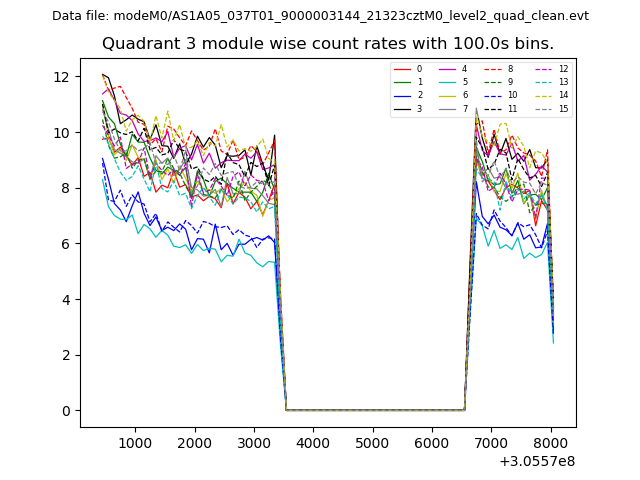
| Module-wise count rates for Quadrant C Data is divided into 100 sec bins |
 |
 |
| Module-wise count rates for Quadrant D Data is divided into 100 sec bins |
 |
 |
| Parameter | Plot |
|---|---|
| CZT HV Monitor | 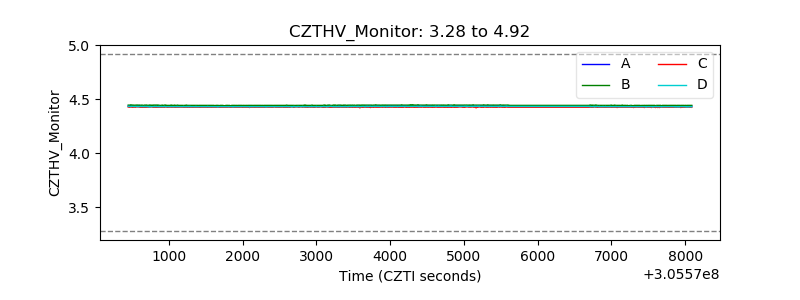 |
| D_VDD | 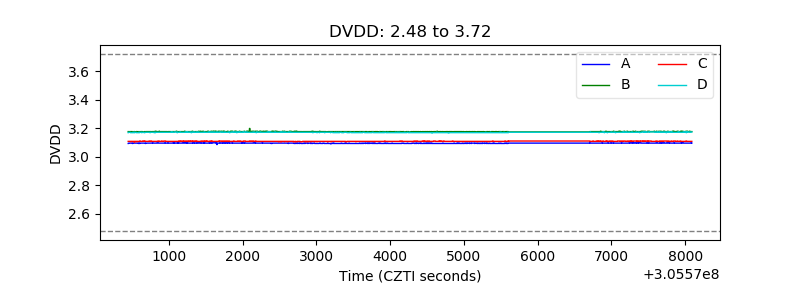 |
| Temperature 1 | 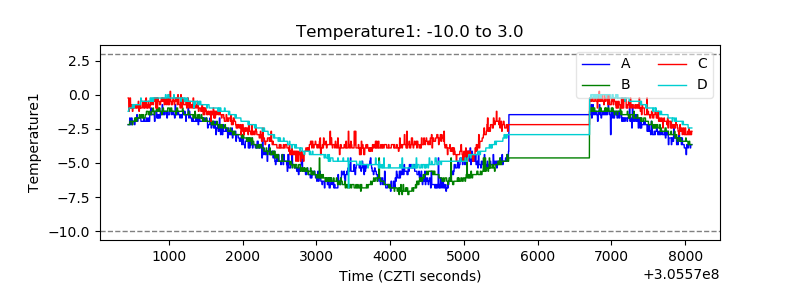 |
| Veto HV Monitor | 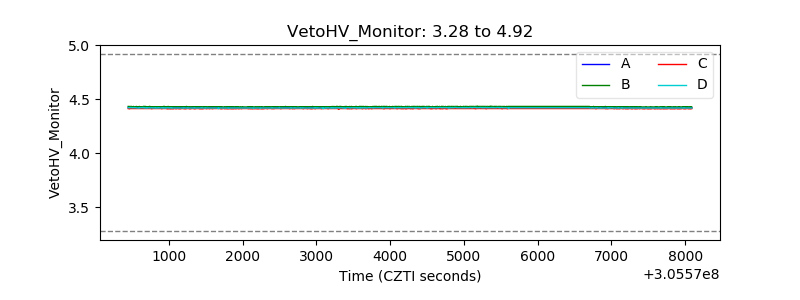 |
| Veto LLD | 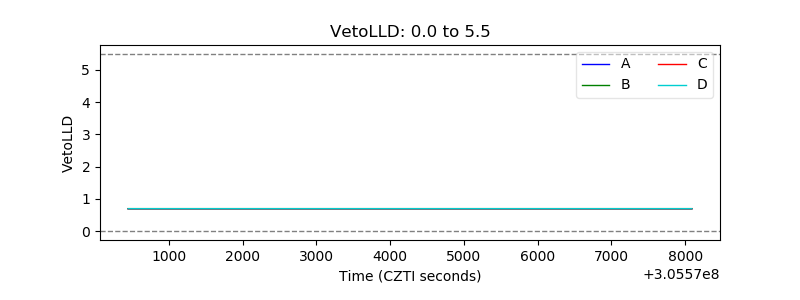 |
| Alpha Counter | 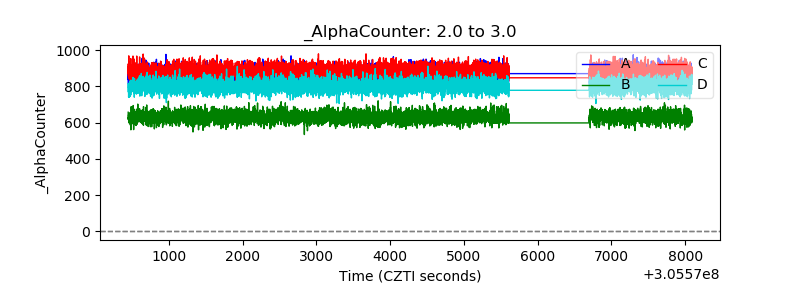 |
| _CPM_Rate | 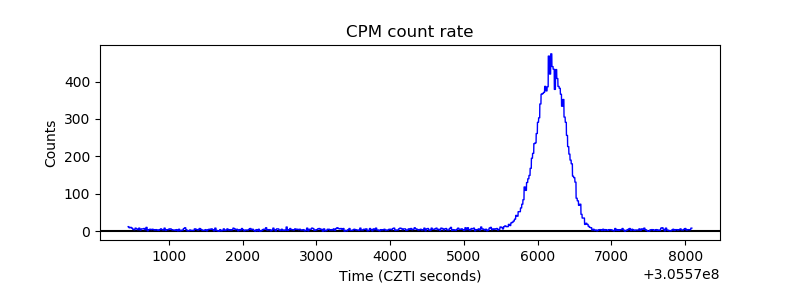 |
| CZT Counter | 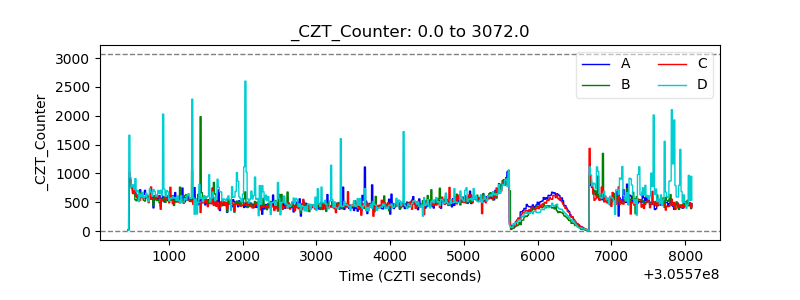 |
| +2.5 Volts monitor |  |
| +5 Volts monitor | 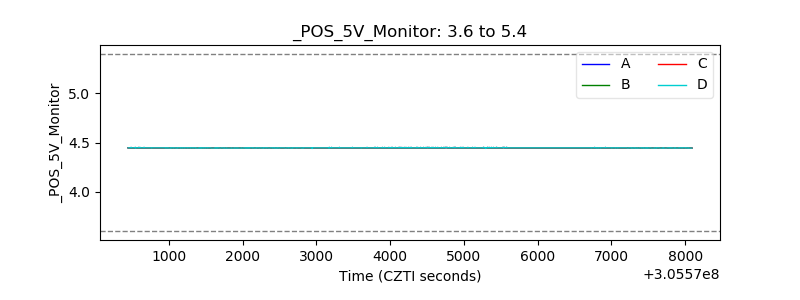 |
| _ROLL_ROT | 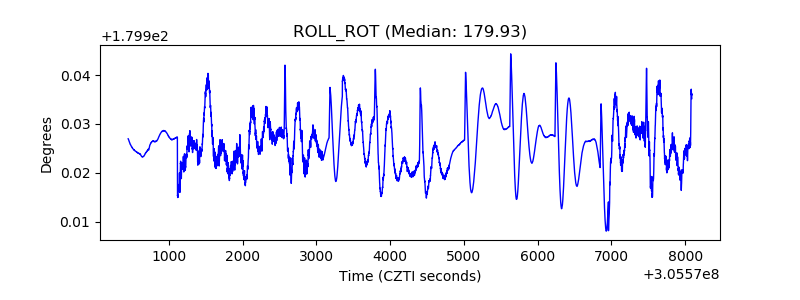 |
| _Roll_DEC | 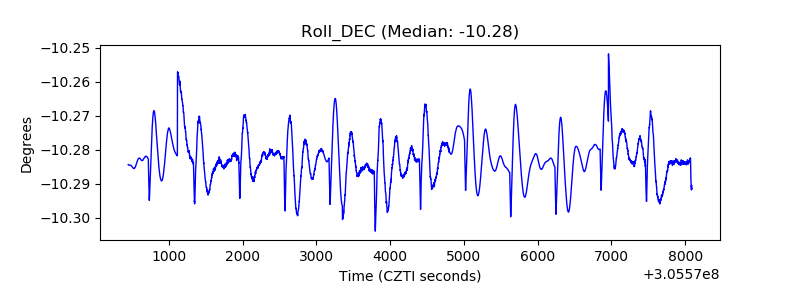 |
| _Roll_RA | 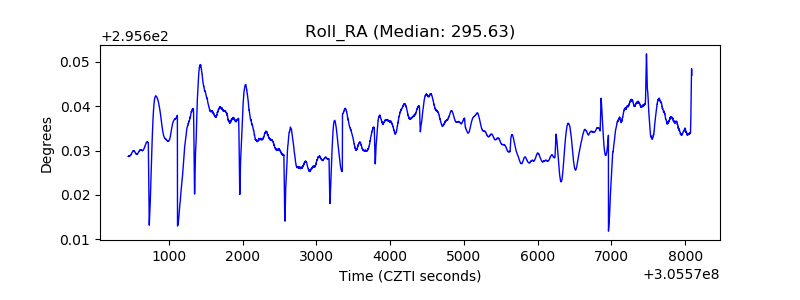 |
| Veto Counter | 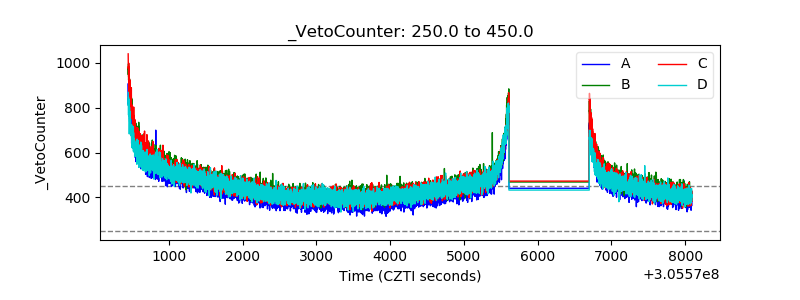 |